| Param | Original file | Final file |
|---|---|---|
| Filename | modeM0/AS1A13_003T01_9000006486_52963cztM0_level2.fits | modeM0/AS1A13_003T01_9000006486_52963cztM0_level2_quad_clean.evt |
| Size (bytes) | 834,713,280 | 72,452,160 |
| Size | 796.0 MB | 69.1 MB |
| Events in quadrant A | 10,785,800 | 240,272 |
| Events in quadrant B | 4,330,154 | 628,255 |
| Events in quadrant C | 5,195,812 | 531,007 |
| Events in quadrant D | 10,113,823 | 367,323 |
| Mode M9 | |||
|---|---|---|---|
| Quadrant | BADHDUFLAG | Total packets | Discarded packets |
| A | 0 | 11 | 0 |
| B | 0 | 11 | 0 |
| C | 0 | 11 | 0 |
| D | 0 | 11 | 0 |
| Mode M0 | |||
|---|---|---|---|
| Quadrant | BADHDUFLAG | Total packets | Discarded packets |
| A | 0 | 36179 | 1 |
| B | 0 | 17033 | 3 |
| C | 0 | 19680 | 1 |
| D | 0 | 34312 | 1 |
| Mode SS | |||
|---|---|---|---|
| Quadrant | BADHDUFLAG | Total packets | Discarded packets |
| A | 0 | 124 | 0 |
| B | 0 | 124 | 0 |
| C | 0 | 124 | 0 |
| D | 0 | 124 | 0 |
| Quadrant | Total seconds | Saturated seconds | Saturation percentage |
|---|---|---|---|
| A | 6113 | 3776 | 61.769998% |
| B | 6112 | 278 | 4.548429% |
| C | 6112 | 493 | 8.066099% |
| D | 6113 | 2145 | 35.089154% |
Noise dominated data is calculated using 1-second bins in cleaned event files. If a bin has >2000 counts, and if more than 50% of those come from <1% of pixels, then it is considered to be noise-dominated and hence unusable.
| Quadrant | # 1 sec bins | Bins with >0 counts | Bins with >2000 counts | High rate bins dominated by noise | Noise dominated (total time) | Noise dominated (detector-on time) | Marked lightcurve |
|---|---|---|---|---|---|---|---|
| A | 7202 | 6112 | 3548 | 3548 | 49.26% | 58.05% | 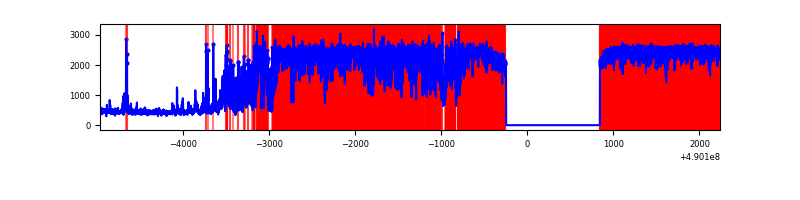 |
| B | 7202 | 6112 | 123 | 123 | 1.71% | 2.01% | 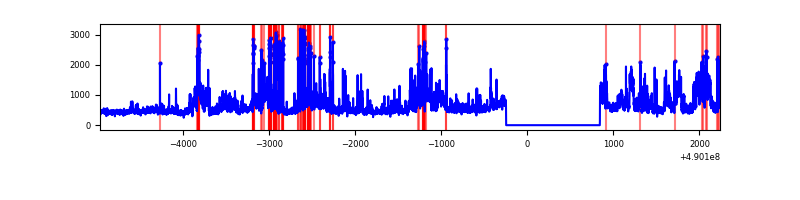 |
| C | 7201 | 6112 | 421 | 421 | 5.85% | 6.89% | 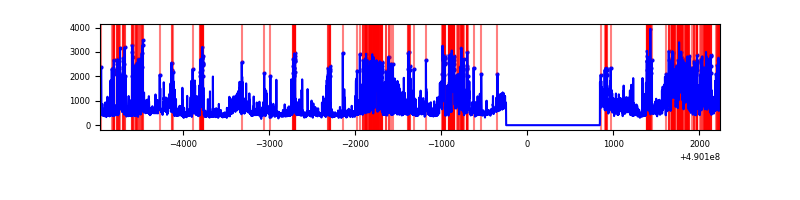 |
| D | 7202 | 6112 | 2060 | 2060 | 28.60% | 33.70% | 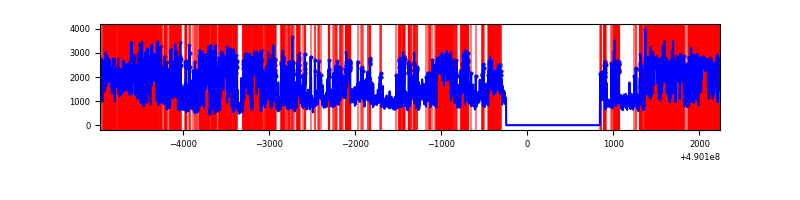 |
Top three noisy pixels from each quadrant. If the there are fewer than three noisy pixels in the level2.evt file, extra rows are filled as -1
| Pixel properties | Quadrant properties | ||||||
|---|---|---|---|---|---|---|---|
| Quadrant | DetID | PixID | Counts | Sigma | Mean | Median | Sigma |
| A | 9 | 191 | 8697098 | 78849.4 | 444 | 432 | 110.3 |
| A | 4 | 249 | 79646 | 718.2 | 444 | 432 | 110.3 |
| A | 0 | 8 | 77585 | 699.52 | 444 | 432 | 110.3 |
| B | 10 | 254 | 792405 | 5608.87 | 655 | 633 | 141.2 |
| B | 10 | 63 | 274500 | 1940.06 | 655 | 633 | 141.2 |
| B | 1 | 255 | 249776 | 1764.91 | 655 | 633 | 141.2 |
| C | 12 | 254 | 616969 | 3632.73 | 625 | 621 | 169.7 |
| C | 4 | 5 | 553324 | 3257.61 | 625 | 621 | 169.7 |
| C | 2 | 12 | 392424 | 2309.27 | 625 | 621 | 169.7 |
| D | 8 | 176 | 4081580 | 26371.11 | 547 | 524 | 154.8 |
| D | 15 | 78 | 1485686 | 9596.87 | 547 | 524 | 154.8 |
| D | 2 | 62 | 910950 | 5883.02 | 547 | 524 | 154.8 |
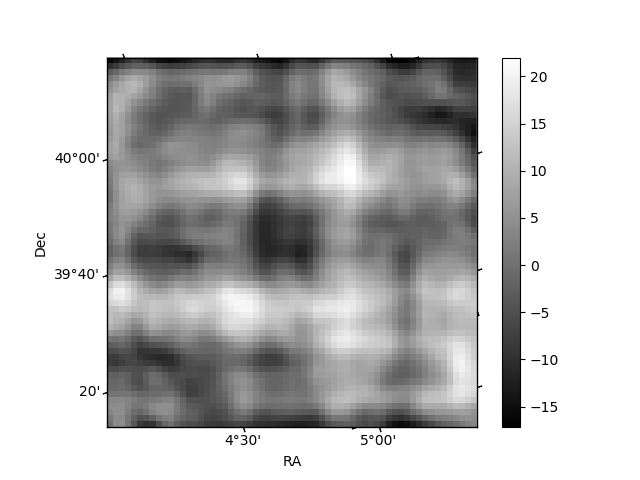
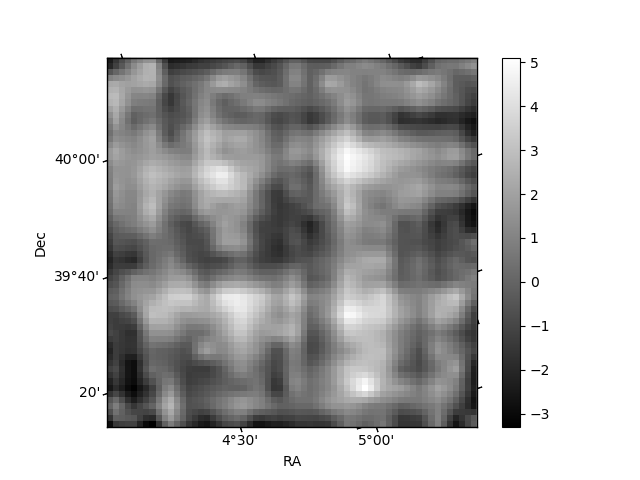
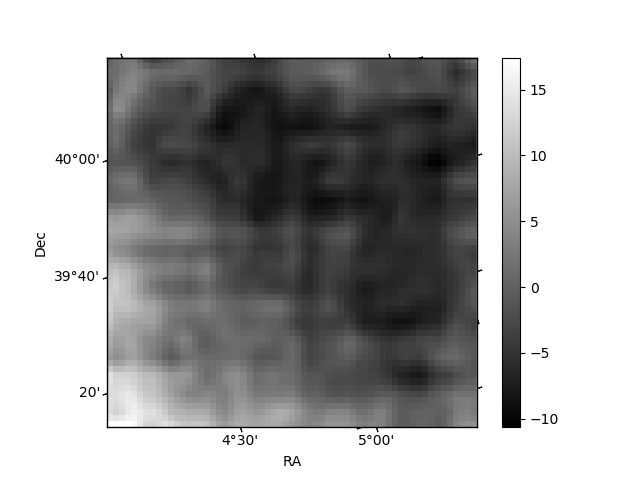
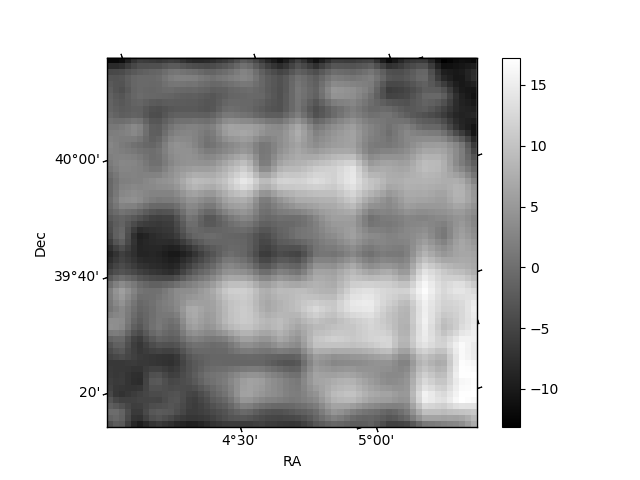
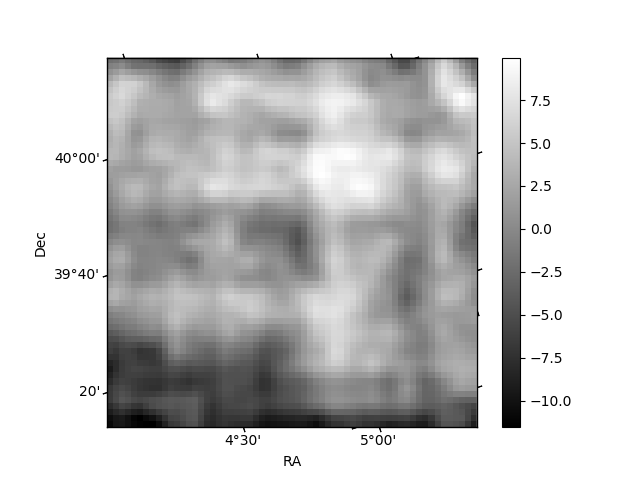
Histogram calculated using DETX and DETY for each event in the final _common_clean file
| Quadrant A | 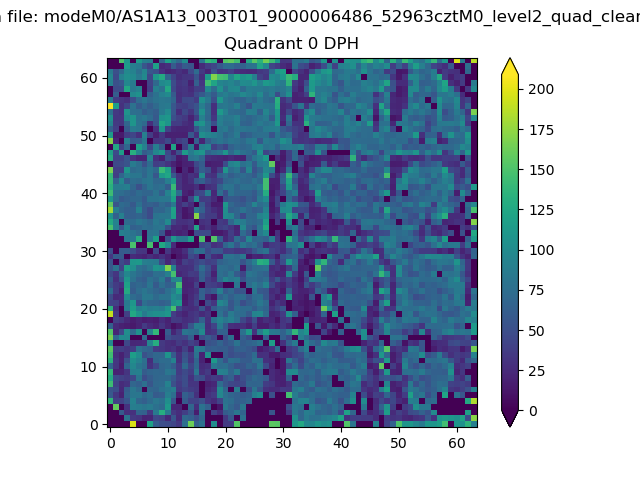 |
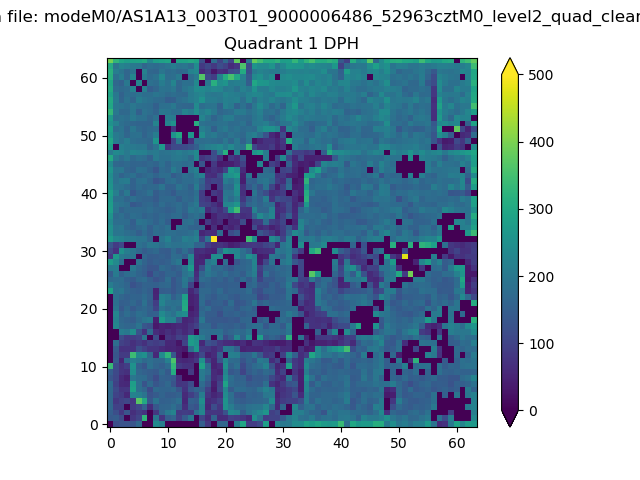 |
Quadrant B |
|---|---|---|---|
| Quadrant D | 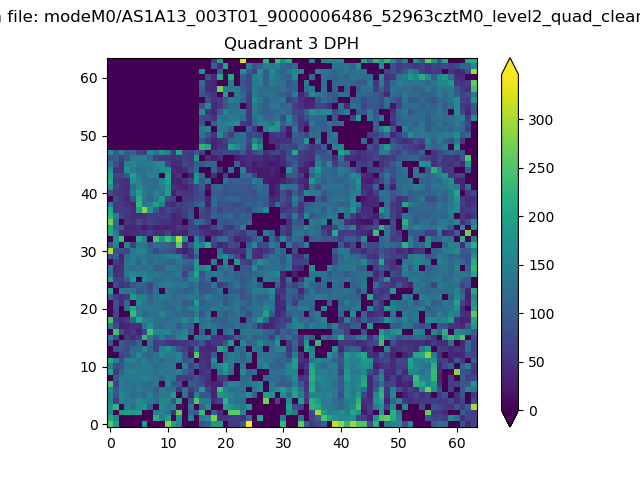 |
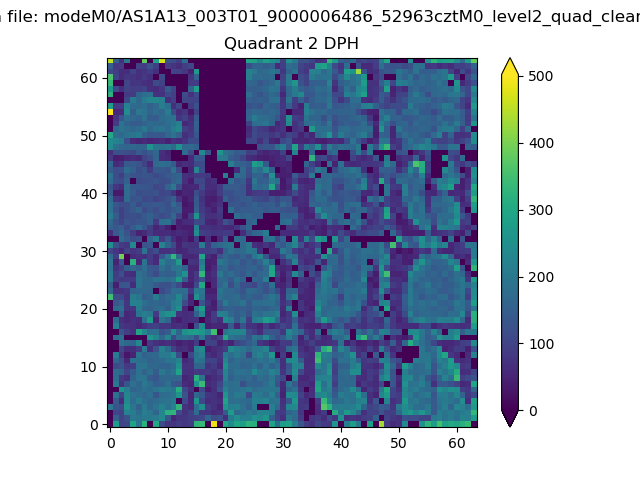 |
Quadrant C |
| Plot type | Count rate plots | Images |
|---|---|---|
| Comparison with Poisson distribution Blue bars denote a histogram of data divided into 1 sec bins. Red curve is a Poisson curve with rate = median count rate of data. |
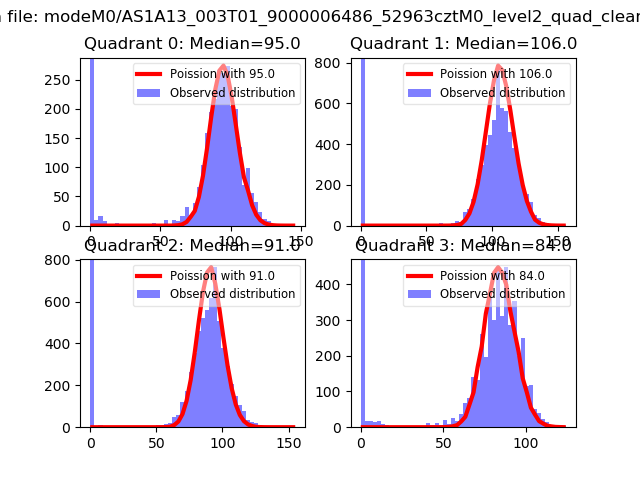 |
 |
| Quadrant-wise count rates Data is divided into 100 sec bins |
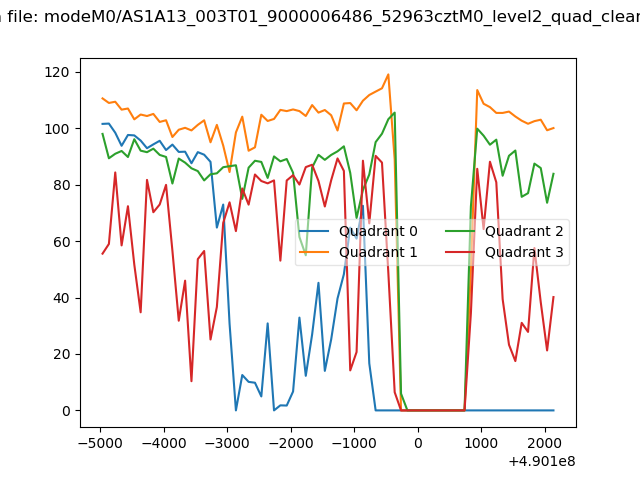 |
|
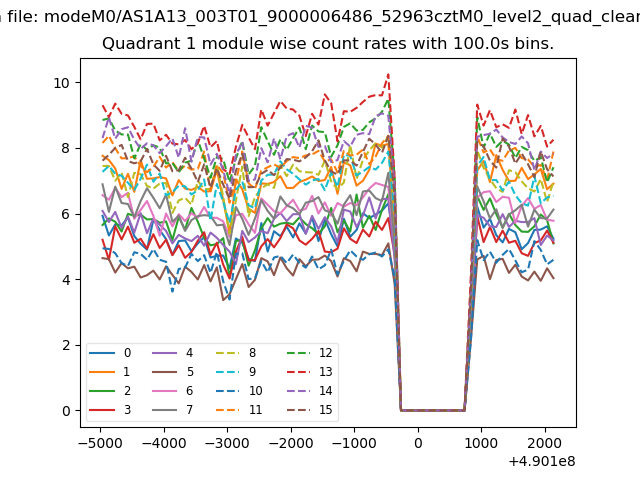
| Module-wise count rates for Quadrant A Data is divided into 100 sec bins |
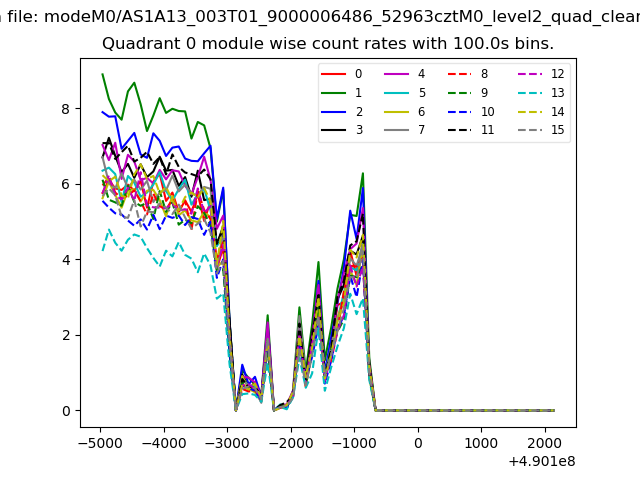 |
 |
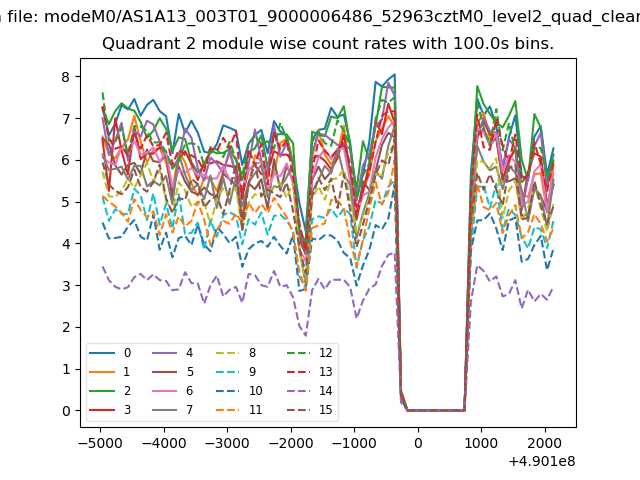
| Module-wise count rates for Quadrant B Data is divided into 100 sec bins |
 |
 |
| Module-wise count rates for Quadrant C Data is divided into 100 sec bins |
 |
 |
| Module-wise count rates for Quadrant D Data is divided into 100 sec bins |
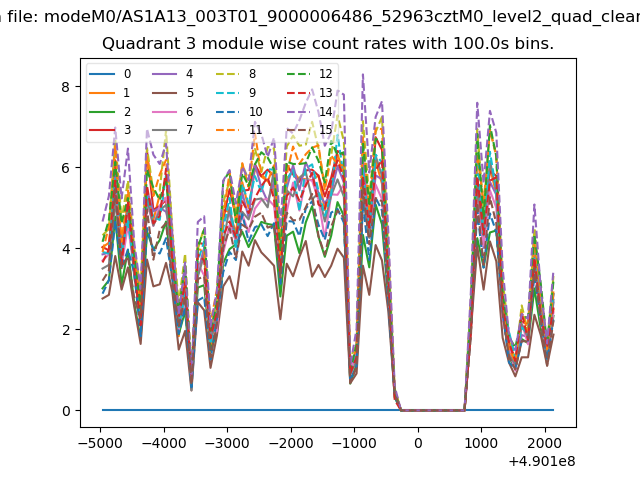 |
 |
| Parameter | Plot |
|---|---|
| CZT HV Monitor | 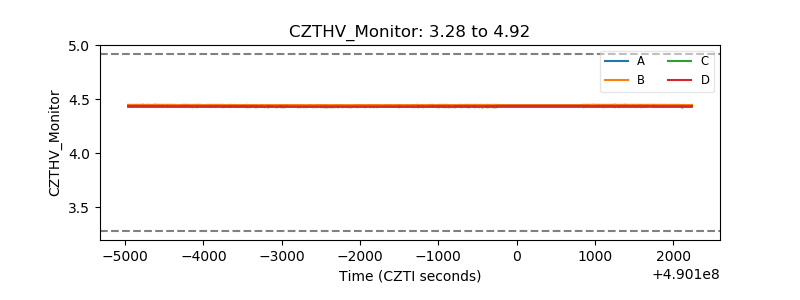 |
| D_VDD | 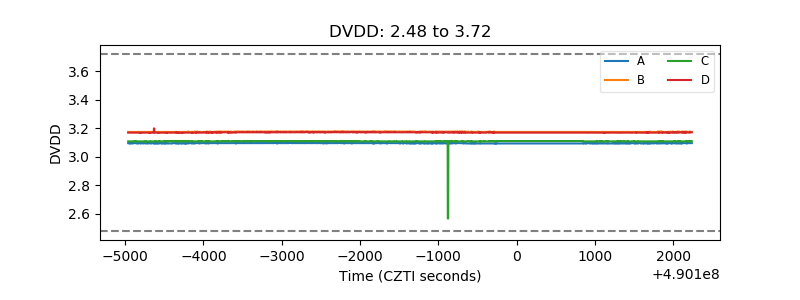 |
| Temperature 1 | 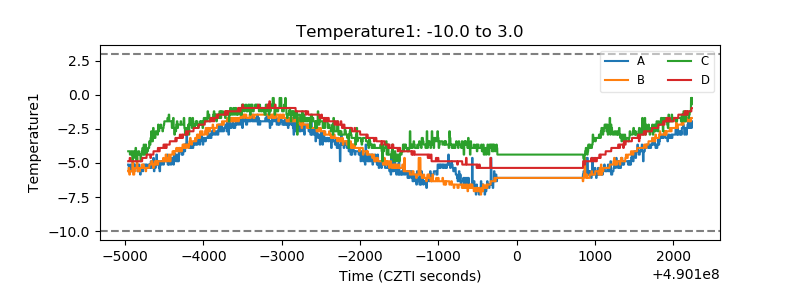 |
| Veto HV Monitor | 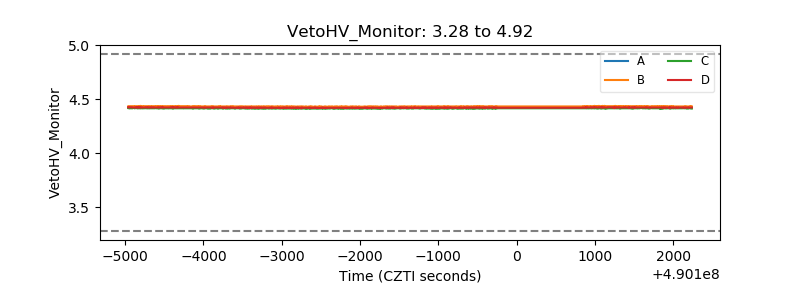 |
| Veto LLD | 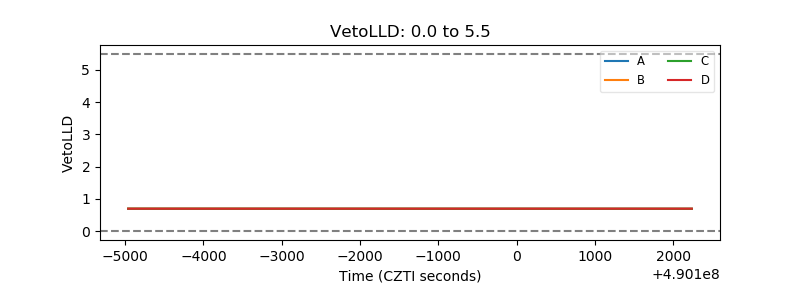 |
| Alpha Counter | 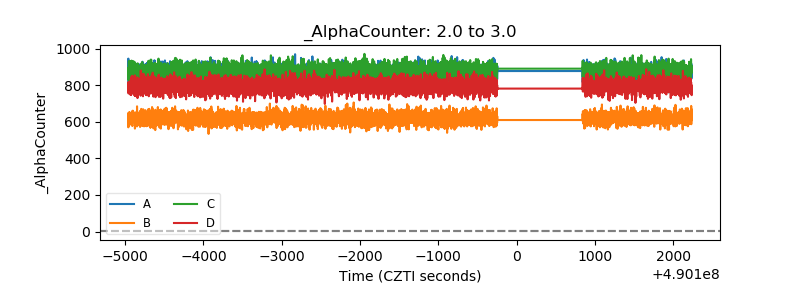 |
| _CPM_Rate | 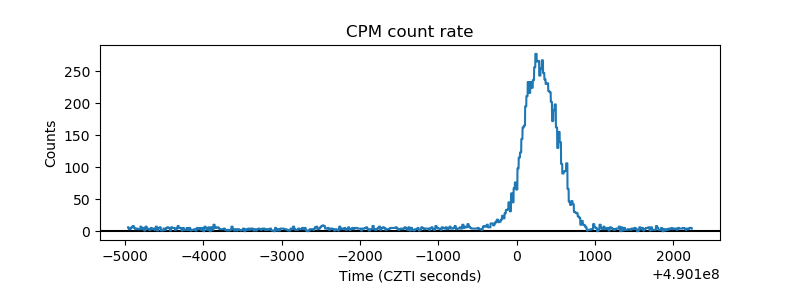 |
| CZT Counter | 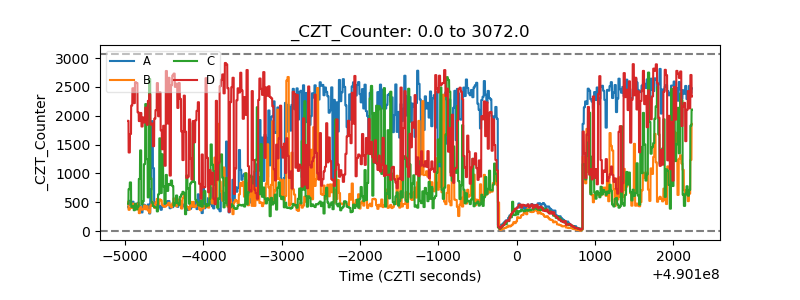 |
| +2.5 Volts monitor |  |
| +5 Volts monitor |  |
| _ROLL_ROT | 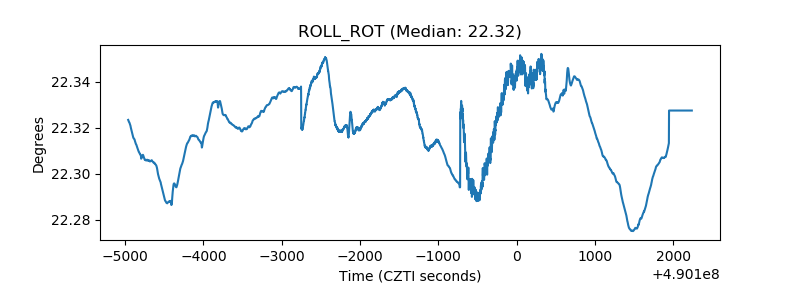 |
| _Roll_DEC | 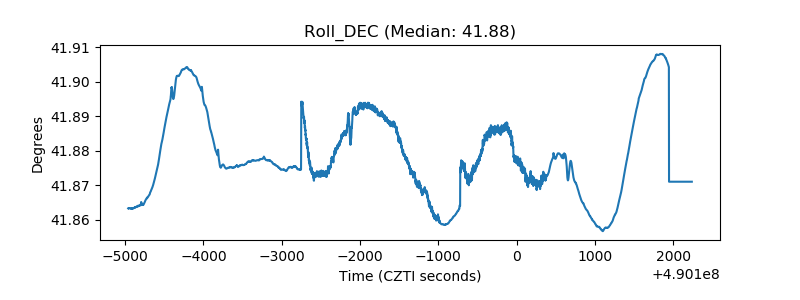 |
| _Roll_RA | 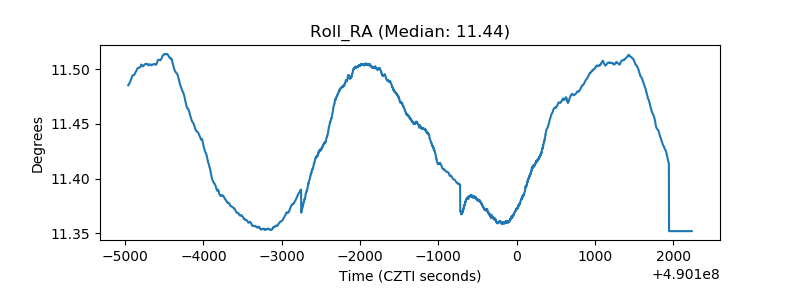 |
| Veto Counter | 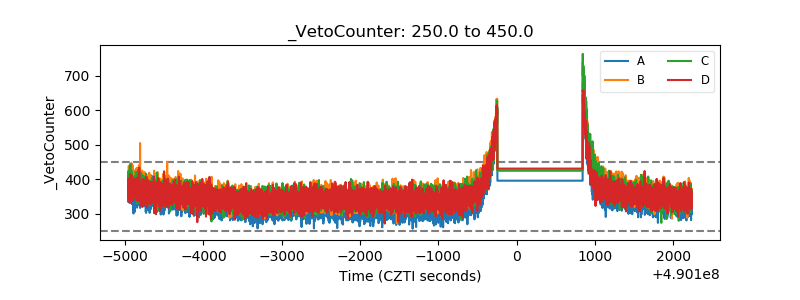 |