| Param | Original file | Final file |
|---|---|---|
| Filename | modeM0/AS1A13_003T01_9000006486_52964cztM0_level2.fits | modeM0/AS1A13_003T01_9000006486_52964cztM0_level2_quad_clean.evt |
| Size (bytes) | 2,248,747,200 | 181,967,040 |
| Size | 2.1 GB | 173.5 MB |
| Events in quadrant A | 29,890,798 | 590,094 |
| Events in quadrant B | 11,638,400 | 1,573,700 |
| Events in quadrant C | 15,321,483 | 1,272,720 |
| Events in quadrant D | 25,146,739 | 957,163 |
| Mode M9 | |||
|---|---|---|---|
| Quadrant | BADHDUFLAG | Total packets | Discarded packets |
| A | 0 | 31 | 0 |
| B | 0 | 31 | 0 |
| C | 0 | 31 | 0 |
| D | 0 | 31 | 0 |
| Mode M0 | |||
|---|---|---|---|
| Quadrant | BADHDUFLAG | Total packets | Discarded packets |
| A | 0 | 99690 | 4 |
| B | 0 | 45666 | 17 |
| C | 0 | 56834 | 4 |
| D | 0 | 86056 | 4 |
| Mode SS | |||
|---|---|---|---|
| Quadrant | BADHDUFLAG | Total packets | Discarded packets |
| A | 0 | 330 | 0 |
| B | 0 | 330 | 0 |
| C | 0 | 330 | 0 |
| D | 0 | 330 | 0 |
| Quadrant | Total seconds | Saturated seconds | Saturation percentage |
|---|---|---|---|
| A | 16162 | 10451 | 64.664027% |
| B | 16161 | 1364 | 8.440072% |
| C | 16162 | 2144 | 13.265685% |
| D | 16162 | 5238 | 32.409355% |
Noise dominated data is calculated using 1-second bins in cleaned event files. If a bin has >2000 counts, and if more than 50% of those come from <1% of pixels, then it is considered to be noise-dominated and hence unusable.
| Quadrant | # 1 sec bins | Bins with >0 counts | Bins with >2000 counts | High rate bins dominated by noise | Noise dominated (total time) | Noise dominated (detector-on time) | Marked lightcurve |
|---|---|---|---|---|---|---|---|
| A | 19286 | 16161 | 9877 | 9877 | 51.21% | 61.12% | 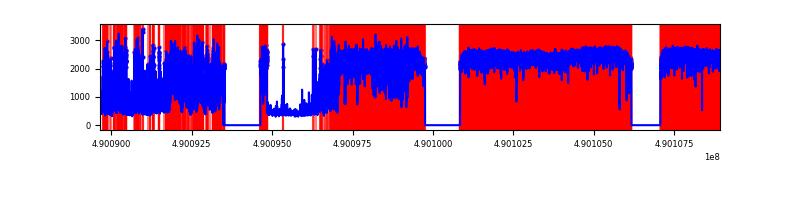 |
| B | 19287 | 16161 | 923 | 923 | 4.79% | 5.71% | 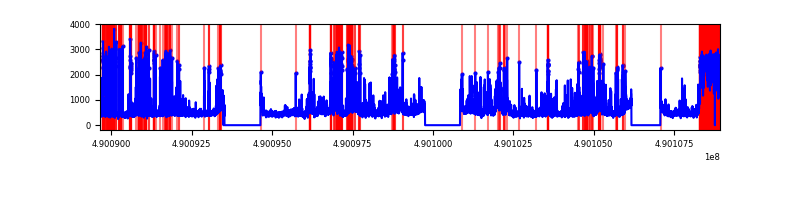 |
| C | 19287 | 16164 | 1830 | 1830 | 9.49% | 11.32% | 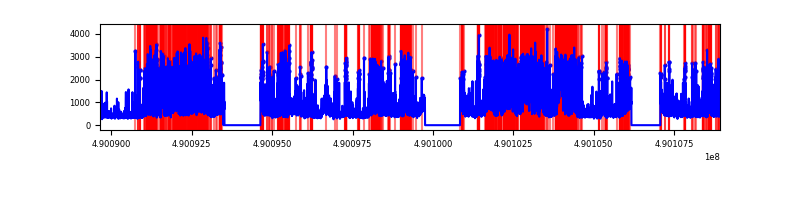 |
| D | 19287 | 16162 | 4861 | 4861 | 25.20% | 30.08% | 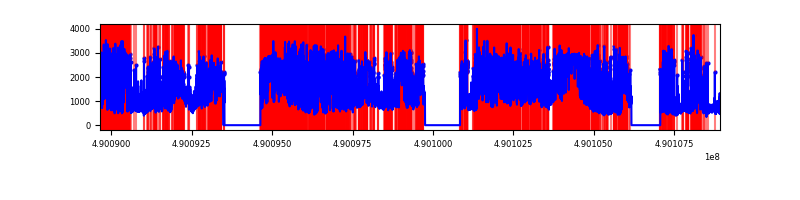 |
Top three noisy pixels from each quadrant. If the there are fewer than three noisy pixels in the level2.evt file, extra rows are filled as -1
| Pixel properties | Quadrant properties | ||||||
|---|---|---|---|---|---|---|---|
| Quadrant | DetID | PixID | Counts | Sigma | Mean | Median | Sigma |
| A | 9 | 191 | 25083325 | 99751.41 | 1015 | 991 | 251.4 |
| A | 0 | 8 | 277478 | 1099.58 | 1015 | 991 | 251.4 |
| A | 13 | 248 | 122053 | 481.46 | 1015 | 991 | 251.4 |
| B | 12 | 17 | 1248052 | 3469.88 | 1705 | 1646 | 359.2 |
| B | 10 | 254 | 1019939 | 2834.83 | 1705 | 1646 | 359.2 |
| B | 10 | 63 | 907657 | 2522.25 | 1705 | 1646 | 359.2 |
| C | 12 | 254 | 2436894 | 5565.01 | 1624 | 1614 | 437.6 |
| C | 4 | 5 | 2147220 | 4903.06 | 1624 | 1614 | 437.6 |
| C | 2 | 12 | 807155 | 1840.79 | 1624 | 1614 | 437.6 |
| D | 8 | 176 | 7329210 | 17913.74 | 1459 | 1398 | 409.1 |
| D | 15 | 78 | 4765268 | 11645.87 | 1459 | 1398 | 409.1 |
| D | 2 | 62 | 2150905 | 5254.73 | 1459 | 1398 | 409.1 |
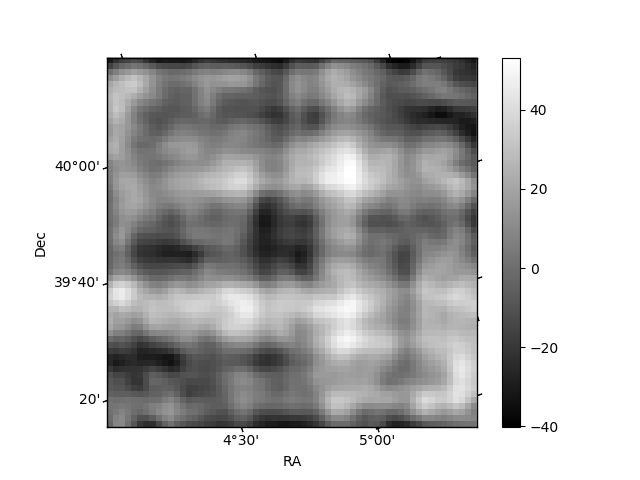
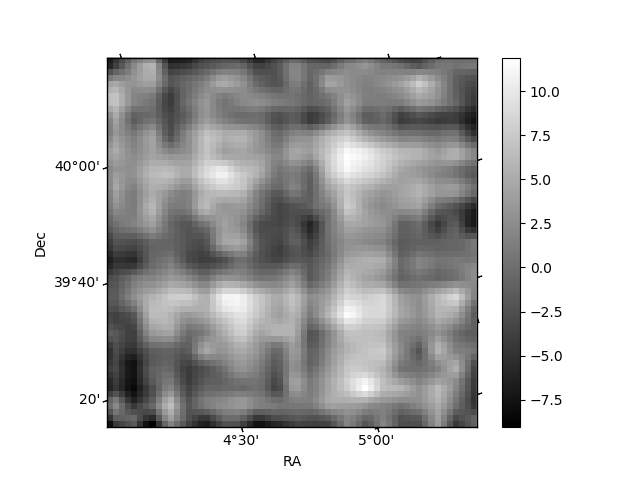
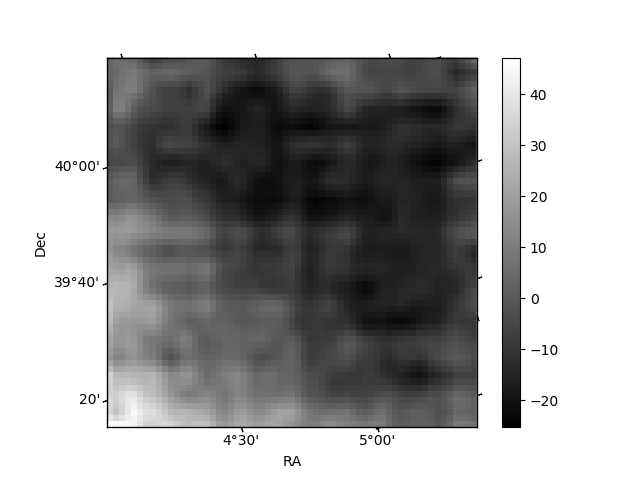
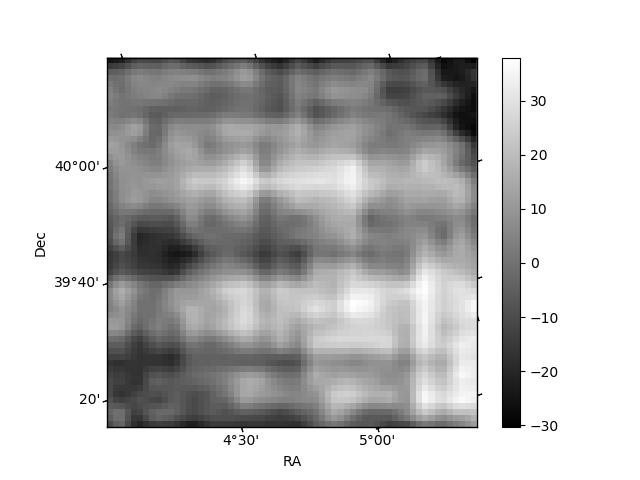
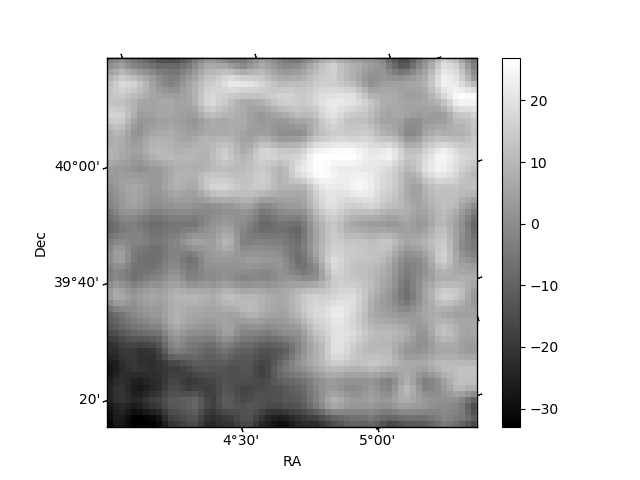
Histogram calculated using DETX and DETY for each event in the final _common_clean file
| Quadrant A | 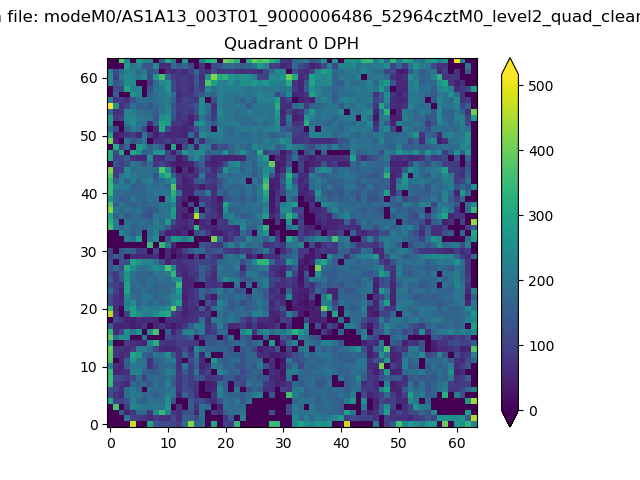 |
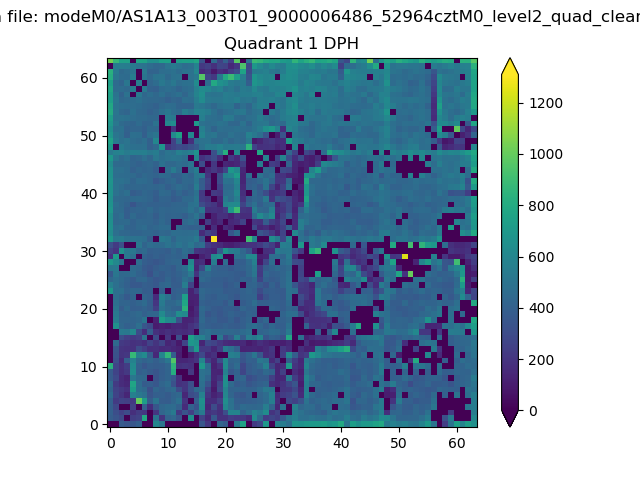 |
Quadrant B |
|---|---|---|---|
| Quadrant D | 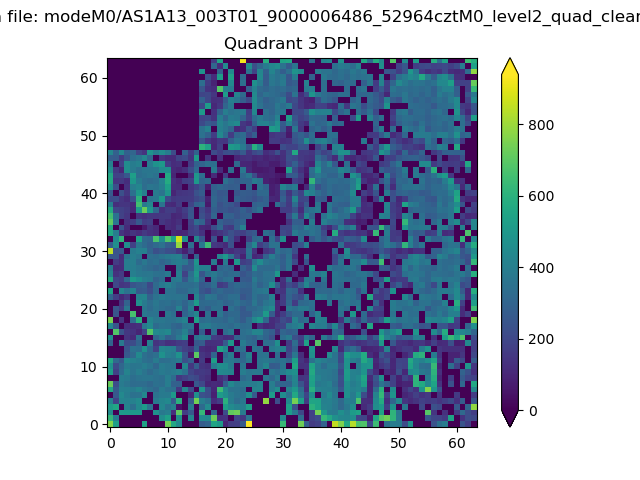 |
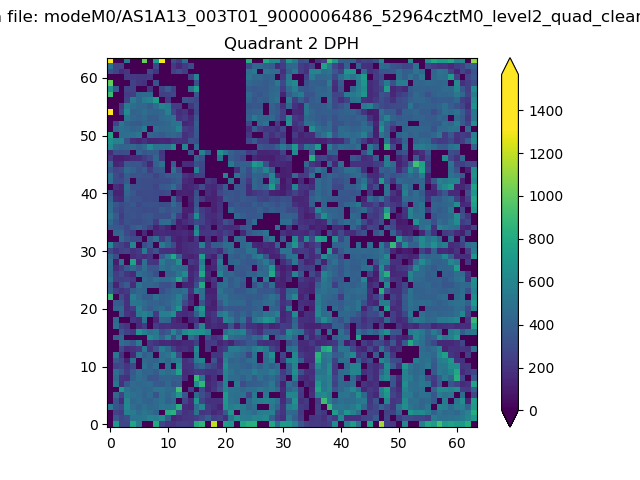 |
Quadrant C |
| Plot type | Count rate plots | Images |
|---|---|---|
| Comparison with Poisson distribution Blue bars denote a histogram of data divided into 1 sec bins. Red curve is a Poisson curve with rate = median count rate of data. |
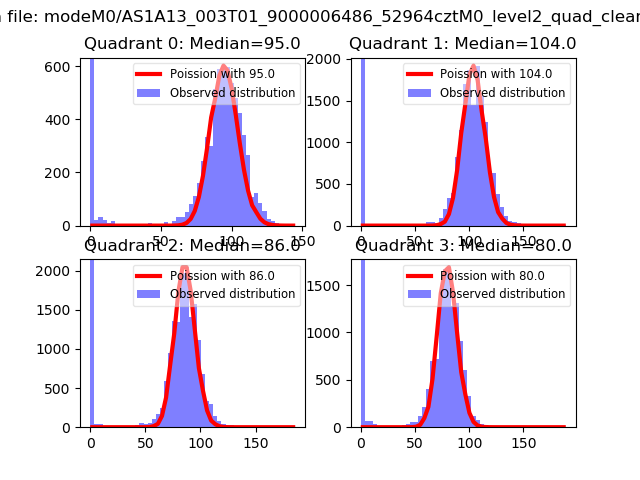 |
 |
| Quadrant-wise count rates Data is divided into 100 sec bins |
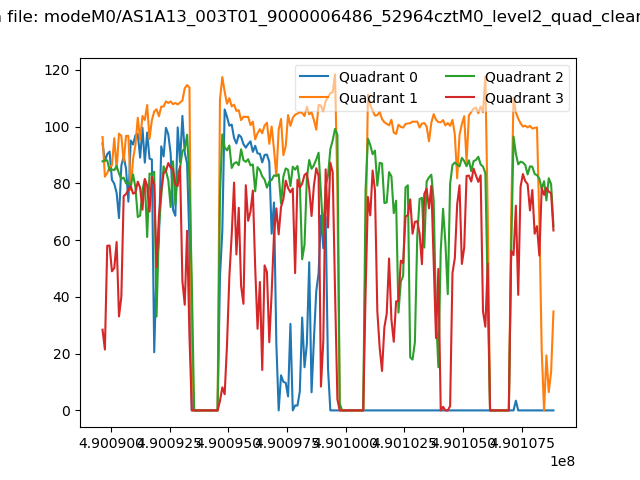 |
|
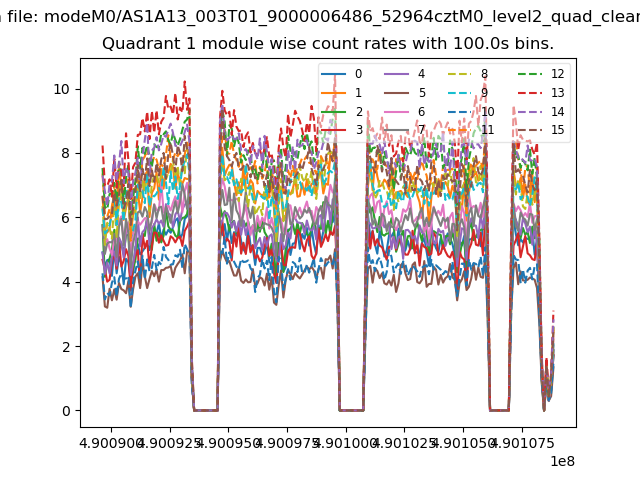
| Module-wise count rates for Quadrant A Data is divided into 100 sec bins |
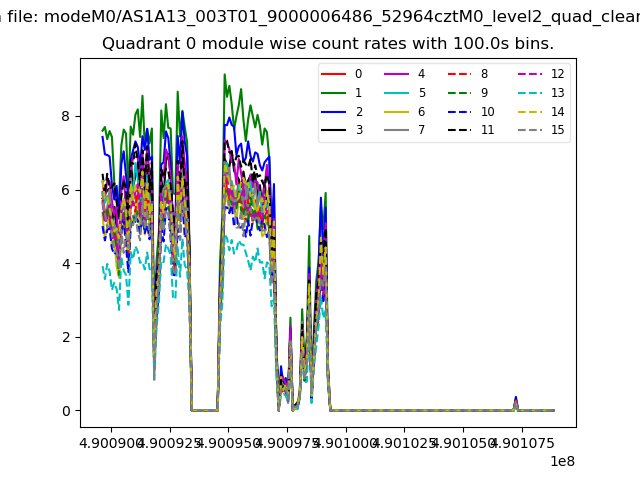 |
 |
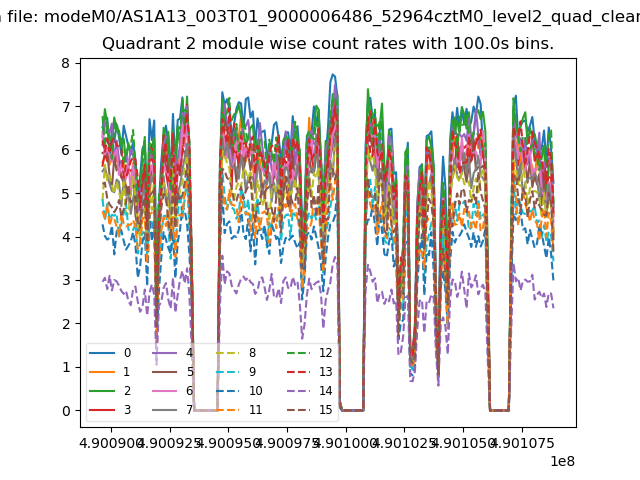
| Module-wise count rates for Quadrant B Data is divided into 100 sec bins |
 |
 |
| Module-wise count rates for Quadrant C Data is divided into 100 sec bins |
 |
 |
| Module-wise count rates for Quadrant D Data is divided into 100 sec bins |
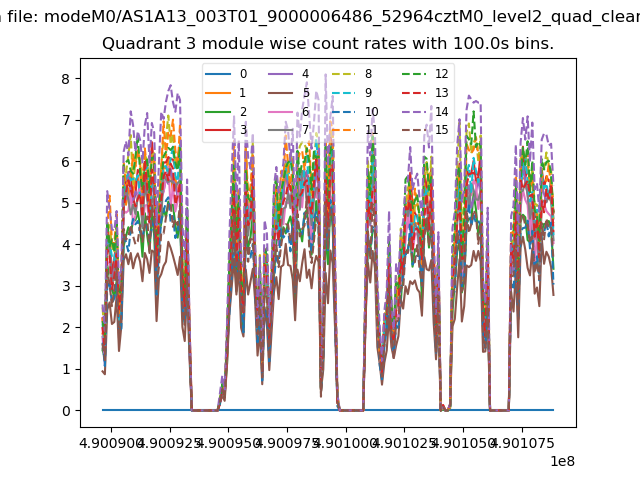 |
 |
| Parameter | Plot |
|---|---|
| CZT HV Monitor | 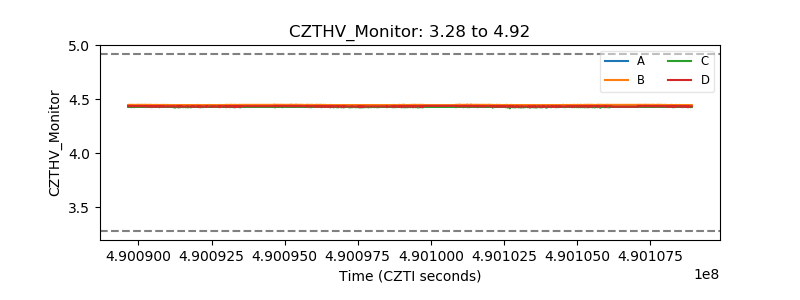 |
| D_VDD | 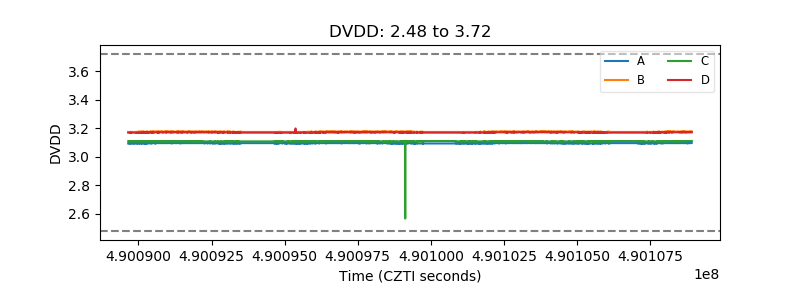 |
| Temperature 1 | 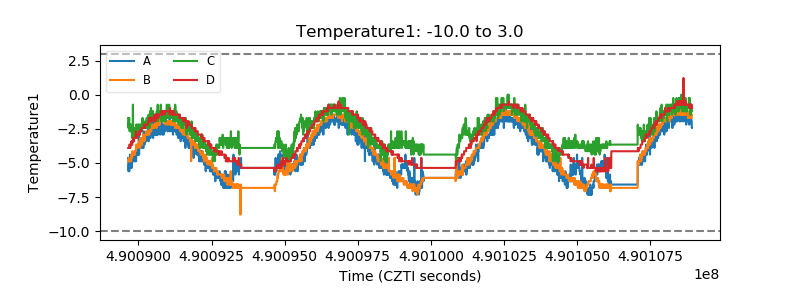 |
| Veto HV Monitor | 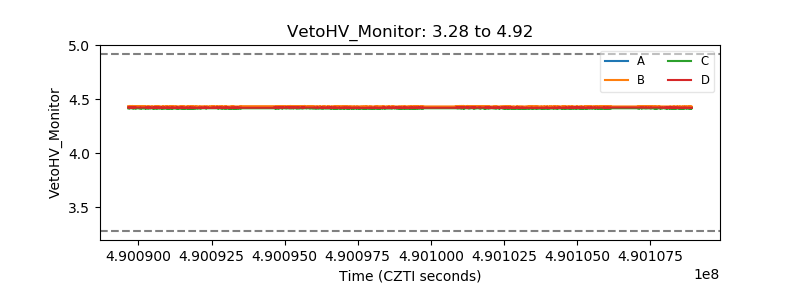 |
| Veto LLD | 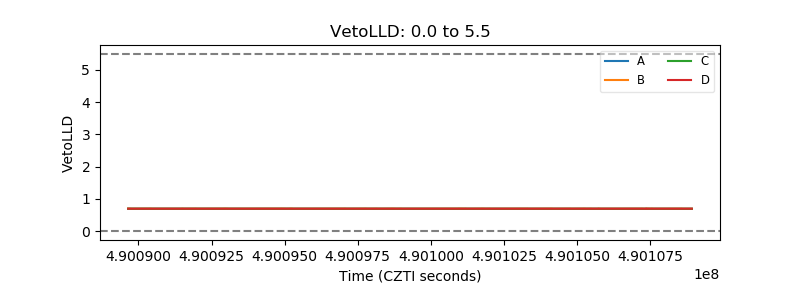 |
| Alpha Counter | 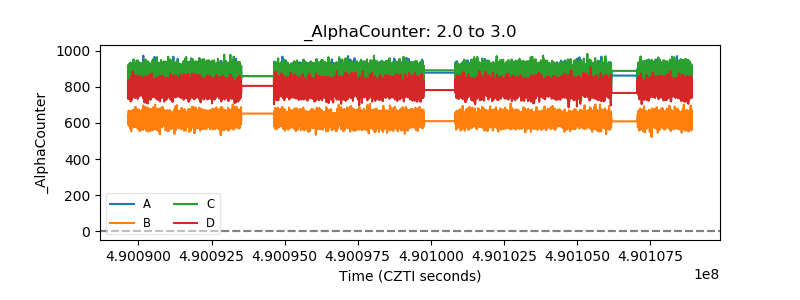 |
| _CPM_Rate | 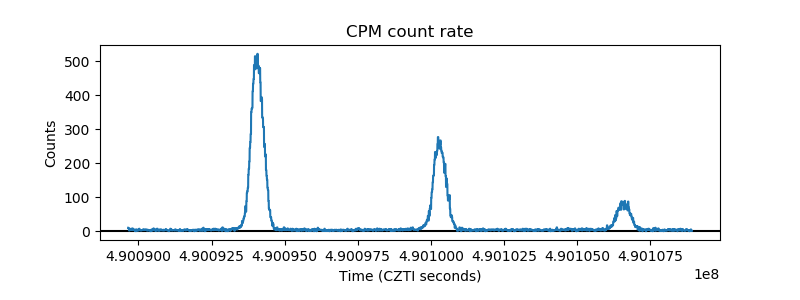 |
| CZT Counter | 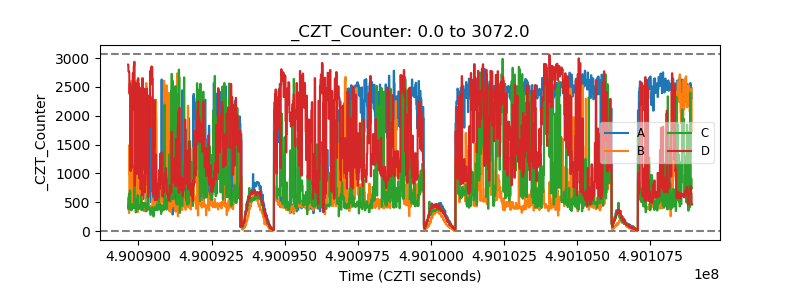 |
| +2.5 Volts monitor | 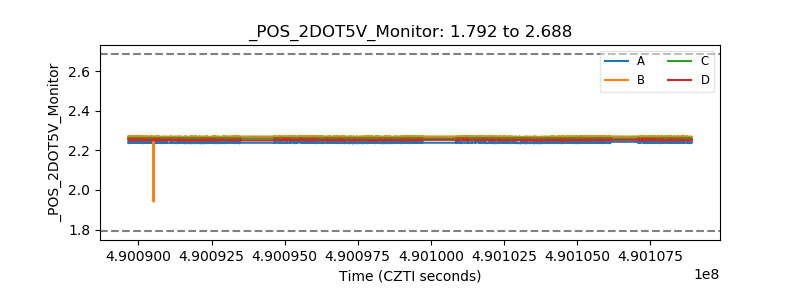 |
| +5 Volts monitor |  |
| _ROLL_ROT | 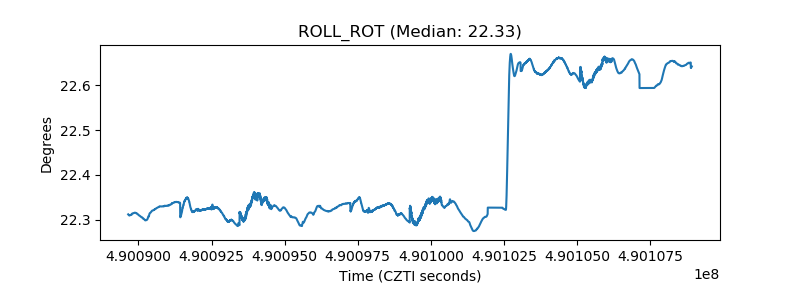 |
| _Roll_DEC | 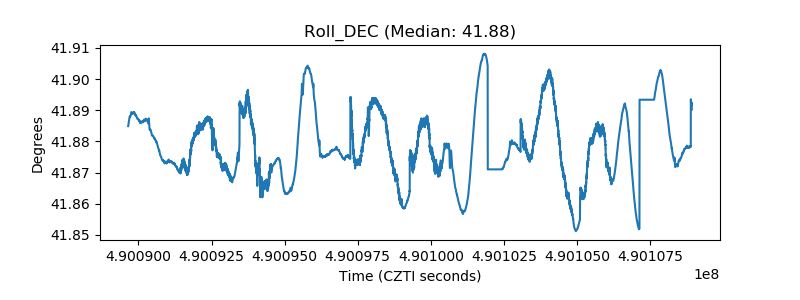 |
| _Roll_RA | 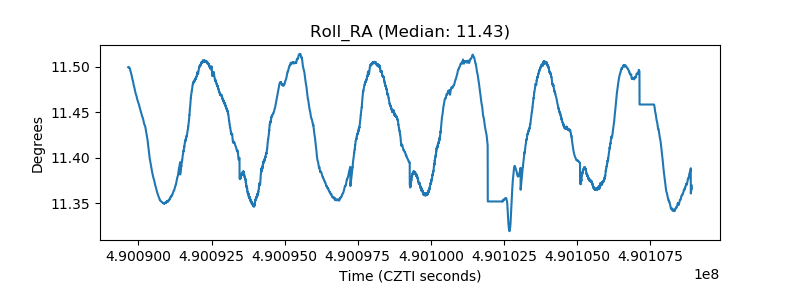 |
| Veto Counter | 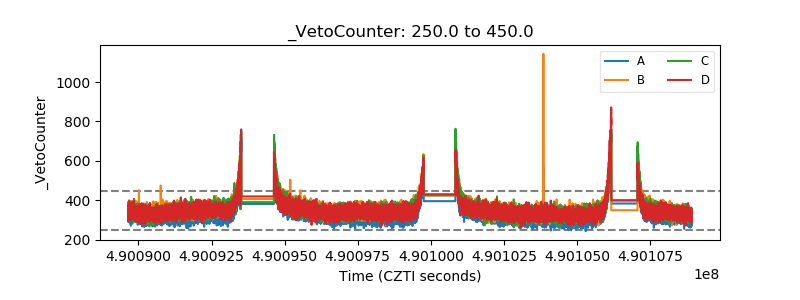 |