| Param | Original file | Final file |
|---|---|---|
| Filename | modeM0/AS1A13_003T01_9000006486_52965cztM0_level2.fits | modeM0/AS1A13_003T01_9000006486_52965cztM0_level2_quad_clean.evt |
| Size (bytes) | 983,142,720 | 72,339,840 |
| Size | 937.6 MB | 69.0 MB |
| Events in quadrant A | 16,680,101 | 121 |
| Events in quadrant B | 8,208,594 | 566,371 |
| Events in quadrant C | 4,843,630 | 590,555 |
| Events in quadrant D | 6,132,043 | 557,106 |
| Mode M9 | |||
|---|---|---|---|
| Quadrant | BADHDUFLAG | Total packets | Discarded packets |
| A | 0 | 4 | 0 |
| B | 0 | 4 | 0 |
| C | 0 | 4 | 0 |
| D | 0 | 4 | 0 |
| Mode M0 | |||
|---|---|---|---|
| Quadrant | BADHDUFLAG | Total packets | Discarded packets |
| A | 0 | 54037 | 2 |
| B | 0 | 29076 | 2 |
| C | 0 | 19173 | 2 |
| D | 0 | 23230 | 3 |
| Mode SS | |||
|---|---|---|---|
| Quadrant | BADHDUFLAG | Total packets | Discarded packets |
| A | 0 | 140 | 0 |
| B | 0 | 140 | 0 |
| C | 0 | 140 | 0 |
| D | 0 | 140 | 0 |
| Quadrant | Total seconds | Saturated seconds | Saturation percentage |
|---|---|---|---|
| A | 6826 | 6825 | 99.985350% |
| B | 6826 | 1689 | 24.743627% |
| C | 6826 | 451 | 6.607091% |
| D | 6825 | 560 | 8.205128% |
Noise dominated data is calculated using 1-second bins in cleaned event files. If a bin has >2000 counts, and if more than 50% of those come from <1% of pixels, then it is considered to be noise-dominated and hence unusable.
| Quadrant | # 1 sec bins | Bins with >0 counts | Bins with >2000 counts | High rate bins dominated by noise | Noise dominated (total time) | Noise dominated (detector-on time) | Marked lightcurve |
|---|---|---|---|---|---|---|---|
| A | 7320 | 6825 | 6653 | 6653 | 90.89% | 97.48% | 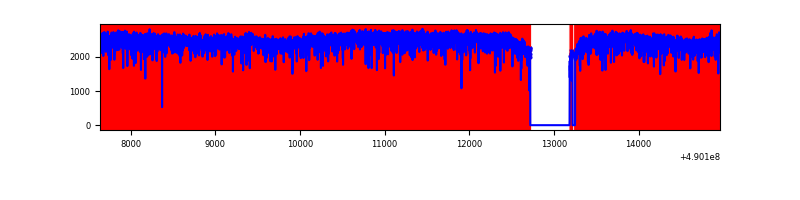 |
| B | 7321 | 6826 | 1259 | 1259 | 17.20% | 18.44% | 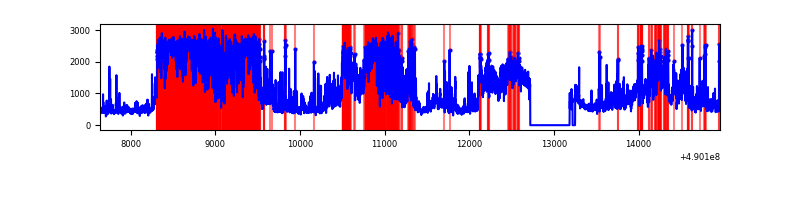 |
| C | 7321 | 6826 | 295 | 295 | 4.03% | 4.32% | 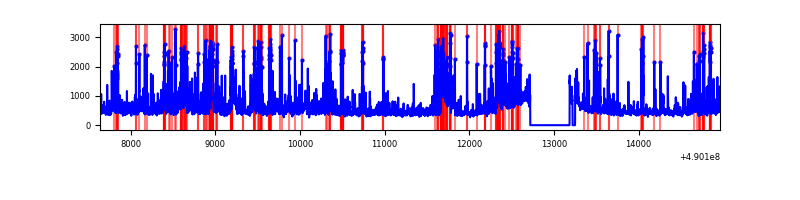 |
| D | 7320 | 6826 | 428 | 428 | 5.85% | 6.27% | 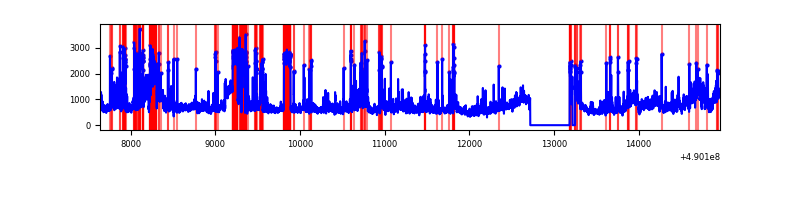 |
Top three noisy pixels from each quadrant. If the there are fewer than three noisy pixels in the level2.evt file, extra rows are filled as -1
| Pixel properties | Quadrant properties | ||||||
|---|---|---|---|---|---|---|---|
| Quadrant | DetID | PixID | Counts | Sigma | Mean | Median | Sigma |
| A | 9 | 191 | 15877595 | 417407.8 | 143 | 139 | 38.0 |
| A | 8 | 249 | 98149 | 2576.62 | 143 | 139 | 38.0 |
| A | 0 | 8 | 35369 | 926.17 | 143 | 139 | 38.0 |
| B | 12 | 17 | 2516534 | 17174.19 | 687 | 662 | 146.5 |
| B | 10 | 254 | 2044509 | 13951.99 | 687 | 662 | 146.5 |
| B | 5 | 185 | 348850 | 2376.85 | 687 | 662 | 146.5 |
| C | 15 | 147 | 398316 | 2023.16 | 715 | 707 | 196.5 |
| C | 12 | 254 | 376626 | 1912.79 | 715 | 707 | 196.5 |
| C | 13 | 3 | 309886 | 1573.2 | 715 | 707 | 196.5 |
| D | 2 | 62 | 879424 | 4319.54 | 714 | 681 | 203.4 |
| D | 7 | 222 | 522632 | 2565.7 | 714 | 681 | 203.4 |
| D | 15 | 78 | 482170 | 2366.8 | 714 | 681 | 203.4 |
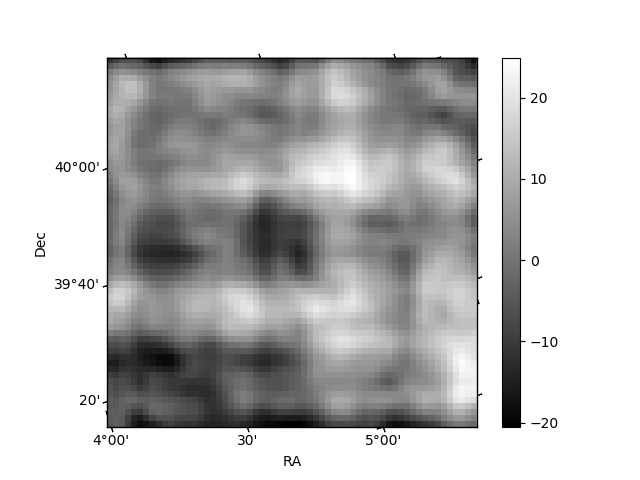
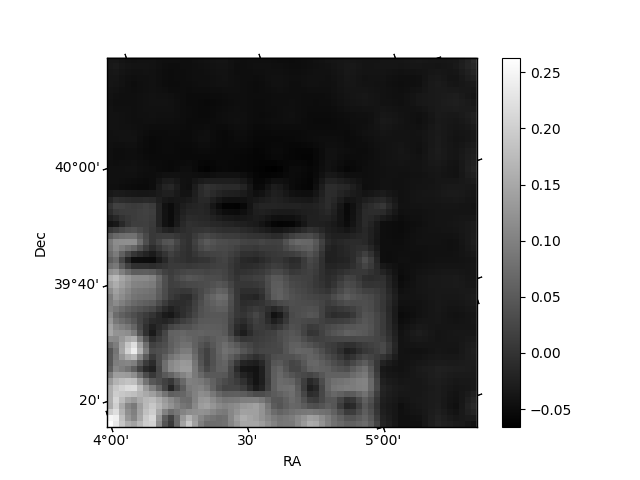
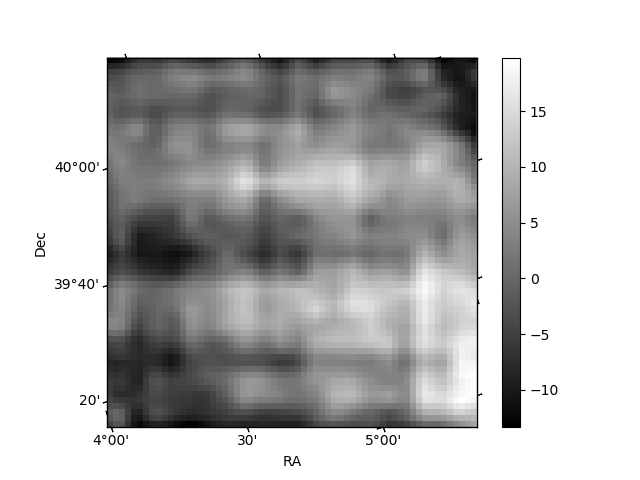
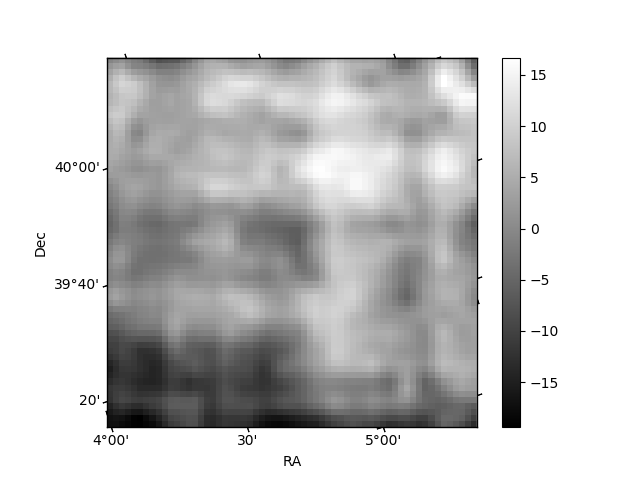
Histogram calculated using DETX and DETY for each event in the final _common_clean file
| Quadrant A | 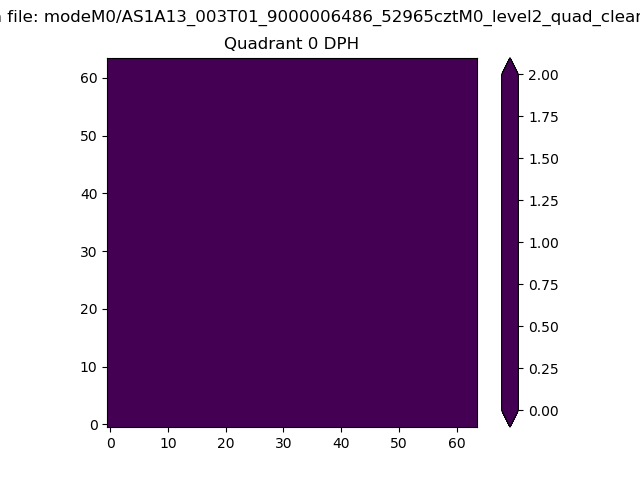 |
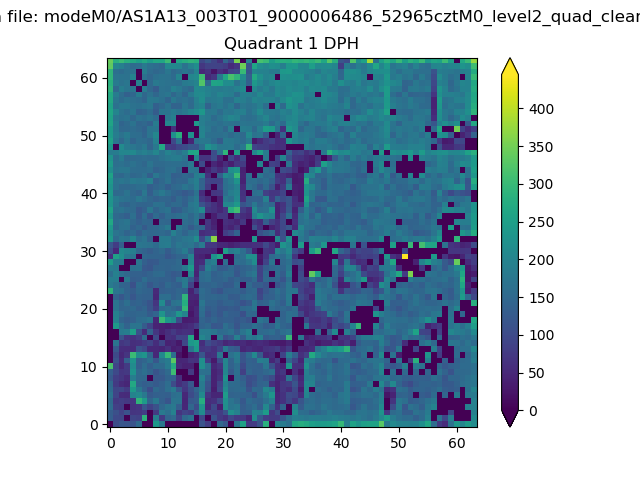 |
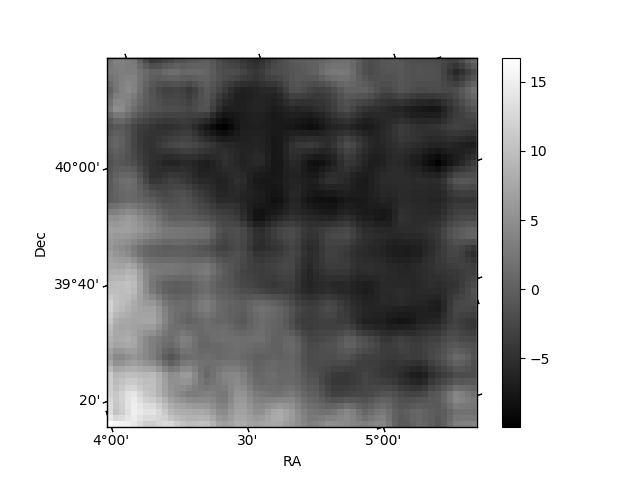
Quadrant B |
|---|---|---|---|
| Quadrant D | 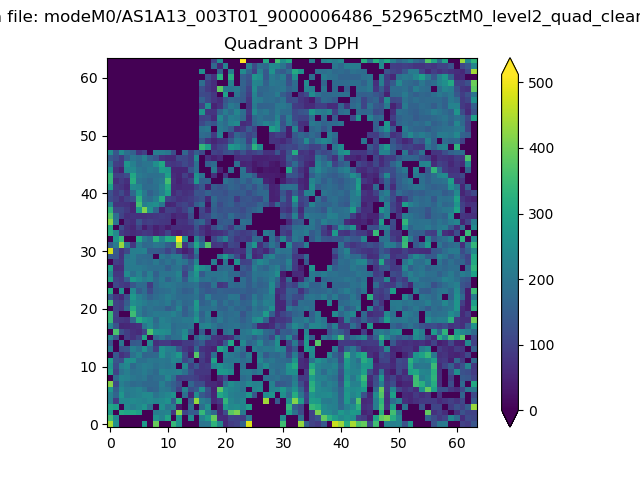 |
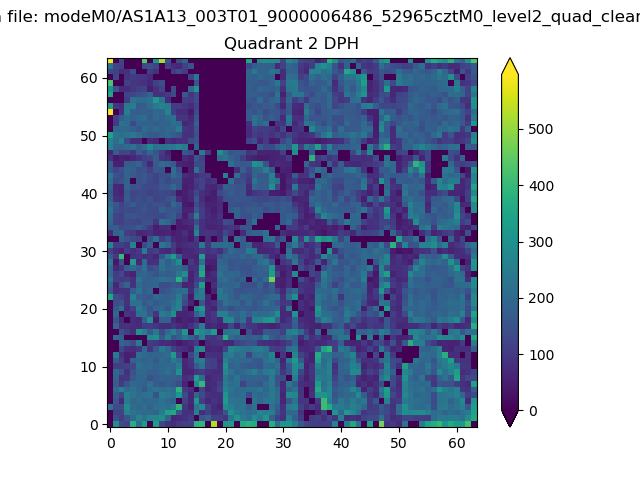 |
Quadrant C |
| Plot type | Count rate plots | Images |
|---|---|---|
| Comparison with Poisson distribution Blue bars denote a histogram of data divided into 1 sec bins. Red curve is a Poisson curve with rate = median count rate of data. |
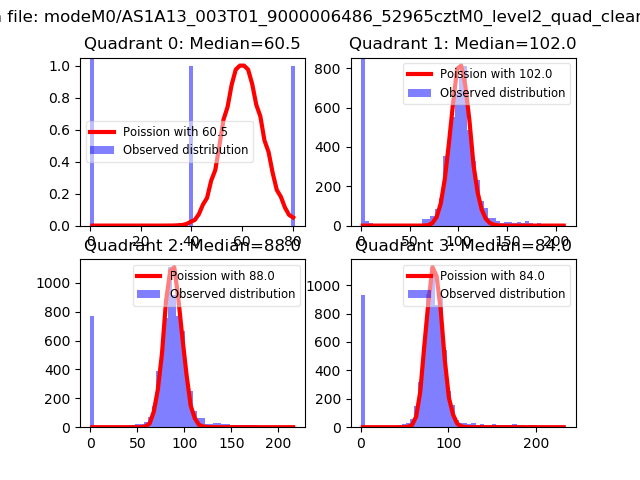 |
 |
| Quadrant-wise count rates Data is divided into 100 sec bins |
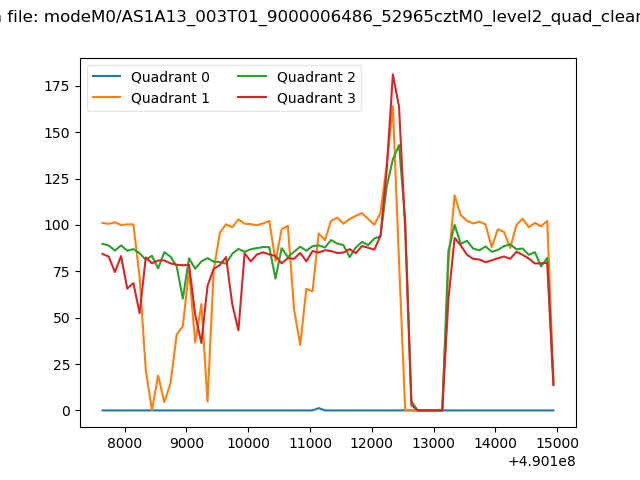 |
|
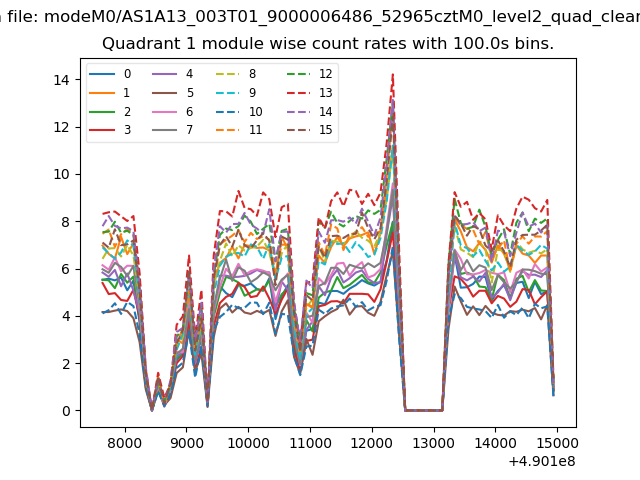
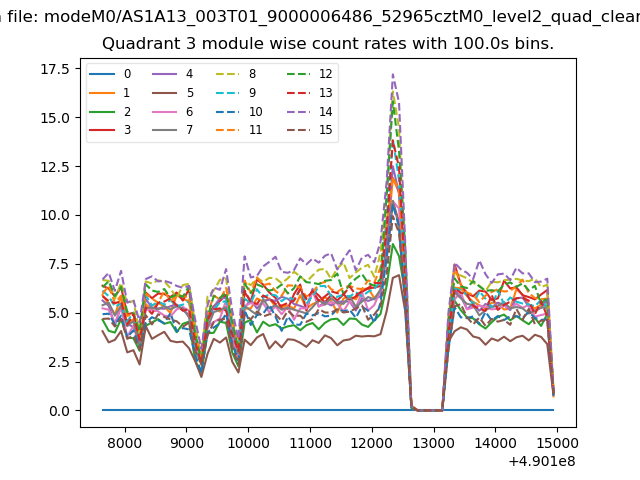
| Module-wise count rates for Quadrant A Data is divided into 100 sec bins |
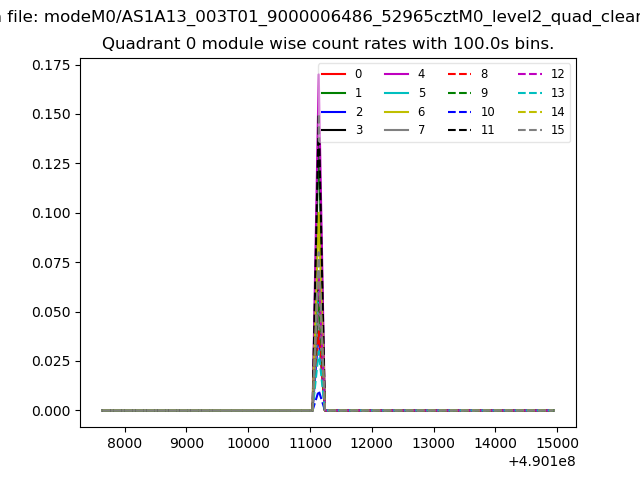 |
 |
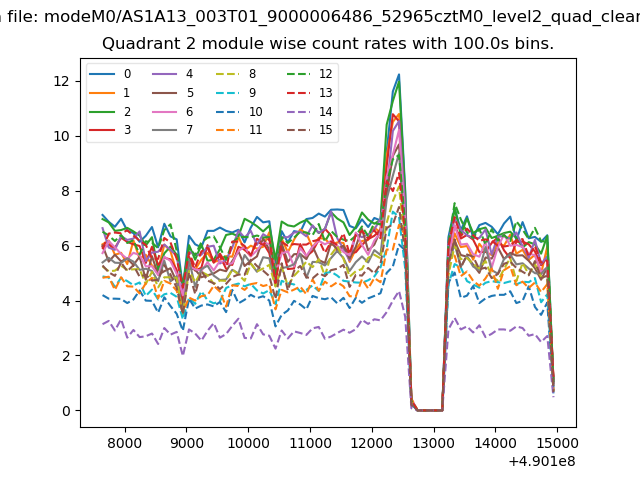
| Module-wise count rates for Quadrant B Data is divided into 100 sec bins |
 |
 |
| Module-wise count rates for Quadrant C Data is divided into 100 sec bins |
 |
 |
| Module-wise count rates for Quadrant D Data is divided into 100 sec bins |
 |
 |
| Parameter | Plot |
|---|---|
| CZT HV Monitor | 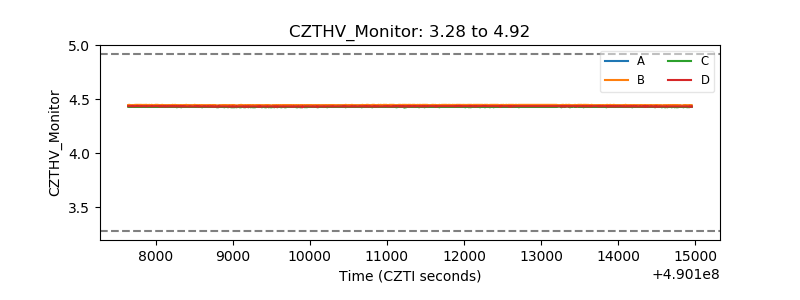 |
| D_VDD | 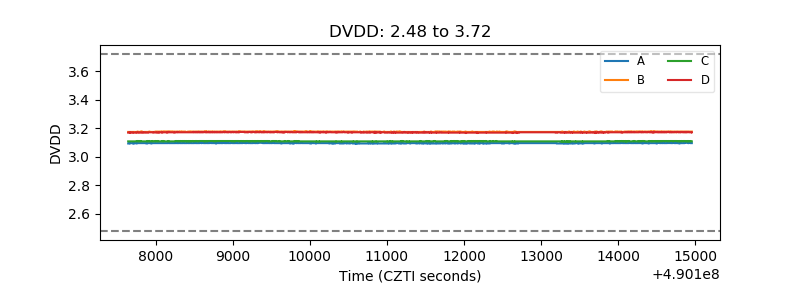 |
| Temperature 1 | 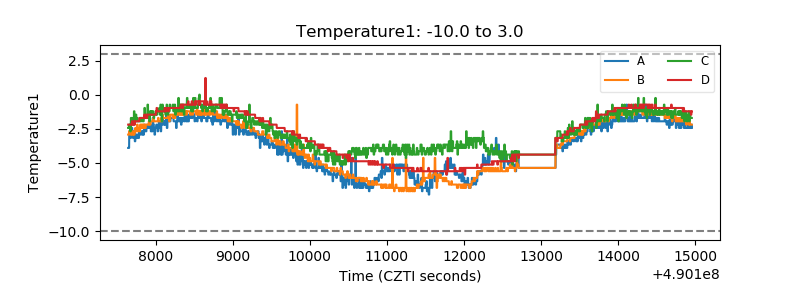 |
| Veto HV Monitor |  |
| Veto LLD | 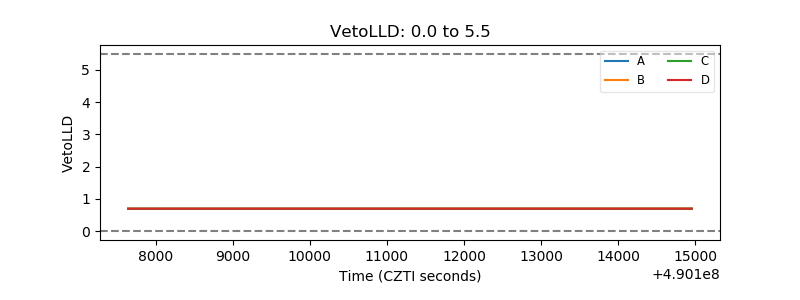 |
| Alpha Counter | 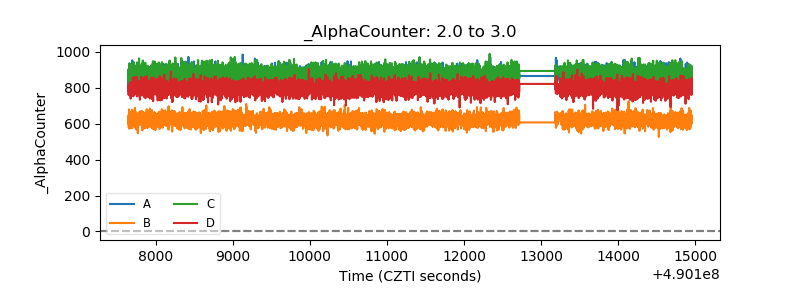 |
| _CPM_Rate | 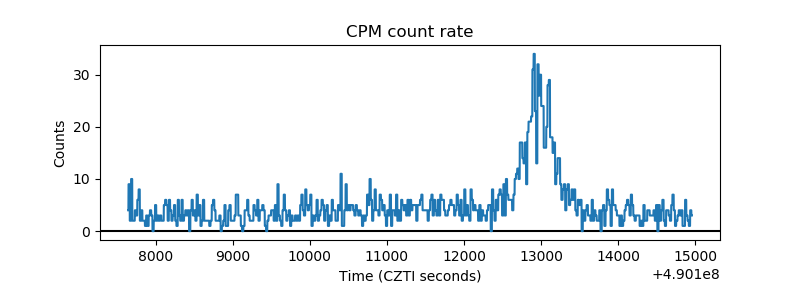 |
| CZT Counter | 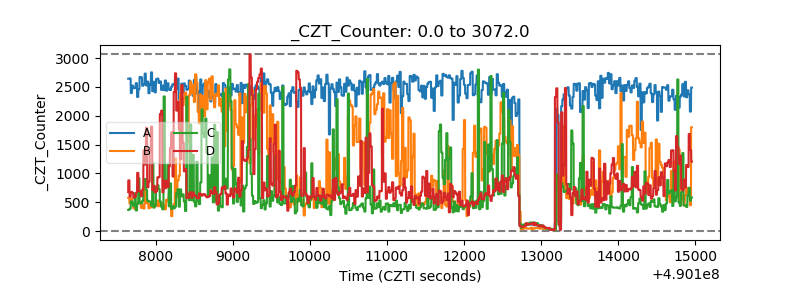 |
| +2.5 Volts monitor |  |
| +5 Volts monitor |  |
| _ROLL_ROT | 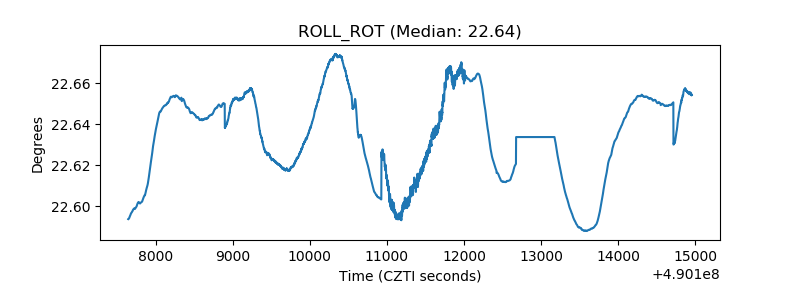 |
| _Roll_DEC | 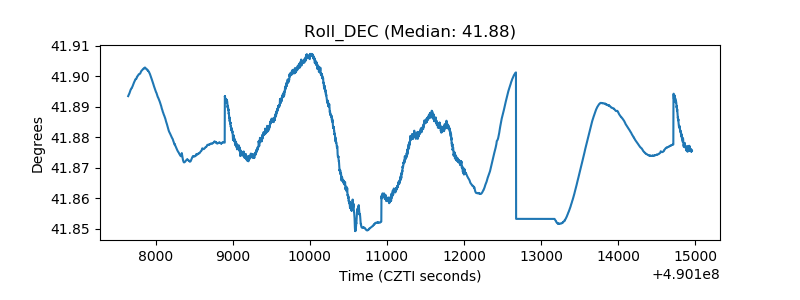 |
| _Roll_RA | 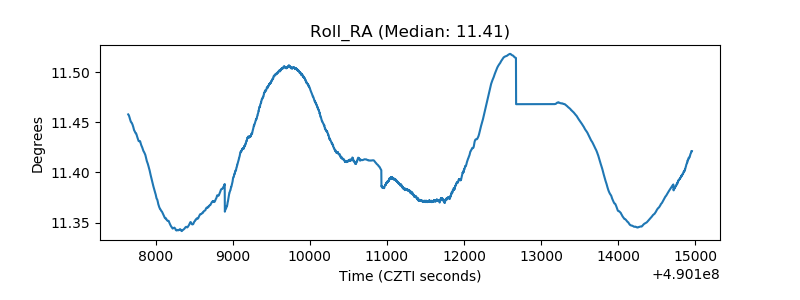 |
| Veto Counter | 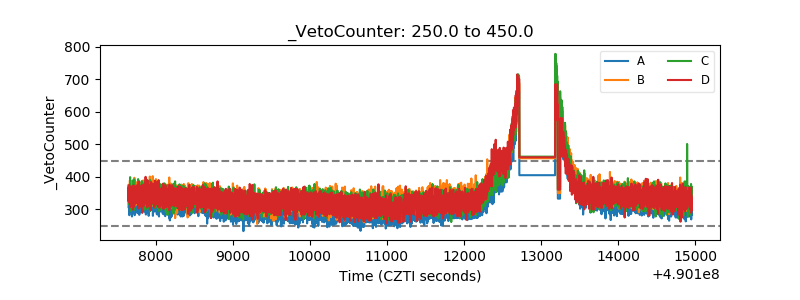 |