| Param | Original file | Final file |
|---|---|---|
| Filename | modeM0/AS1A13_003T01_9000006486_52966cztM0_level2.fits | modeM0/AS1A13_003T01_9000006486_52966cztM0_level2_quad_clean.evt |
| Size (bytes) | 1,148,719,680 | 91,100,160 |
| Size | 1.1 GB | 86.9 MB |
| Events in quadrant A | 19,042,382 | 102,816 |
| Events in quadrant B | 6,286,638 | 805,376 |
| Events in quadrant C | 7,213,927 | 663,177 |
| Events in quadrant D | 9,371,344 | 635,295 |
| Mode M0 | |||
|---|---|---|---|
| Quadrant | BADHDUFLAG | Total packets | Discarded packets |
| A | 0 | 61848 | 0 |
| B | 0 | 24136 | 0 |
| C | 0 | 26923 | 0 |
| D | 0 | 33437 | 0 |
| Mode SS | |||
|---|---|---|---|
| Quadrant | BADHDUFLAG | Total packets | Discarded packets |
| A | 0 | 158 | 0 |
| B | 0 | 158 | 0 |
| C | 0 | 158 | 0 |
| D | 0 | 158 | 0 |
| Quadrant | Total seconds | Saturated seconds | Saturation percentage |
|---|---|---|---|
| A | 7858 | 7858 | 100.000000% |
| B | 7859 | 694 | 8.830640% |
| C | 7859 | 1215 | 15.459982% |
| D | 7859 | 1169 | 14.874666% |
Noise dominated data is calculated using 1-second bins in cleaned event files. If a bin has >2000 counts, and if more than 50% of those come from <1% of pixels, then it is considered to be noise-dominated and hence unusable.
| Quadrant | # 1 sec bins | Bins with >0 counts | Bins with >2000 counts | High rate bins dominated by noise | Noise dominated (total time) | Noise dominated (detector-on time) | Marked lightcurve |
|---|---|---|---|---|---|---|---|
| A | 7887 | 7857 | 7638 | 7638 | 96.84% | 97.21% | 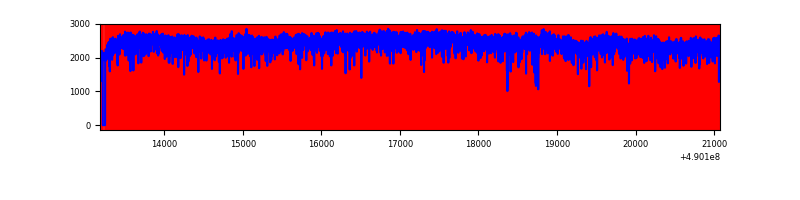 |
| B | 7889 | 7859 | 283 | 283 | 3.59% | 3.60% | 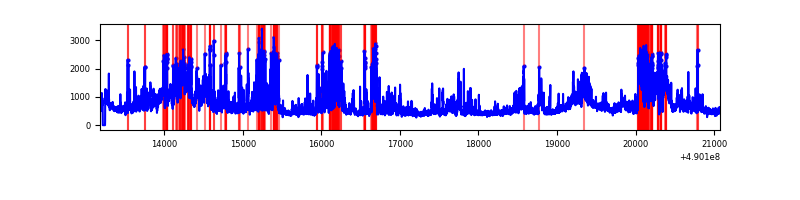 |
| C | 7889 | 7859 | 942 | 942 | 11.94% | 11.99% | 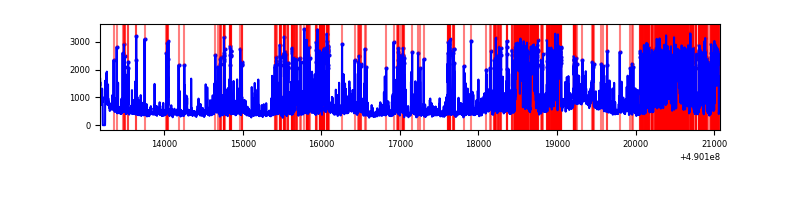 |
| D | 7889 | 7860 | 870 | 870 | 11.03% | 11.07% | 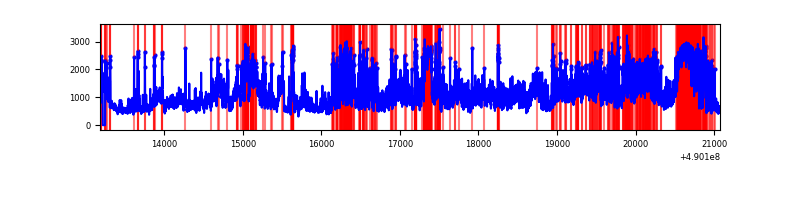 |
Top three noisy pixels from each quadrant. If the there are fewer than three noisy pixels in the level2.evt file, extra rows are filled as -1
| Pixel properties | Quadrant properties | ||||||
|---|---|---|---|---|---|---|---|
| Quadrant | DetID | PixID | Counts | Sigma | Mean | Median | Sigma |
| A | 9 | 191 | 18291956 | 498408.75 | 137 | 133 | 36.7 |
| A | 0 | 8 | 63621 | 1729.88 | 137 | 133 | 36.7 |
| A | 15 | 174 | 41786 | 1134.93 | 137 | 133 | 36.7 |
| B | 10 | 128 | 1198095 | 6584.23 | 854 | 823 | 181.8 |
| B | 10 | 254 | 775472 | 4260.07 | 854 | 823 | 181.8 |
| B | 12 | 17 | 364714 | 2001.17 | 854 | 823 | 181.8 |
| C | 12 | 254 | 829634 | 3833.17 | 798 | 792 | 216.2 |
| C | 2 | 12 | 556208 | 2568.65 | 798 | 792 | 216.2 |
| C | 15 | 224 | 528372 | 2439.91 | 798 | 792 | 216.2 |
| D | 2 | 62 | 1828560 | 8071.27 | 803 | 770 | 226.5 |
| D | 15 | 78 | 1823838 | 8050.41 | 803 | 770 | 226.5 |
| D | 8 | 176 | 443620 | 1955.56 | 803 | 770 | 226.5 |
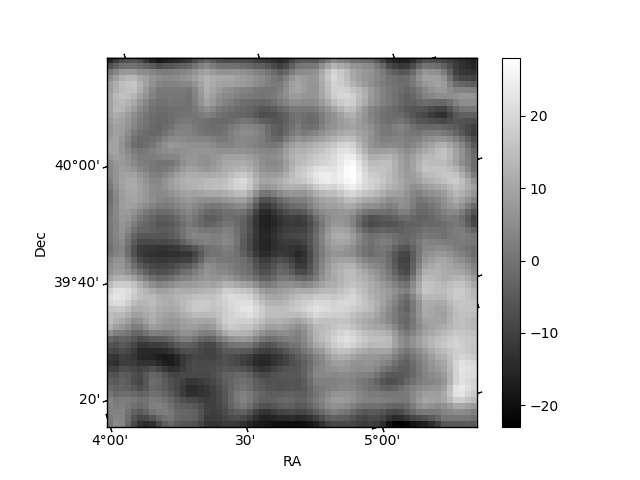
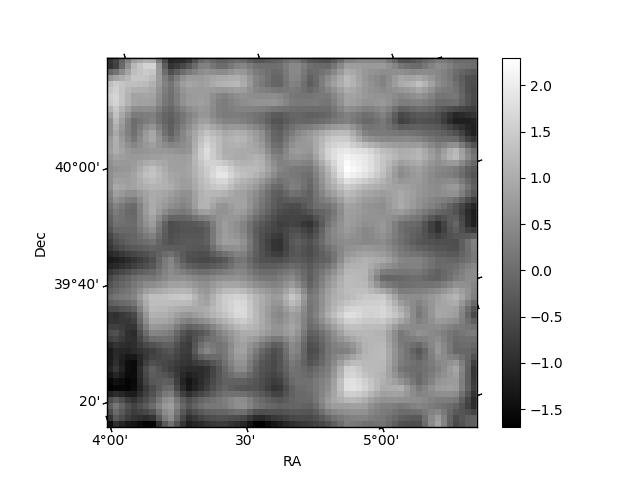
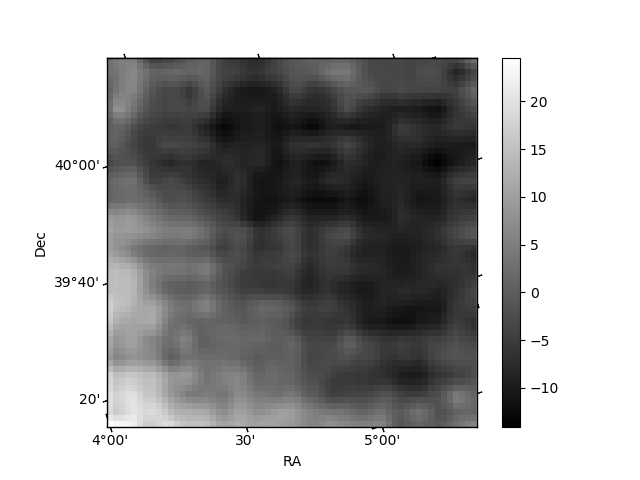
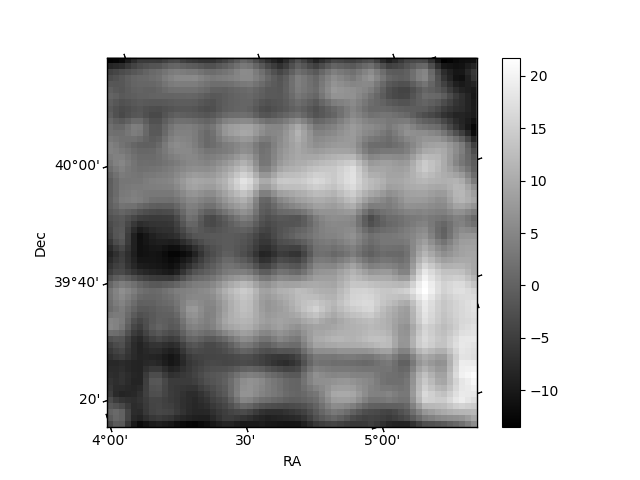
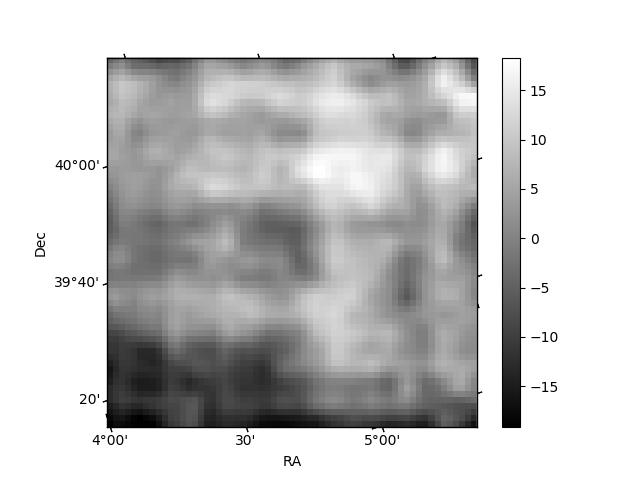
Histogram calculated using DETX and DETY for each event in the final _common_clean file
| Quadrant A | 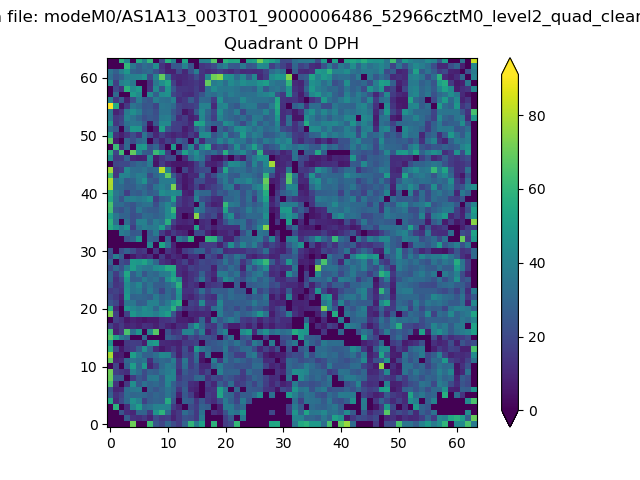 |
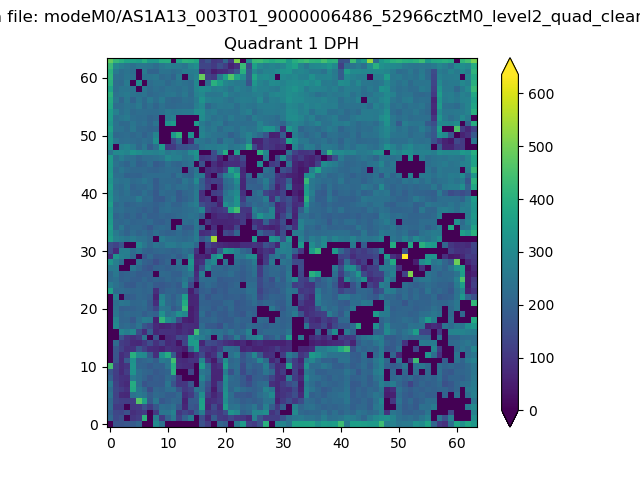 |
Quadrant B |
|---|---|---|---|
| Quadrant D | 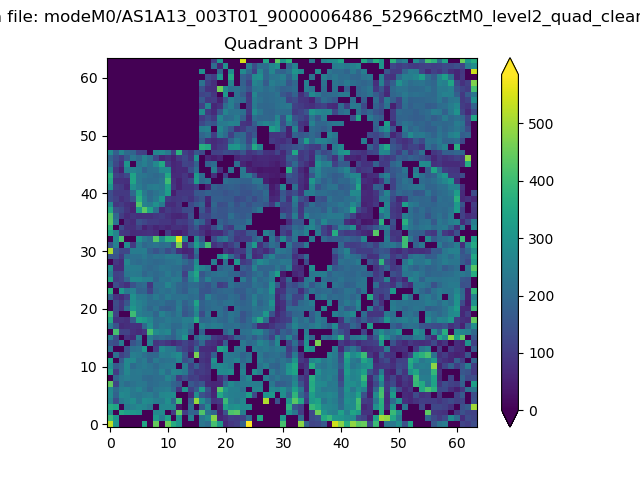 |
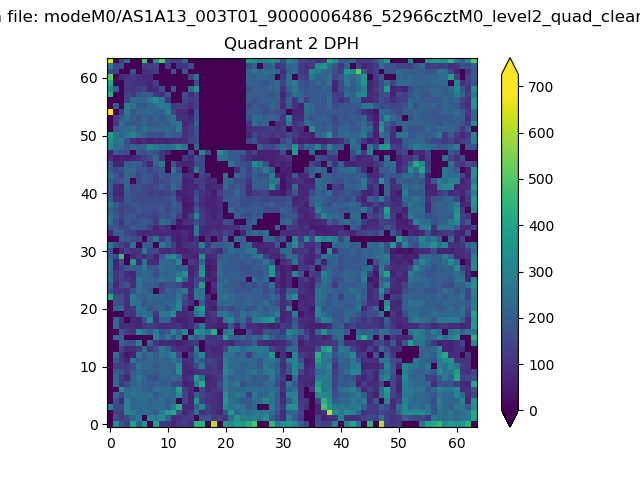 |
Quadrant C |
| Plot type | Count rate plots | Images |
|---|---|---|
| Comparison with Poisson distribution Blue bars denote a histogram of data divided into 1 sec bins. Red curve is a Poisson curve with rate = median count rate of data. |
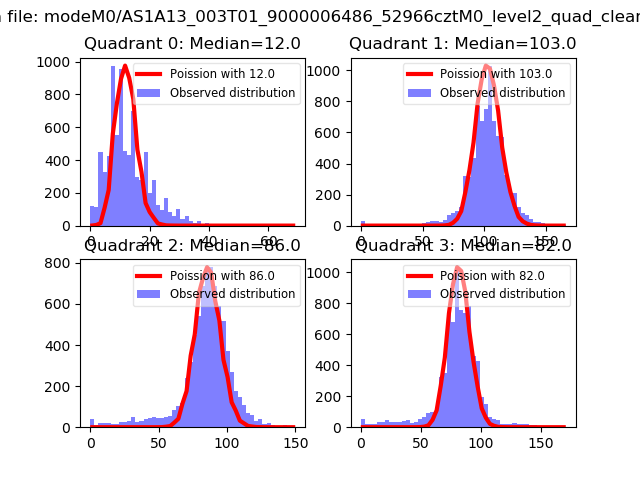 |
 |
| Quadrant-wise count rates Data is divided into 100 sec bins |
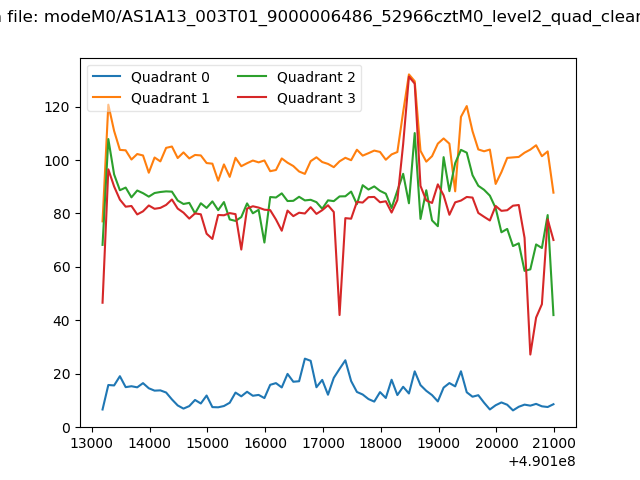 |
|
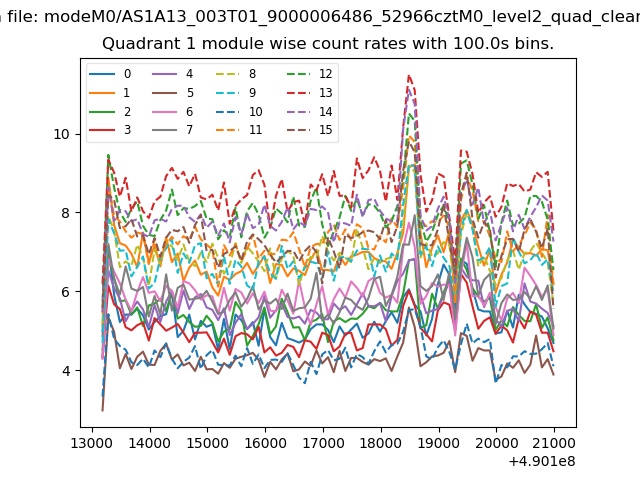
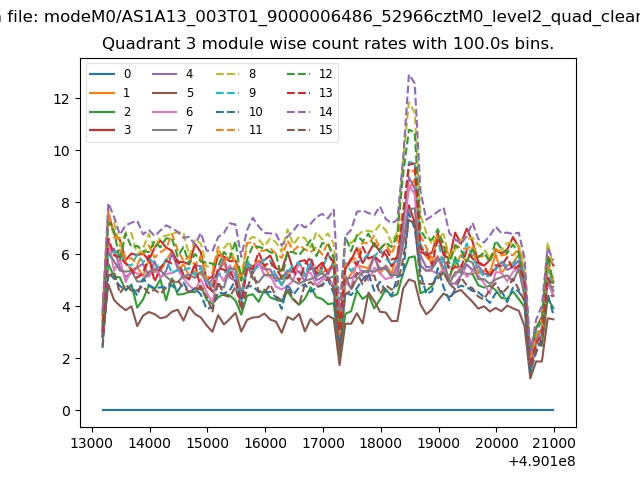
| Module-wise count rates for Quadrant A Data is divided into 100 sec bins |
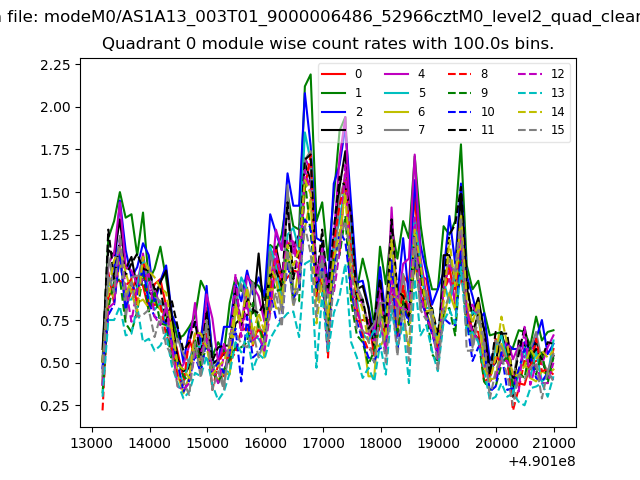 |
 |
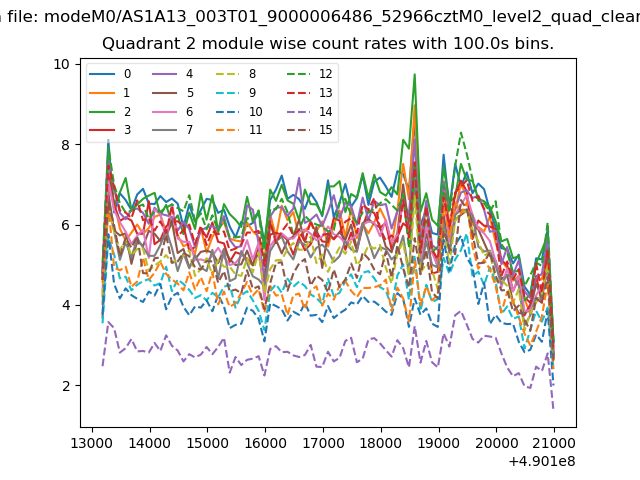
| Module-wise count rates for Quadrant B Data is divided into 100 sec bins |
 |
 |
| Module-wise count rates for Quadrant C Data is divided into 100 sec bins |
 |
 |
| Module-wise count rates for Quadrant D Data is divided into 100 sec bins |
 |
 |
| Parameter | Plot |
|---|---|
| CZT HV Monitor | 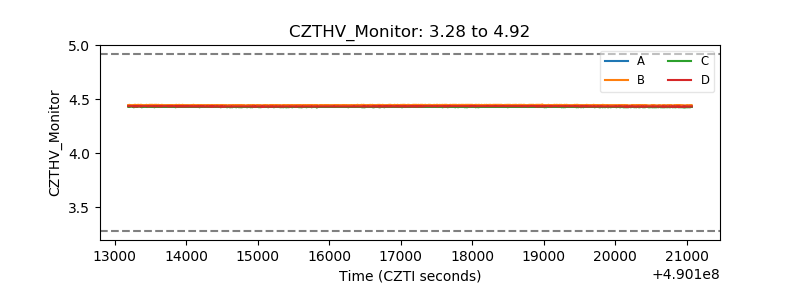 |
| D_VDD | 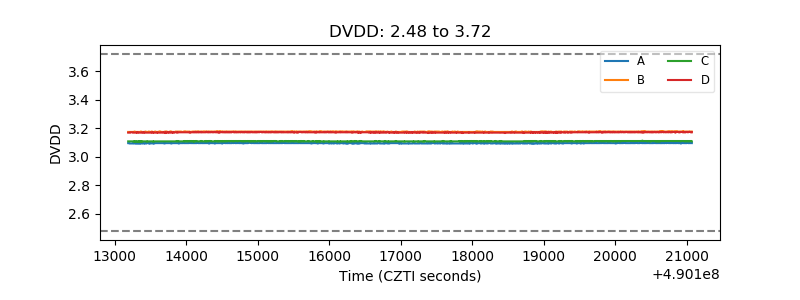 |
| Temperature 1 | 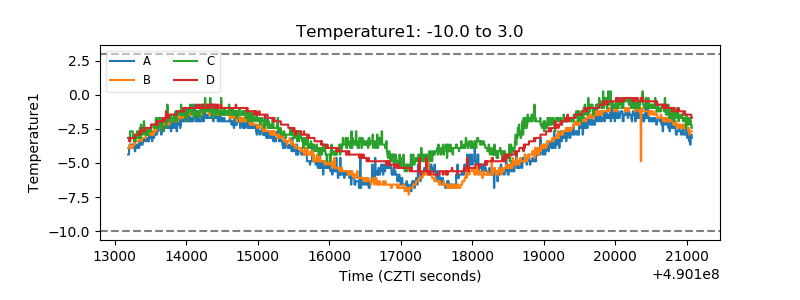 |
| Veto HV Monitor | 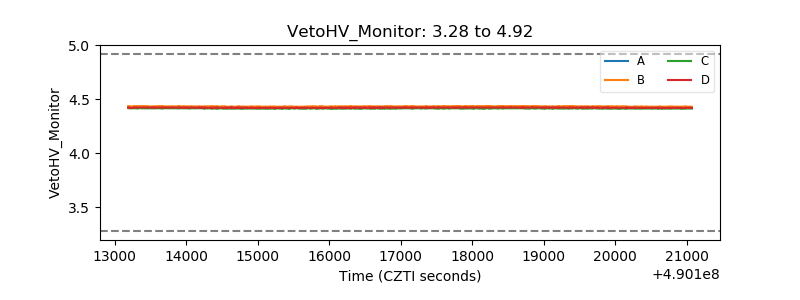 |
| Veto LLD | 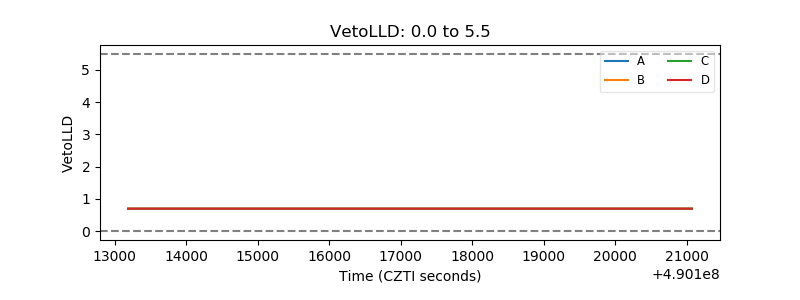 |
| Alpha Counter | 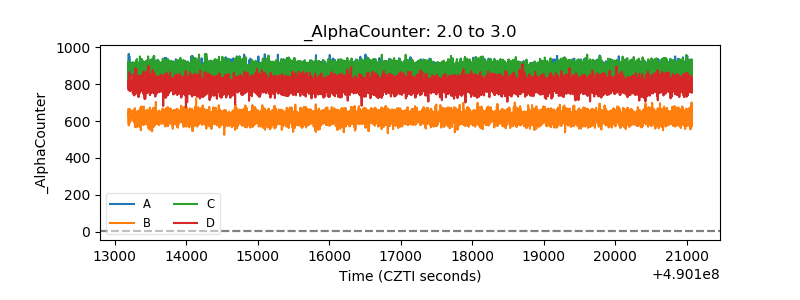 |
| _CPM_Rate | 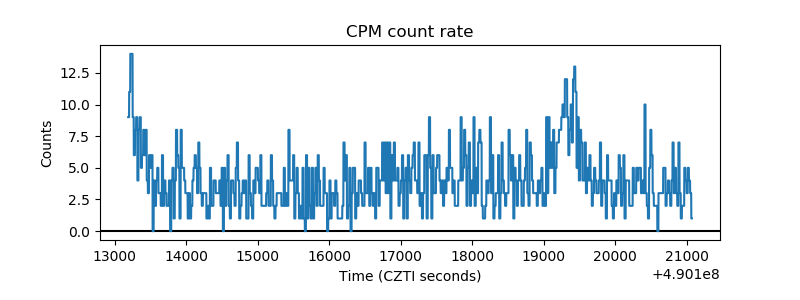 |
| CZT Counter | 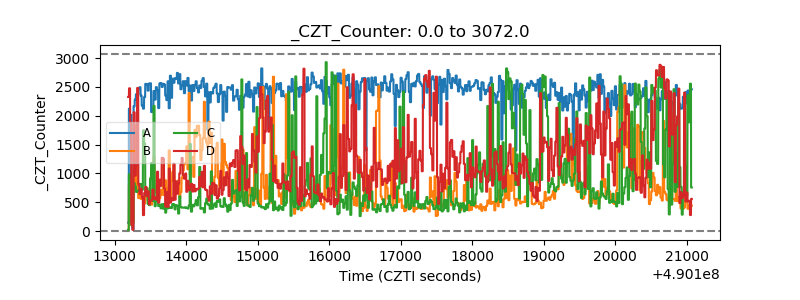 |
| +2.5 Volts monitor |  |
| +5 Volts monitor | 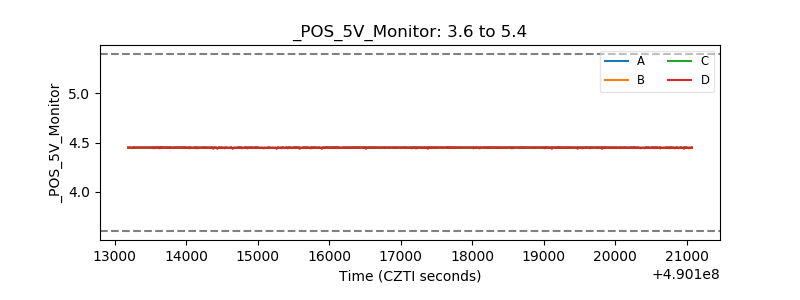 |
| _ROLL_ROT | 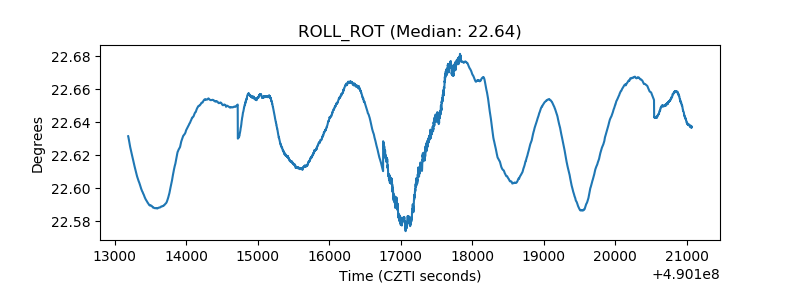 |
| _Roll_DEC | 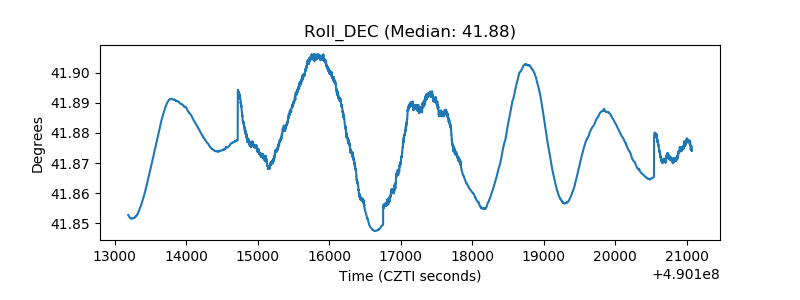 |
| _Roll_RA | 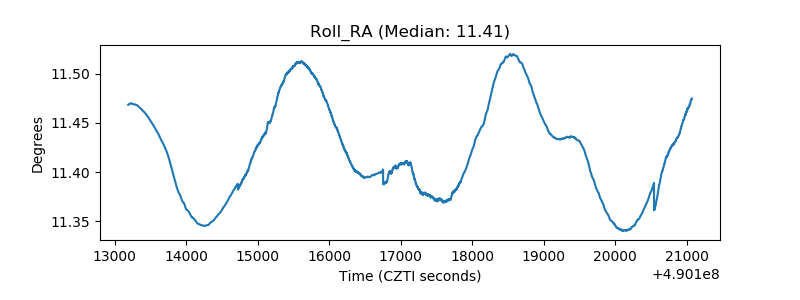 |
| Veto Counter | 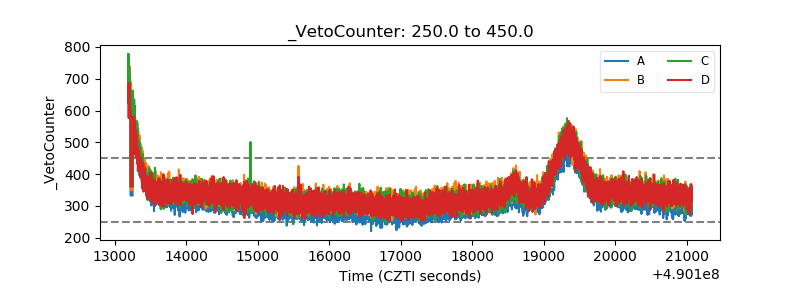 |