| Param | Original file | Final file |
|---|---|---|
| Filename | modeM0/AS1A13_003T01_9000006486_52970cztM0_level2.fits | modeM0/AS1A13_003T01_9000006486_52970cztM0_level2_quad_clean.evt |
| Size (bytes) | 1,186,107,840 | 87,508,800 |
| Size | 1.1 GB | 83.5 MB |
| Events in quadrant A | 18,340,053 | 70,761 |
| Events in quadrant B | 6,446,904 | 810,329 |
| Events in quadrant C | 12,271,411 | 558,218 |
| Events in quadrant D | 6,240,403 | 658,579 |
| Mode M9 | |||
|---|---|---|---|
| Quadrant | BADHDUFLAG | Total packets | Discarded packets |
| A | 0 | 1 | 0 |
| B | 0 | 1 | 0 |
| C | 0 | 1 | 0 |
| D | 0 | 1 | 0 |
| Mode M0 | |||
|---|---|---|---|
| Quadrant | BADHDUFLAG | Total packets | Discarded packets |
| A | 0 | 59821 | 0 |
| B | 0 | 24595 | 0 |
| C | 0 | 41883 | 0 |
| D | 0 | 23993 | 0 |
| Mode SS | |||
|---|---|---|---|
| Quadrant | BADHDUFLAG | Total packets | Discarded packets |
| A | 0 | 158 | 0 |
| B | 0 | 158 | 0 |
| C | 0 | 158 | 0 |
| D | 0 | 158 | 0 |
| Quadrant | Total seconds | Saturated seconds | Saturation percentage |
|---|---|---|---|
| A | 7853 | 7853 | 100.000000% |
| B | 7853 | 677 | 8.620909% |
| C | 7852 | 3312 | 42.180336% |
| D | 7853 | 549 | 6.990959% |
Noise dominated data is calculated using 1-second bins in cleaned event files. If a bin has >2000 counts, and if more than 50% of those come from <1% of pixels, then it is considered to be noise-dominated and hence unusable.
| Quadrant | # 1 sec bins | Bins with >0 counts | Bins with >2000 counts | High rate bins dominated by noise | Noise dominated (total time) | Noise dominated (detector-on time) | Marked lightcurve |
|---|---|---|---|---|---|---|---|
| A | 7927 | 7852 | 7445 | 7445 | 93.92% | 94.82% | 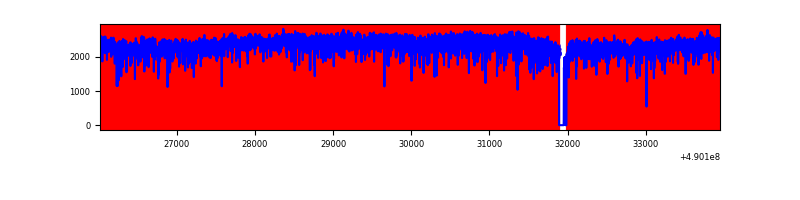 |
| B | 7927 | 7854 | 536 | 536 | 6.76% | 6.82% | 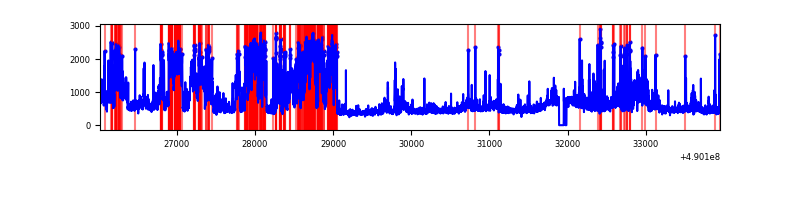 |
| C | 7927 | 7852 | 3037 | 3037 | 38.31% | 38.68% | 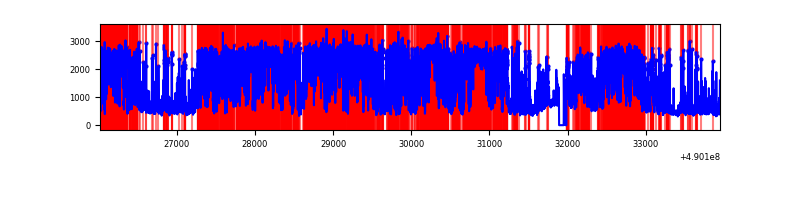 |
| D | 7928 | 7855 | 344 | 344 | 4.34% | 4.38% | 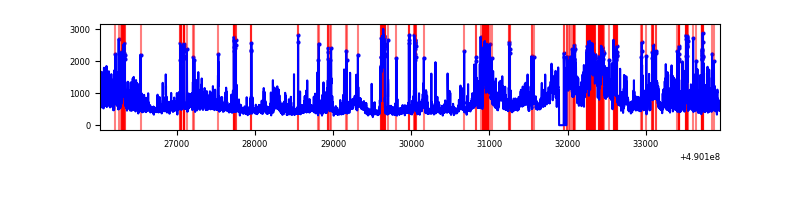 |
Top three noisy pixels from each quadrant. If the there are fewer than three noisy pixels in the level2.evt file, extra rows are filled as -1
| Pixel properties | Quadrant properties | ||||||
|---|---|---|---|---|---|---|---|
| Quadrant | DetID | PixID | Counts | Sigma | Mean | Median | Sigma |
| A | 9 | 191 | 17769061 | 654068.08 | 98 | 96 | 27.2 |
| A | 9 | 175 | 52799 | 1939.98 | 98 | 96 | 27.2 |
| A | 15 | 174 | 40533 | 1488.47 | 98 | 96 | 27.2 |
| B | 10 | 254 | 2417342 | 13411.18 | 842 | 814 | 180.2 |
| B | 10 | 63 | 141598 | 781.32 | 842 | 814 | 180.2 |
| B | 12 | 17 | 128745 | 709.99 | 842 | 814 | 180.2 |
| C | 4 | 5 | 4178059 | 22243.72 | 674 | 666 | 187.8 |
| C | 12 | 254 | 1517586 | 8077.27 | 674 | 666 | 187.8 |
| C | 15 | 224 | 754690 | 4015.01 | 674 | 666 | 187.8 |
| D | 15 | 78 | 1184927 | 5001.84 | 819 | 782 | 236.7 |
| D | 2 | 62 | 566772 | 2390.75 | 819 | 782 | 236.7 |
| D | 4 | 233 | 306869 | 1292.92 | 819 | 782 | 236.7 |
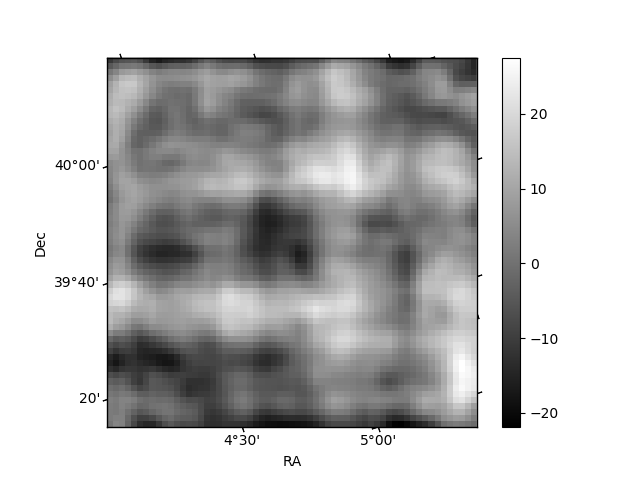
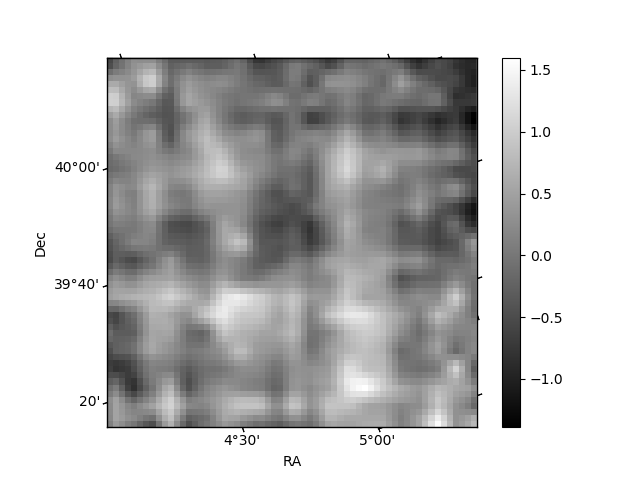
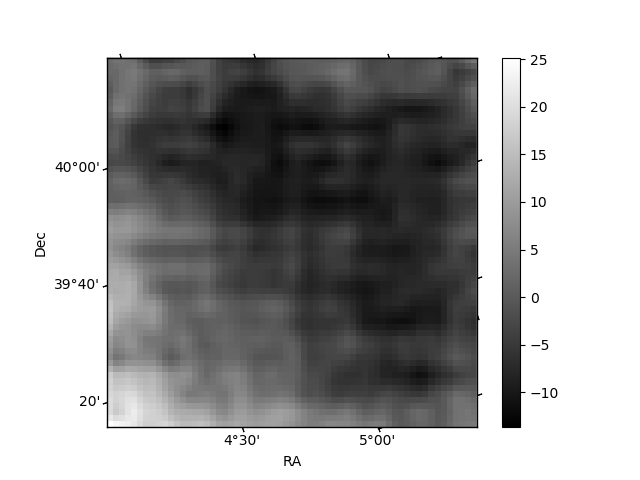
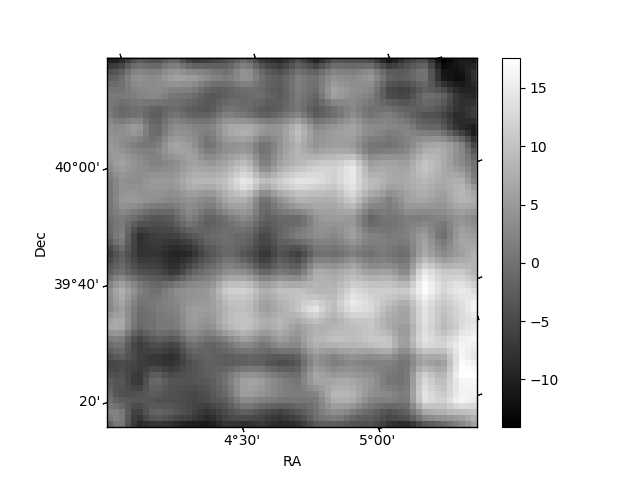
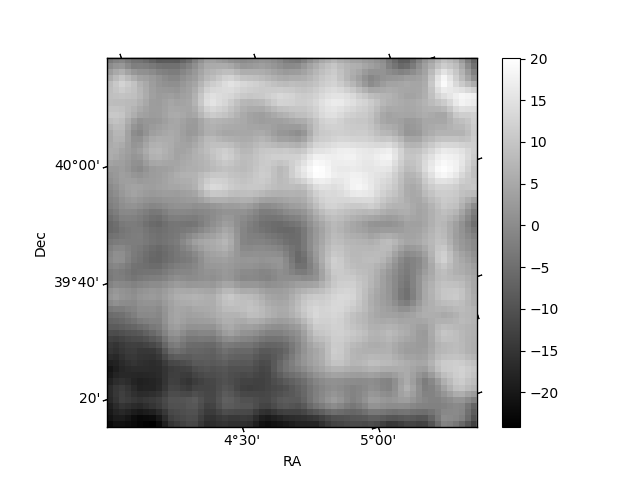
Histogram calculated using DETX and DETY for each event in the final _common_clean file
| Quadrant A | 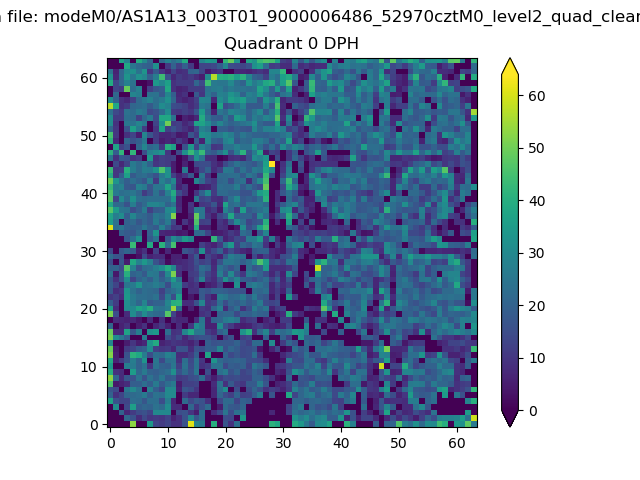 |
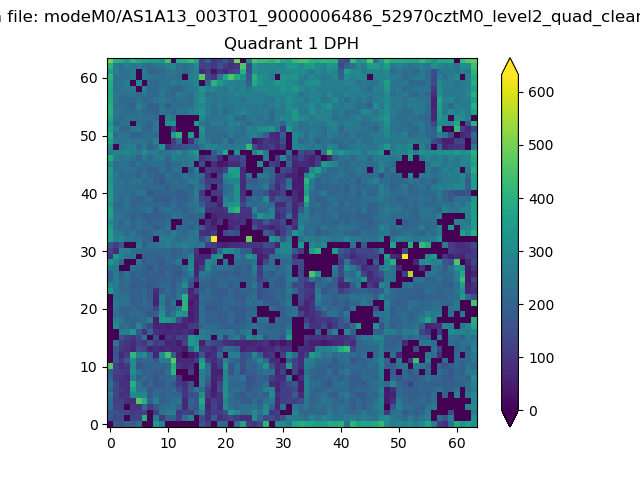 |
Quadrant B |
|---|---|---|---|
| Quadrant D | 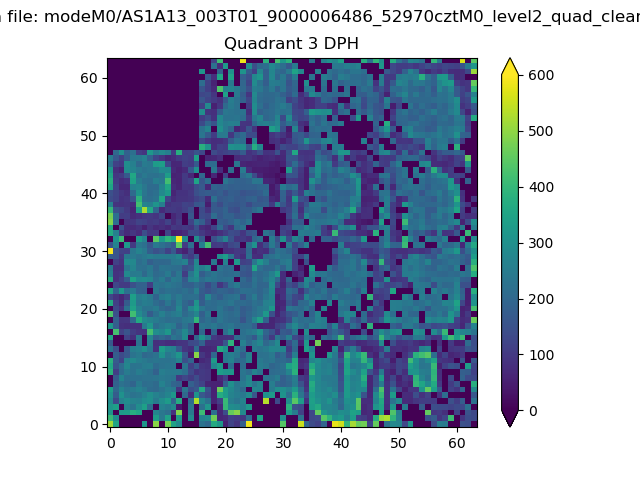 |
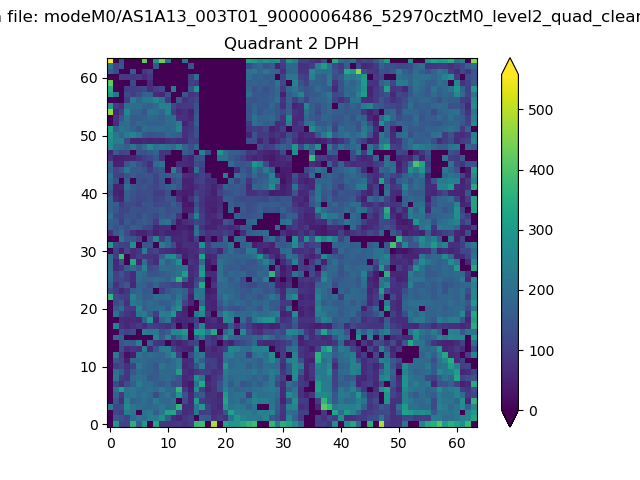 |
Quadrant C |
| Plot type | Count rate plots | Images |
|---|---|---|
| Comparison with Poisson distribution Blue bars denote a histogram of data divided into 1 sec bins. Red curve is a Poisson curve with rate = median count rate of data. |
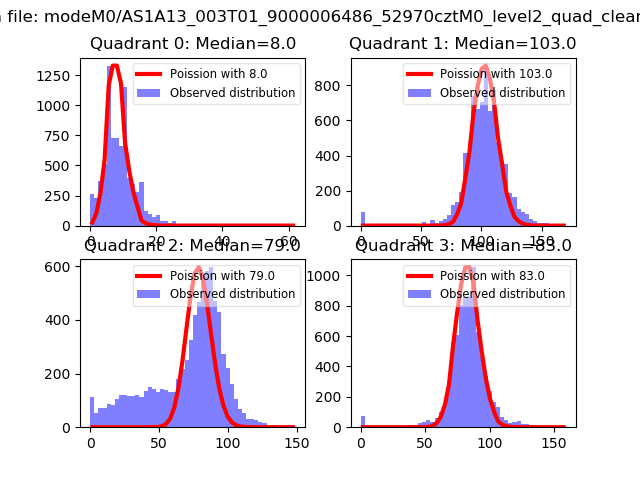 |
 |
| Quadrant-wise count rates Data is divided into 100 sec bins |
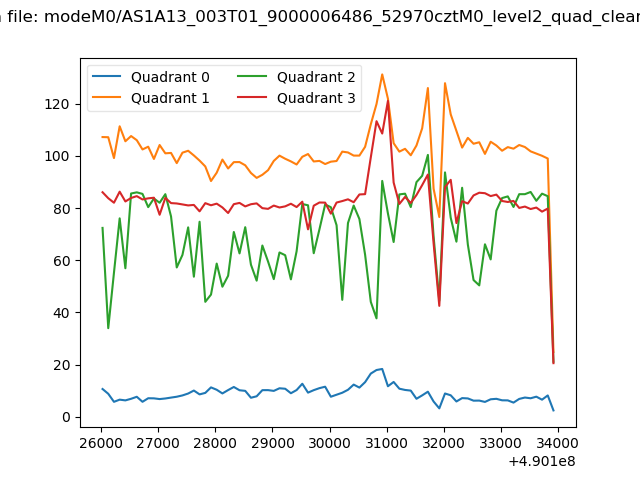 |
|
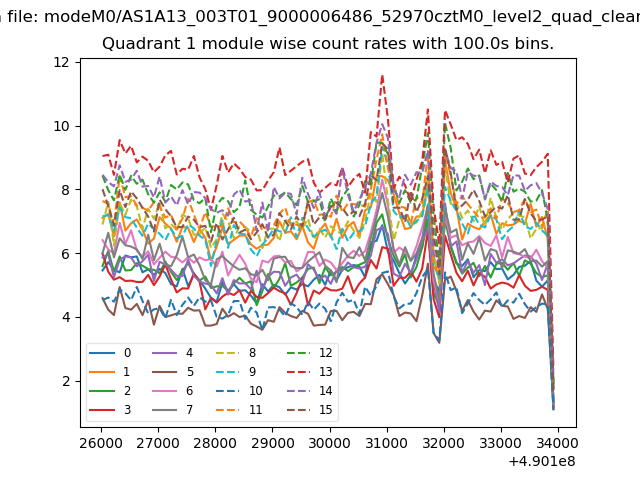
| Module-wise count rates for Quadrant A Data is divided into 100 sec bins |
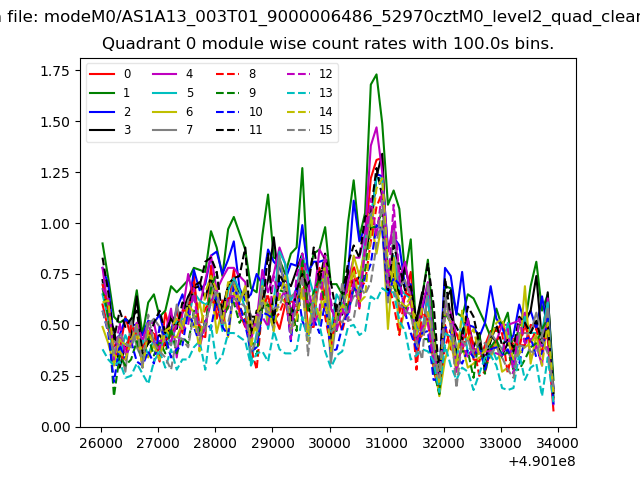 |
 |
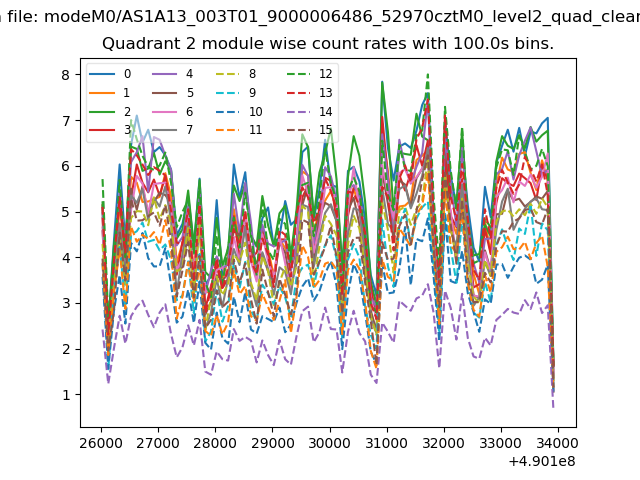
| Module-wise count rates for Quadrant B Data is divided into 100 sec bins |
 |
 |
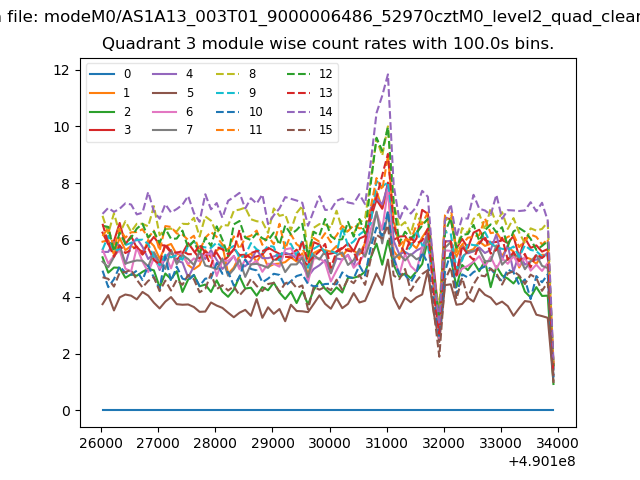
| Module-wise count rates for Quadrant C Data is divided into 100 sec bins |
 |
 |
| Module-wise count rates for Quadrant D Data is divided into 100 sec bins |
 |
 |
| Parameter | Plot |
|---|---|
| CZT HV Monitor | 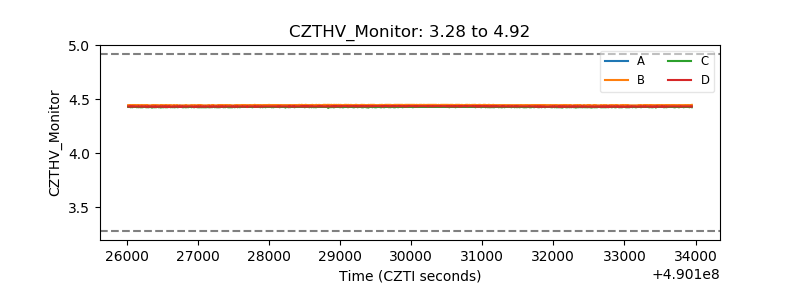 |
| D_VDD | 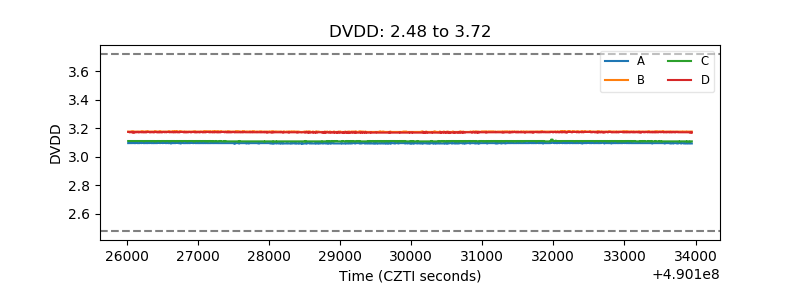 |
| Temperature 1 | 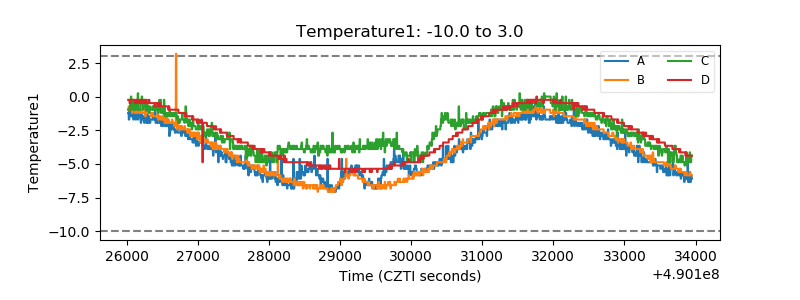 |
| Veto HV Monitor | 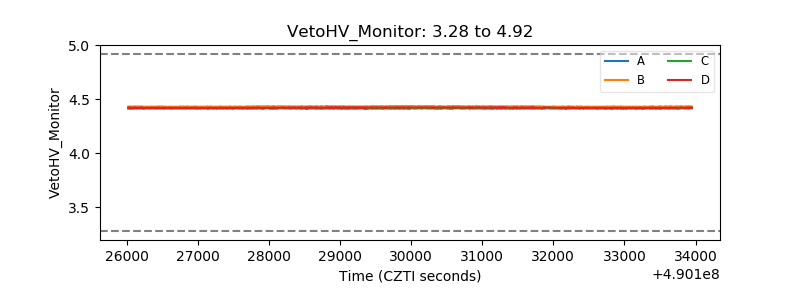 |
| Veto LLD | 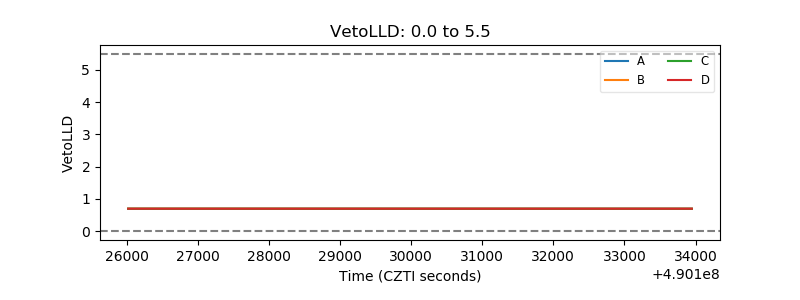 |
| Alpha Counter | 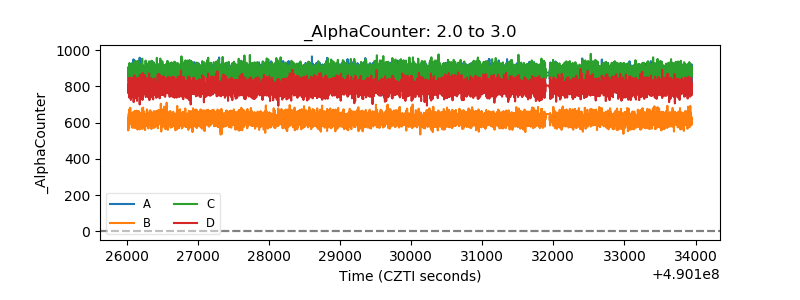 |
| _CPM_Rate | 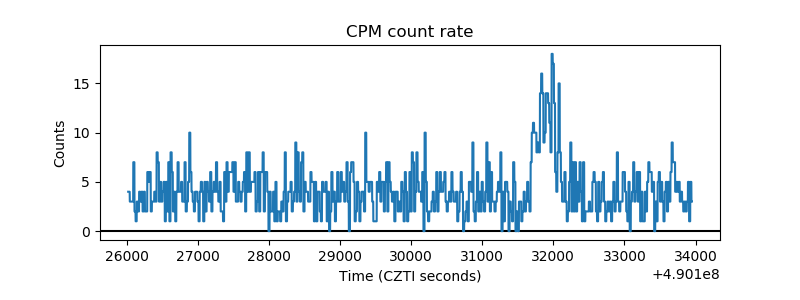 |
| CZT Counter | 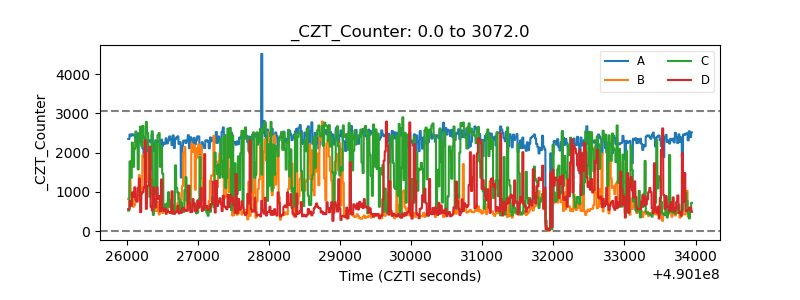 |
| +2.5 Volts monitor |  |
| +5 Volts monitor | 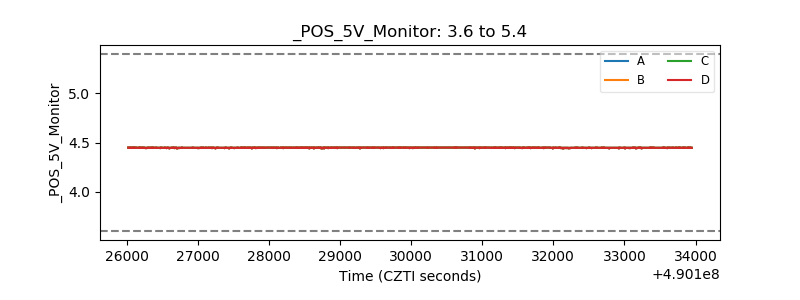 |
| _ROLL_ROT | 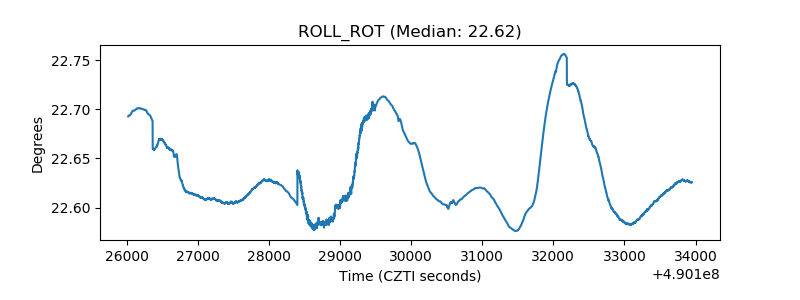 |
| _Roll_DEC | 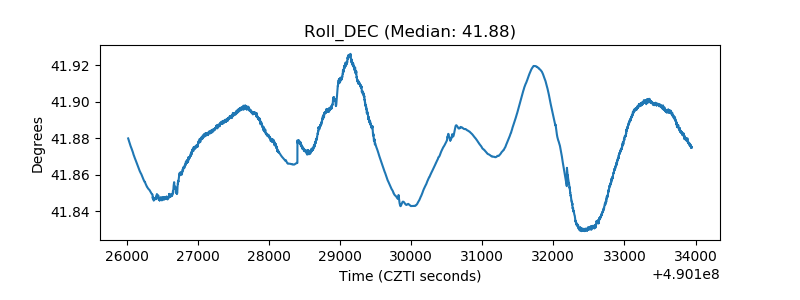 |
| _Roll_RA | 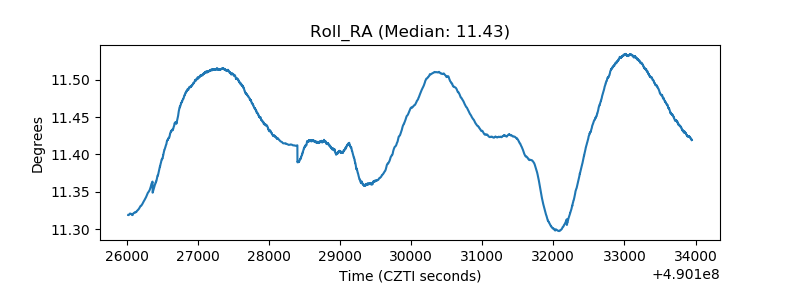 |
| Veto Counter | 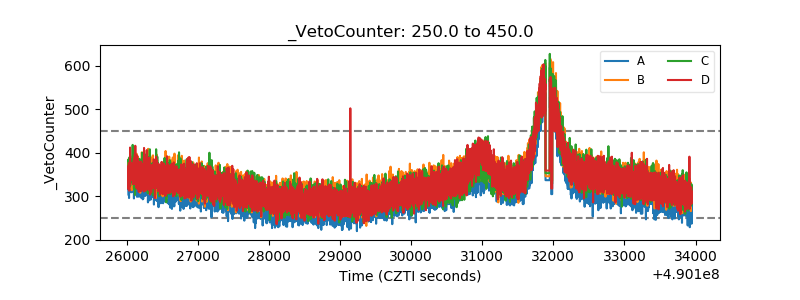 |