| Param | Original file | Final file |
|---|---|---|
| Filename | modeM0/AS1A13_003T01_9000006486_52974cztM0_level2.fits | modeM0/AS1A13_003T01_9000006486_52974cztM0_level2_quad_clean.evt |
| Size (bytes) | 833,011,200 | 78,416,640 |
| Size | 794.4 MB | 74.8 MB |
| Events in quadrant A | 16,263,898 | 66,968 |
| Events in quadrant B | 3,021,168 | 701,163 |
| Events in quadrant C | 6,194,192 | 571,915 |
| Events in quadrant D | 4,834,827 | 563,152 |
| Mode M9 | |||
|---|---|---|---|
| Quadrant | BADHDUFLAG | Total packets | Discarded packets |
| A | 0 | 12 | 0 |
| B | 0 | 13 | 0 |
| C | 0 | 13 | 0 |
| D | 0 | 13 | 0 |
| Mode M0 | |||
|---|---|---|---|
| Quadrant | BADHDUFLAG | Total packets | Discarded packets |
| A | 0 | 52768 | 0 |
| B | 0 | 14064 | 0 |
| C | 0 | 23126 | 0 |
| D | 0 | 19179 | 0 |
| Mode SS | |||
|---|---|---|---|
| Quadrant | BADHDUFLAG | Total packets | Discarded packets |
| A | 0 | 136 | 0 |
| B | 0 | 136 | 0 |
| C | 0 | 136 | 0 |
| D | 0 | 136 | 0 |
| Quadrant | Total seconds | Saturated seconds | Saturation percentage |
|---|---|---|---|
| A | 6697 | 6697 | 100.000000% |
| B | 6711 | 37 | 0.551334% |
| C | 6701 | 846 | 12.624981% |
| D | 6711 | 409 | 6.094472% |
Noise dominated data is calculated using 1-second bins in cleaned event files. If a bin has >2000 counts, and if more than 50% of those come from <1% of pixels, then it is considered to be noise-dominated and hence unusable.
| Quadrant | # 1 sec bins | Bins with >0 counts | Bins with >2000 counts | High rate bins dominated by noise | Noise dominated (total time) | Noise dominated (detector-on time) | Marked lightcurve |
|---|---|---|---|---|---|---|---|
| A | 7794 | 6697 | 6522 | 6522 | 83.68% | 97.39% | 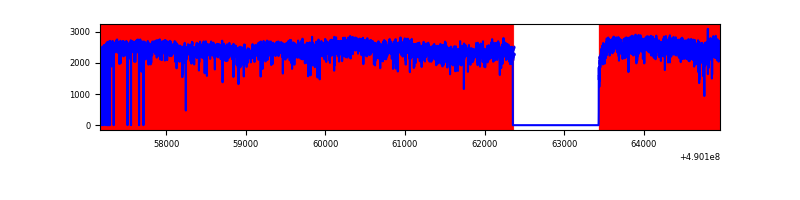 |
| B | 7794 | 6713 | 20 | 20 | 0.26% | 0.30% | 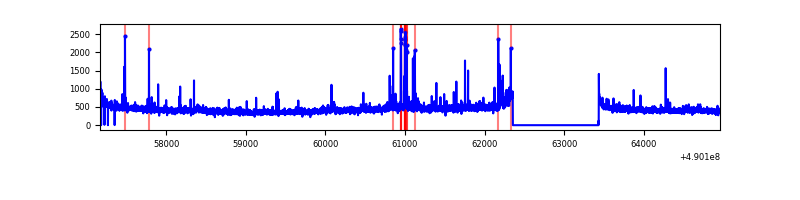 |
| C | 7794 | 6705 | 760 | 760 | 9.75% | 11.33% | 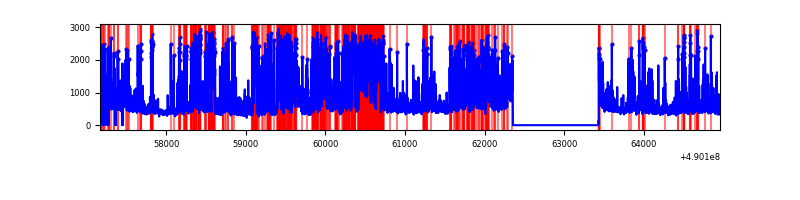 |
| D | 7794 | 6713 | 415 | 415 | 5.32% | 6.18% | 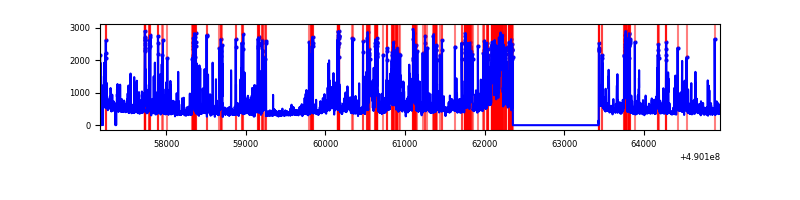 |
Top three noisy pixels from each quadrant. If the there are fewer than three noisy pixels in the level2.evt file, extra rows are filled as -1
| Pixel properties | Quadrant properties | ||||||
|---|---|---|---|---|---|---|---|
| Quadrant | DetID | PixID | Counts | Sigma | Mean | Median | Sigma |
| A | 9 | 191 | 15832924 | 649468.08 | 88 | 86 | 24.4 |
| A | 0 | 8 | 31375 | 1283.48 | 88 | 86 | 24.4 |
| A | 4 | 249 | 14207 | 579.25 | 88 | 86 | 24.4 |
| B | 10 | 63 | 45806 | 296.28 | 701 | 677 | 152.3 |
| B | 0 | 143 | 31798 | 204.32 | 701 | 677 | 152.3 |
| B | 4 | 81 | 26759 | 171.23 | 701 | 677 | 152.3 |
| C | 12 | 254 | 2583519 | 14602.64 | 638 | 635 | 176.9 |
| C | 4 | 5 | 228654 | 1289.13 | 638 | 635 | 176.9 |
| C | 15 | 224 | 168879 | 951.19 | 638 | 635 | 176.9 |
| D | 8 | 176 | 661524 | 3504.18 | 654 | 622 | 188.6 |
| D | 1 | 0 | 299145 | 1582.8 | 654 | 622 | 188.6 |
| D | 12 | 2 | 187850 | 992.7 | 654 | 622 | 188.6 |
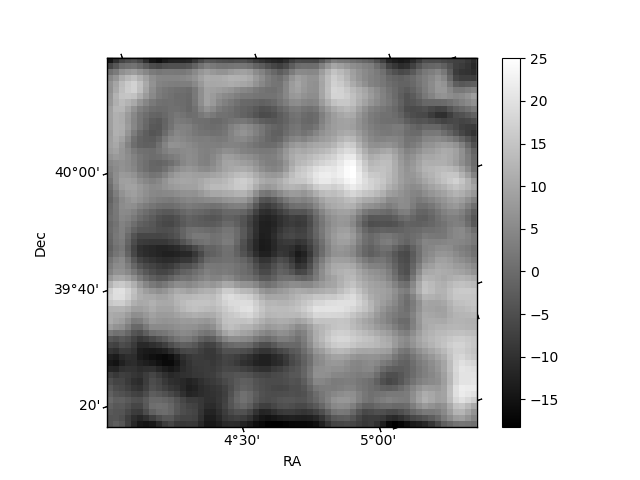
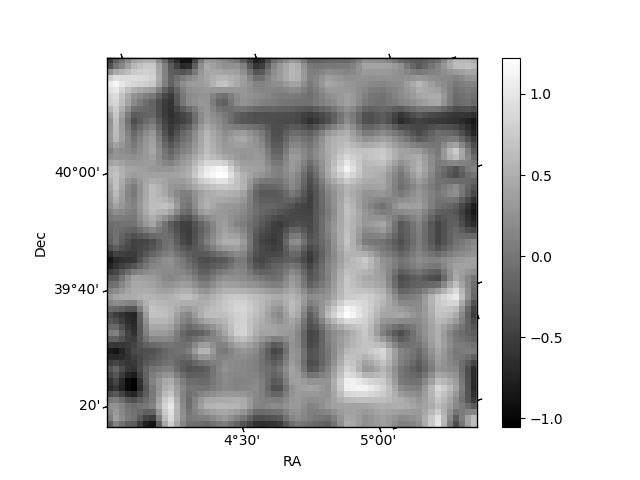
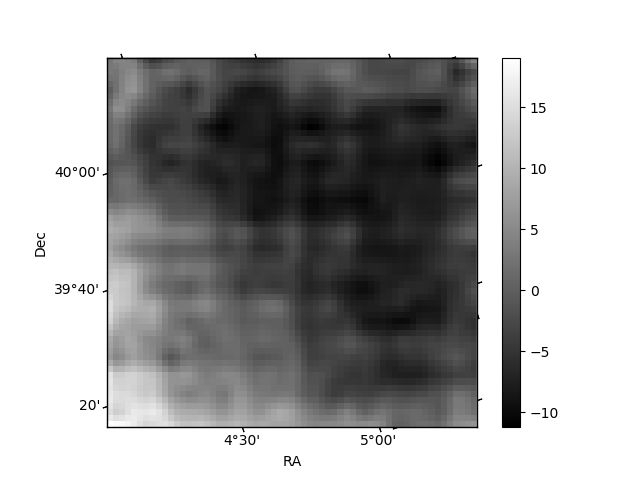
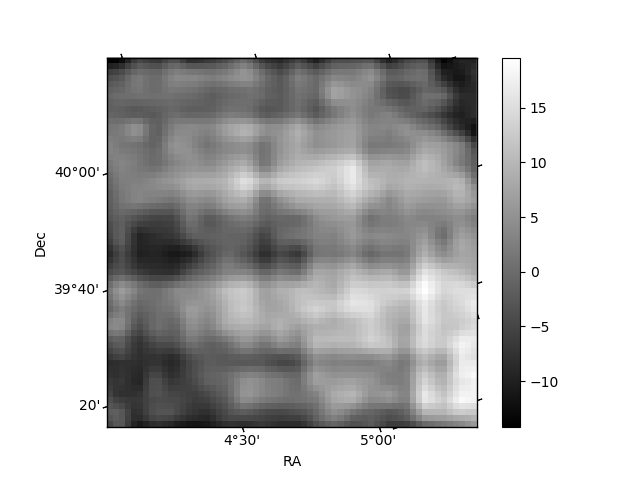
Histogram calculated using DETX and DETY for each event in the final _common_clean file
| Quadrant A | 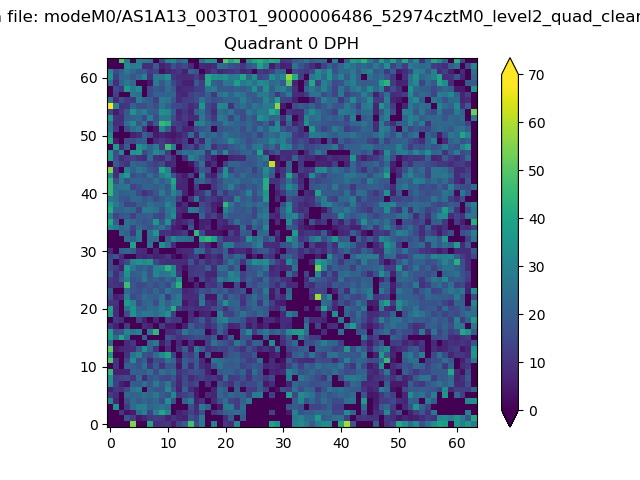 |
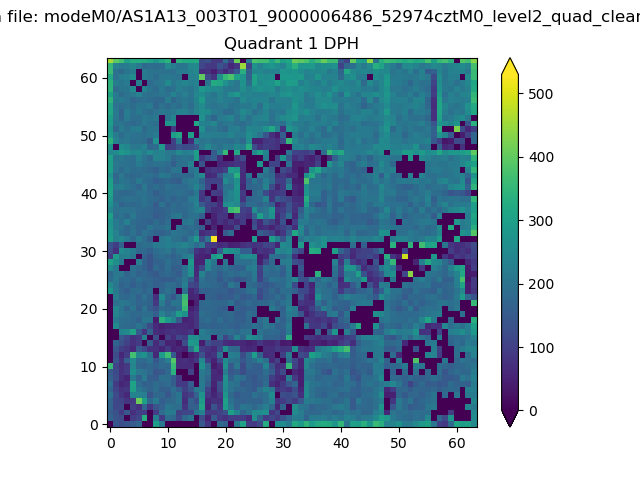 |
Quadrant B |
|---|---|---|---|
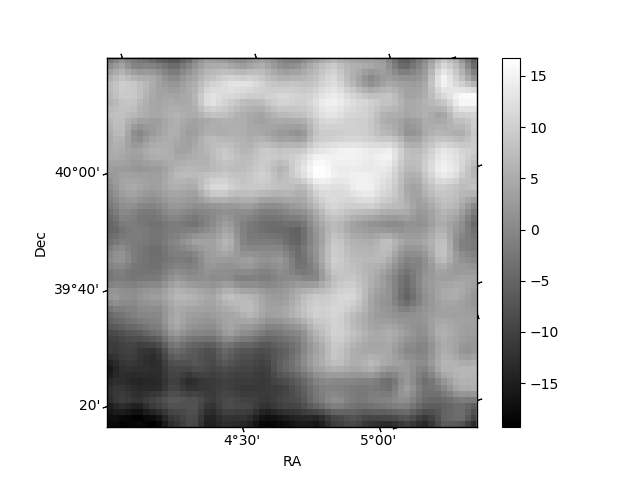
| Quadrant D | 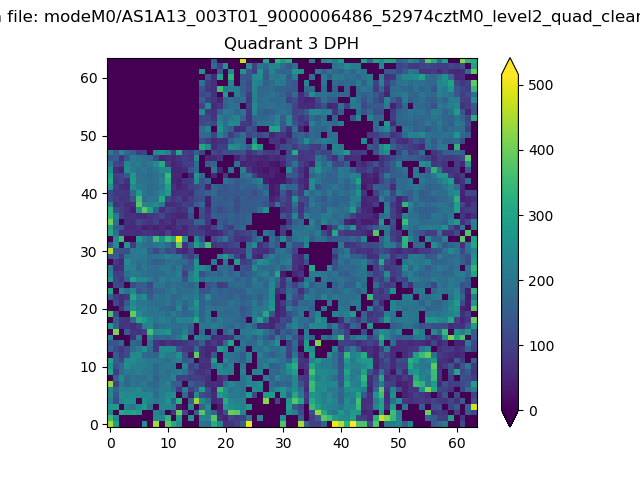 |
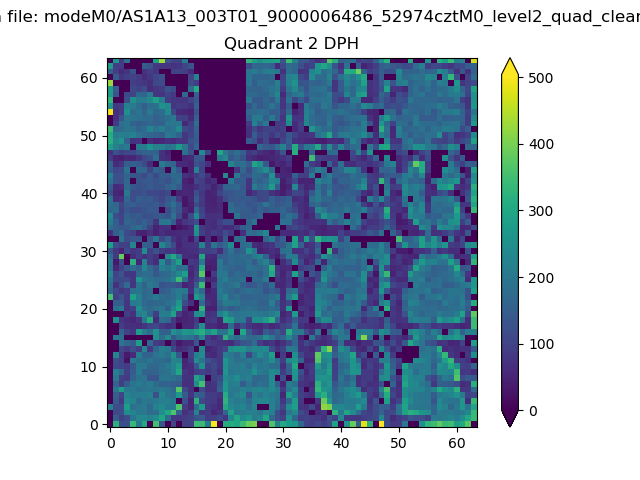 |
Quadrant C |
| Plot type | Count rate plots | Images |
|---|---|---|
| Comparison with Poisson distribution Blue bars denote a histogram of data divided into 1 sec bins. Red curve is a Poisson curve with rate = median count rate of data. |
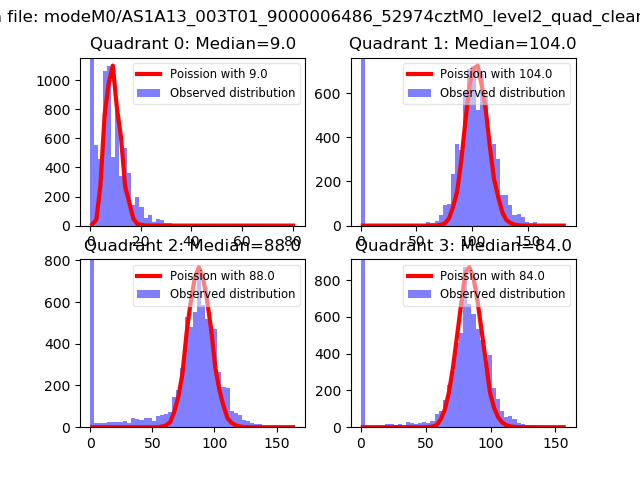 |
 |
| Quadrant-wise count rates Data is divided into 100 sec bins |
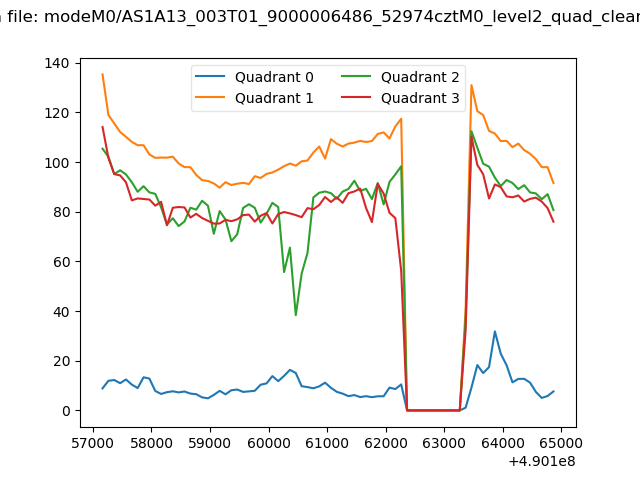 |
|
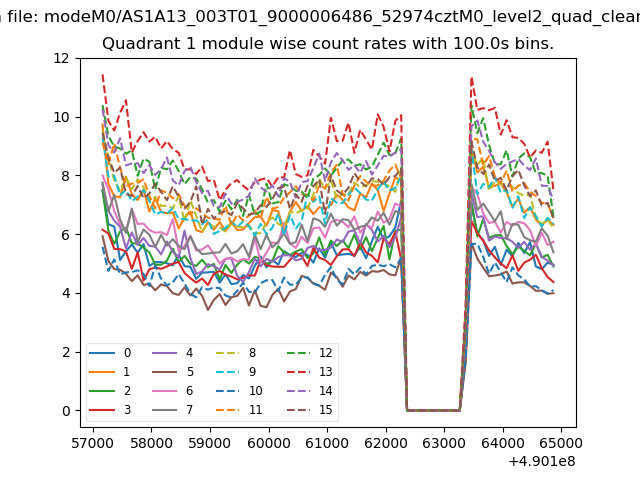
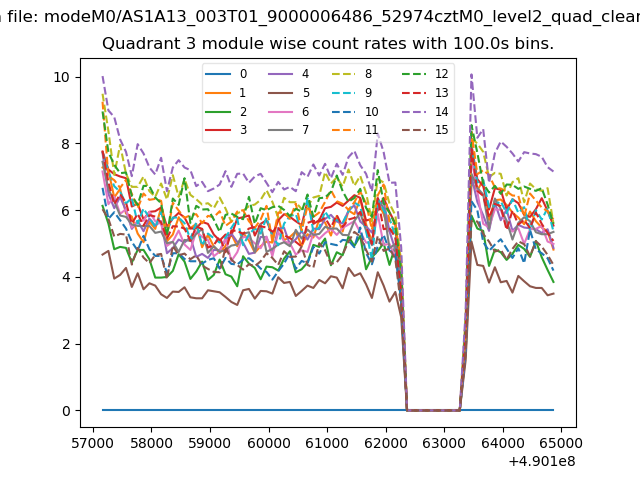
| Module-wise count rates for Quadrant A Data is divided into 100 sec bins |
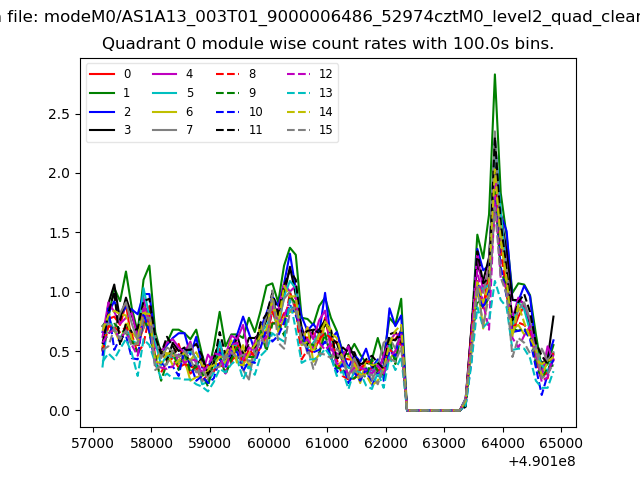 |
 |
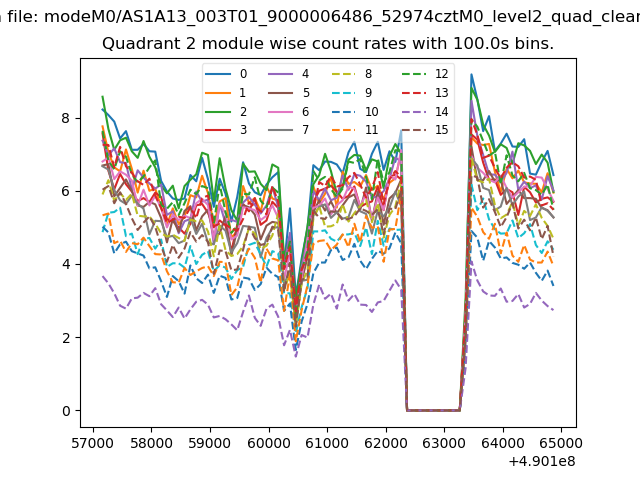
| Module-wise count rates for Quadrant B Data is divided into 100 sec bins |
 |
 |
| Module-wise count rates for Quadrant C Data is divided into 100 sec bins |
 |
 |
| Module-wise count rates for Quadrant D Data is divided into 100 sec bins |
 |
 |
| Parameter | Plot |
|---|---|
| CZT HV Monitor | 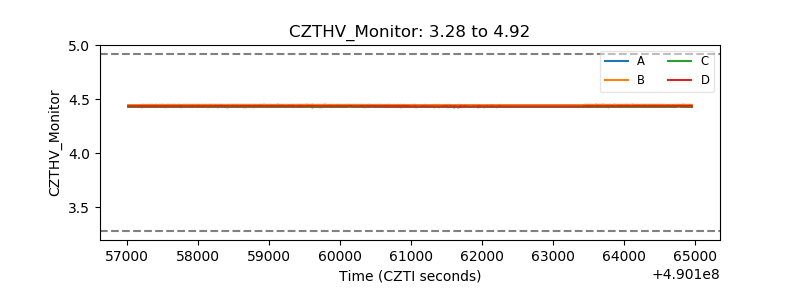 |
| D_VDD | 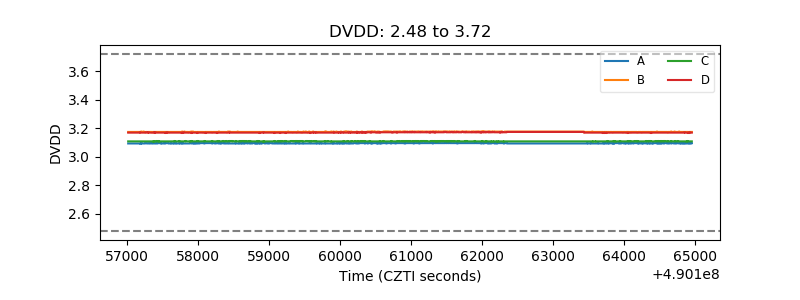 |
| Temperature 1 | 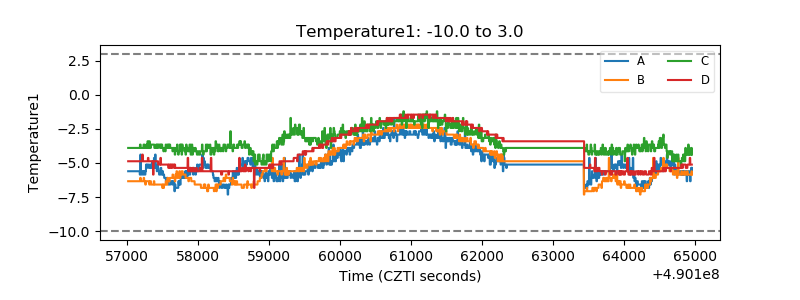 |
| Veto HV Monitor | 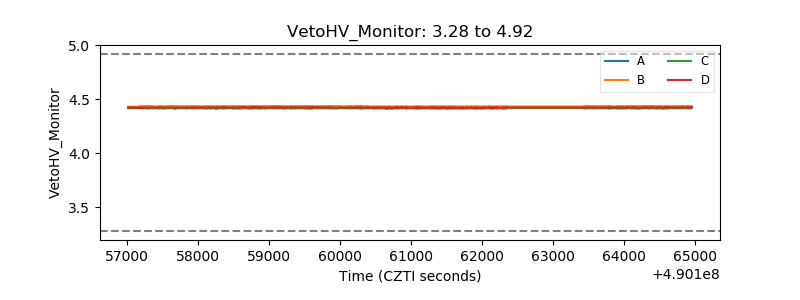 |
| Veto LLD | 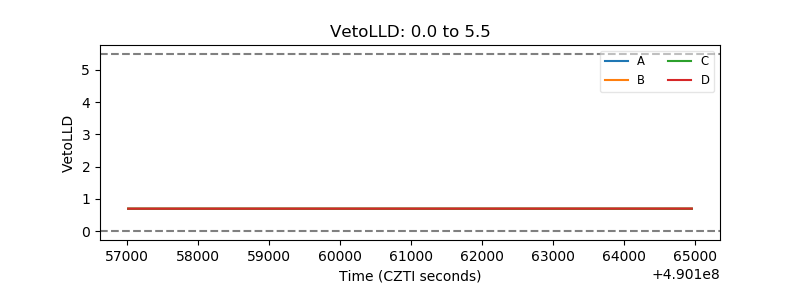 |
| Alpha Counter | 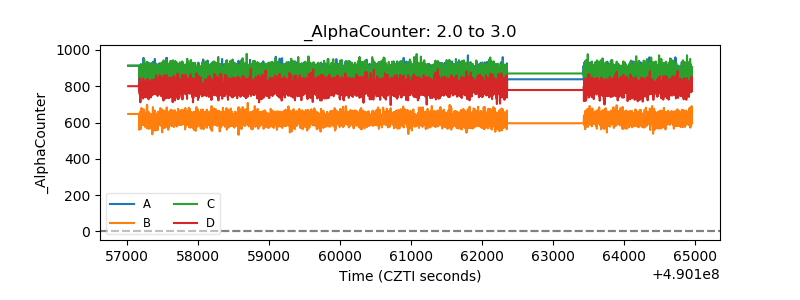 |
| _CPM_Rate | 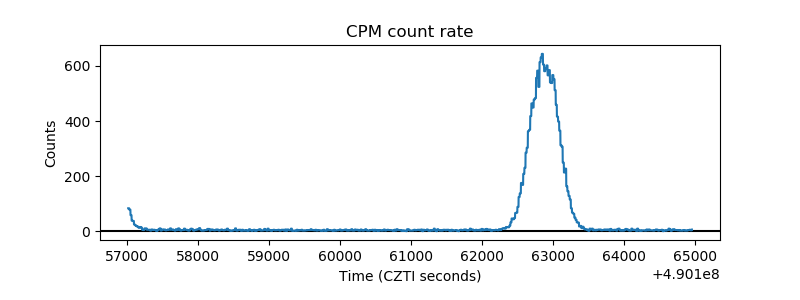 |
| CZT Counter | 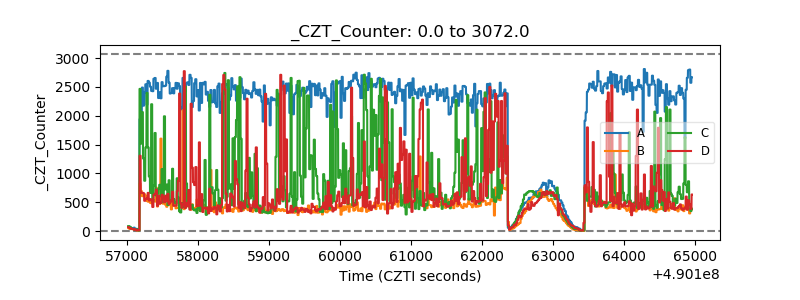 |
| +2.5 Volts monitor | 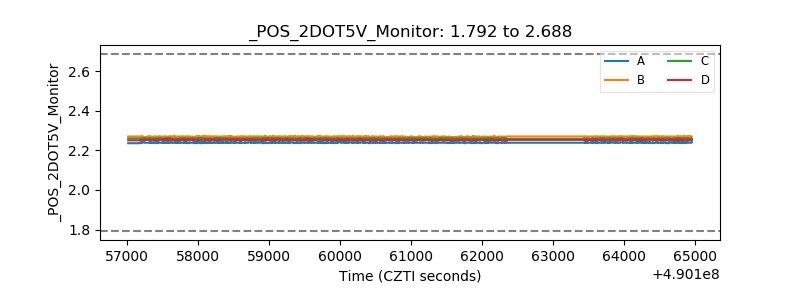 |
| +5 Volts monitor | 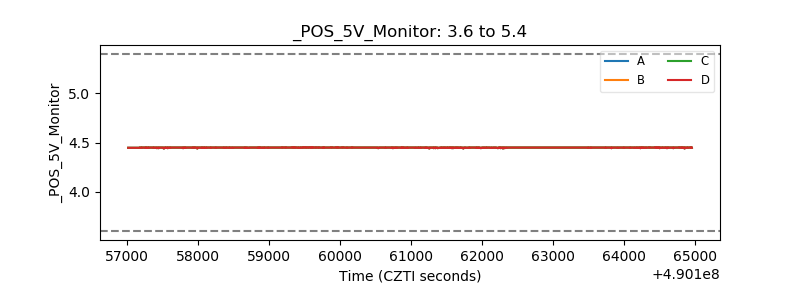 |
| _ROLL_ROT | 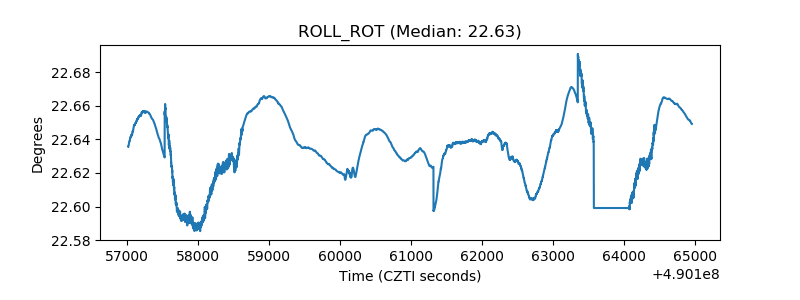 |
| _Roll_DEC | 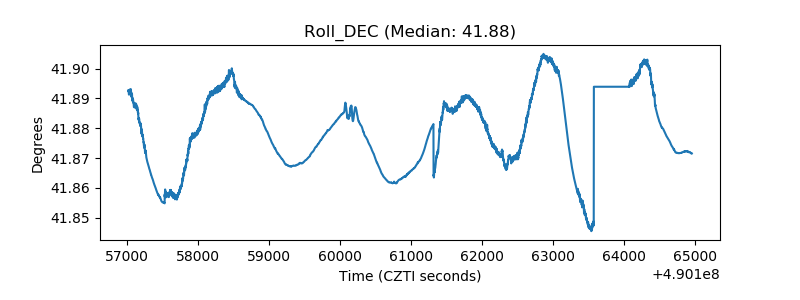 |
| _Roll_RA | 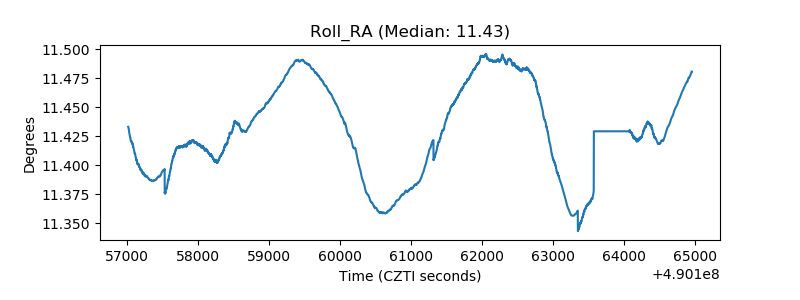 |
| Veto Counter | 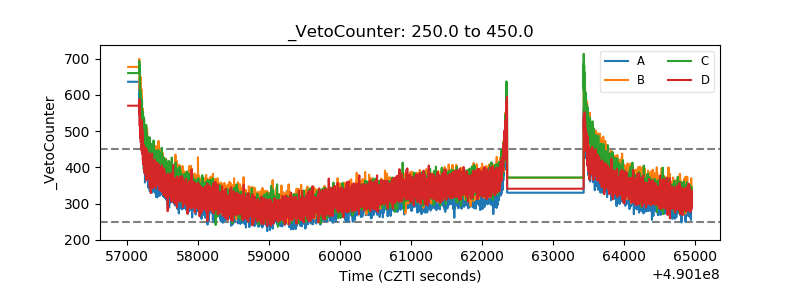 |