| Param | Original file | Final file |
|---|---|---|
| Filename | modeM0/AS1A13_003T01_9000006486_52975cztM0_level2.fits | modeM0/AS1A13_003T01_9000006486_52975cztM0_level2_quad_clean.evt |
| Size (bytes) | 690,243,840 | 67,789,440 |
| Size | 658.3 MB | 64.6 MB |
| Events in quadrant A | 13,410,113 | 45,748 |
| Events in quadrant B | 2,876,244 | 606,208 |
| Events in quadrant C | 4,834,041 | 510,482 |
| Events in quadrant D | 3,990,831 | 492,087 |
| Mode M9 | |||
|---|---|---|---|
| Quadrant | BADHDUFLAG | Total packets | Discarded packets |
| A | 0 | 11 | 0 |
| B | 0 | 11 | 0 |
| C | 0 | 11 | 0 |
| D | 0 | 11 | 0 |
| Mode M0 | |||
|---|---|---|---|
| Quadrant | BADHDUFLAG | Total packets | Discarded packets |
| A | 0 | 43573 | 0 |
| B | 0 | 12690 | 0 |
| C | 0 | 18305 | 0 |
| D | 0 | 15782 | 0 |
| Mode SS | |||
|---|---|---|---|
| Quadrant | BADHDUFLAG | Total packets | Discarded packets |
| A | 0 | 116 | 0 |
| B | 0 | 115 | 0 |
| C | 0 | 118 | 0 |
| D | 0 | 118 | 0 |
| Quadrant | Total seconds | Saturated seconds | Saturation percentage |
|---|---|---|---|
| A | 5575 | 5575 | 100.000000% |
| B | 5691 | 94 | 1.651731% |
| C | 5664 | 508 | 8.968927% |
| D | 5644 | 280 | 4.961021% |
Noise dominated data is calculated using 1-second bins in cleaned event files. If a bin has >2000 counts, and if more than 50% of those come from <1% of pixels, then it is considered to be noise-dominated and hence unusable.
| Quadrant | # 1 sec bins | Bins with >0 counts | Bins with >2000 counts | High rate bins dominated by noise | Noise dominated (total time) | Noise dominated (detector-on time) | Marked lightcurve |
|---|---|---|---|---|---|---|---|
| A | 6823 | 5629 | 5290 | 5290 | 77.53% | 93.98% | 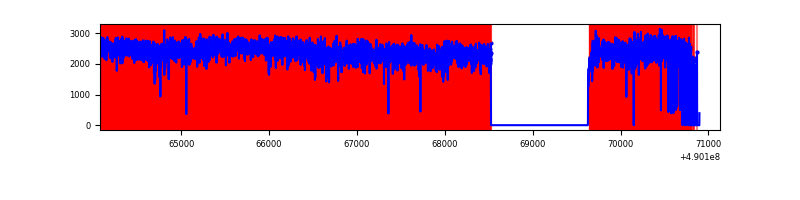 |
| B | 6970 | 5758 | 30 | 30 | 0.43% | 0.52% | 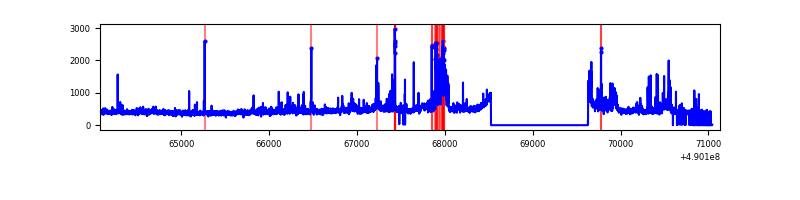 |
| C | 7056 | 5744 | 511 | 511 | 7.24% | 8.90% | 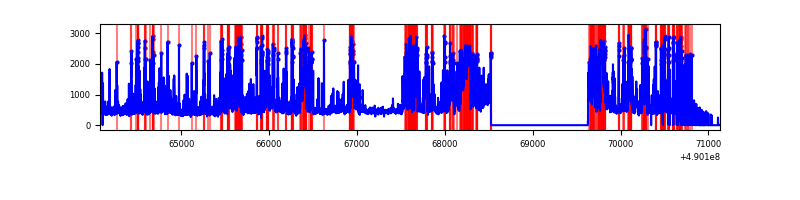 |
| D | 6913 | 5703 | 265 | 265 | 3.83% | 4.65% | 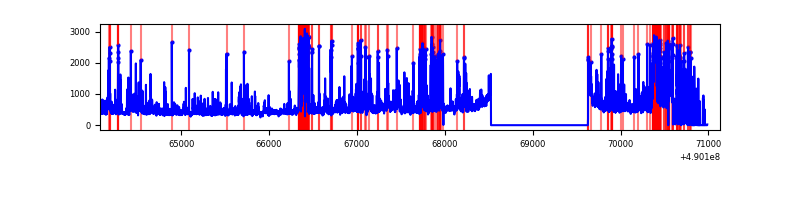 |
Top three noisy pixels from each quadrant. If the there are fewer than three noisy pixels in the level2.evt file, extra rows are filled as -1
| Pixel properties | Quadrant properties | ||||||
|---|---|---|---|---|---|---|---|
| Quadrant | DetID | PixID | Counts | Sigma | Mean | Median | Sigma |
| A | 9 | 191 | 13076156 | 729504.37 | 65 | 63 | 17.9 |
| A | 15 | 174 | 25112 | 1397.46 | 65 | 63 | 17.9 |
| A | 0 | 8 | 24275 | 1350.77 | 65 | 63 | 17.9 |
| B | 0 | 143 | 213723 | 1651.95 | 601 | 581 | 129.0 |
| B | 10 | 247 | 64727 | 497.16 | 601 | 581 | 129.0 |
| B | 7 | 0 | 63197 | 485.3 | 601 | 581 | 129.0 |
| C | 12 | 254 | 1130139 | 7305.2 | 562 | 558 | 154.6 |
| C | 15 | 215 | 329104 | 2124.77 | 562 | 558 | 154.6 |
| C | 4 | 5 | 304858 | 1967.96 | 562 | 558 | 154.6 |
| D | 8 | 176 | 453154 | 2811.46 | 570 | 546 | 161.0 |
| D | 15 | 78 | 379588 | 2354.49 | 570 | 546 | 161.0 |
| D | 1 | 0 | 273390 | 1694.82 | 570 | 546 | 161.0 |
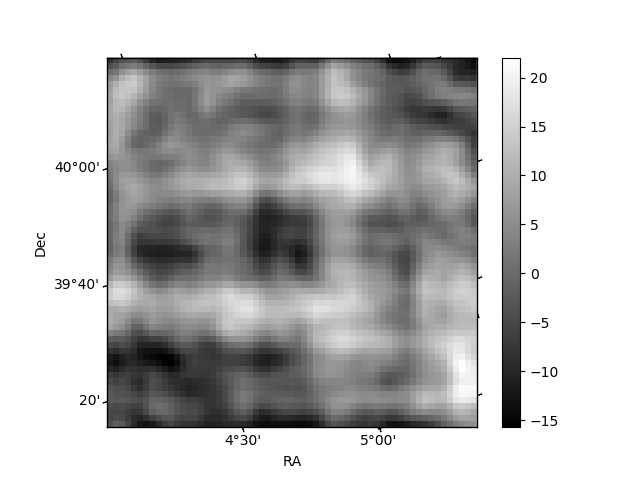
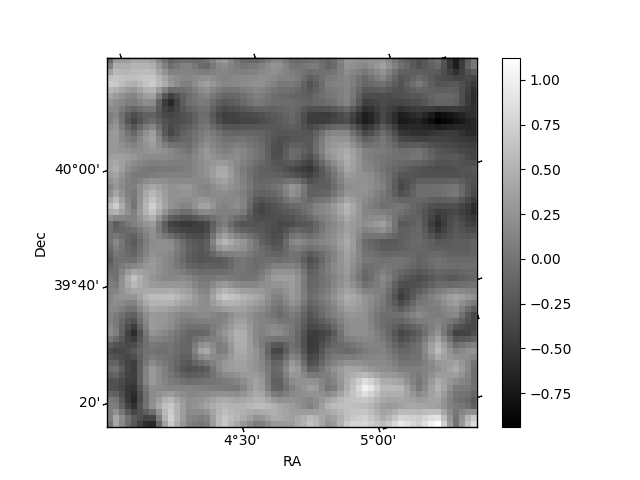
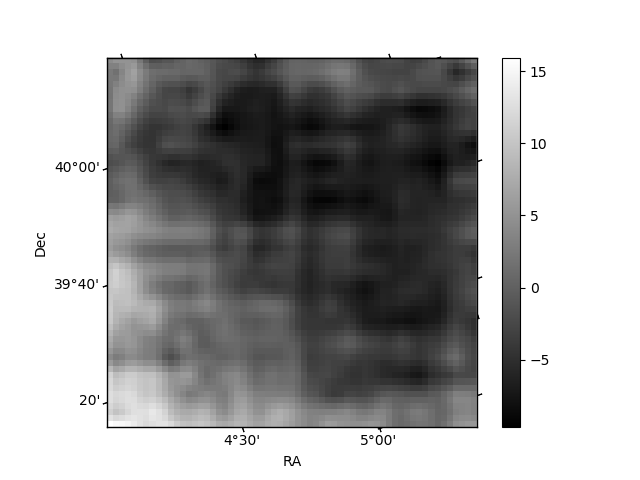
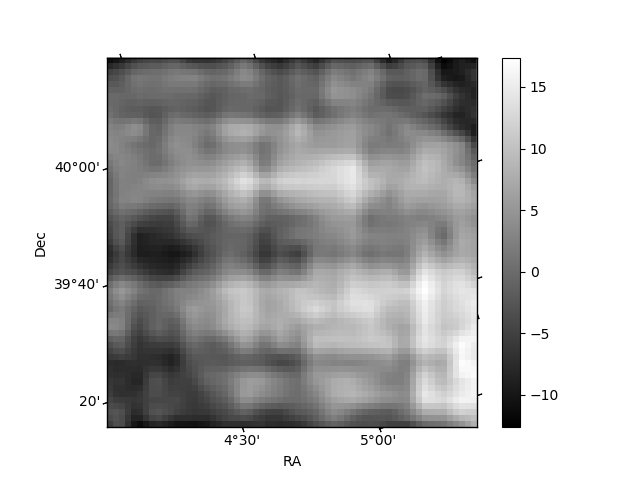
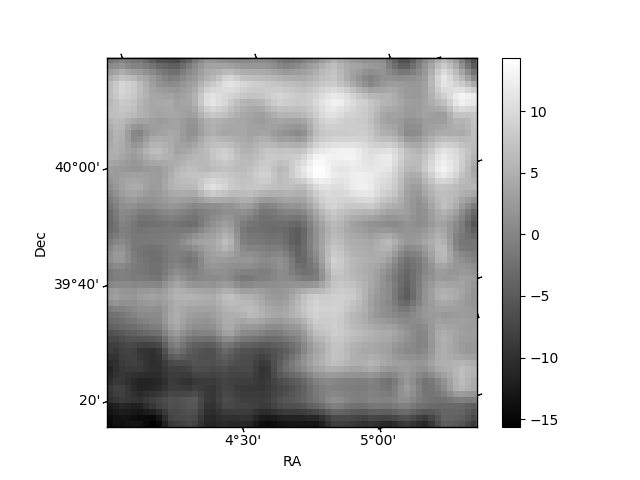
Histogram calculated using DETX and DETY for each event in the final _common_clean file
| Quadrant A | 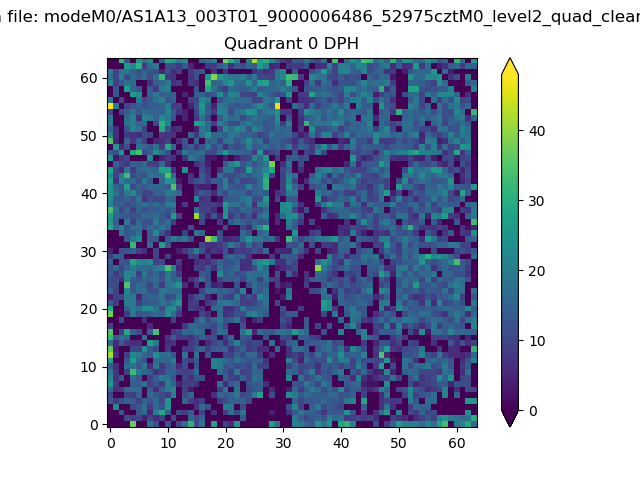 |
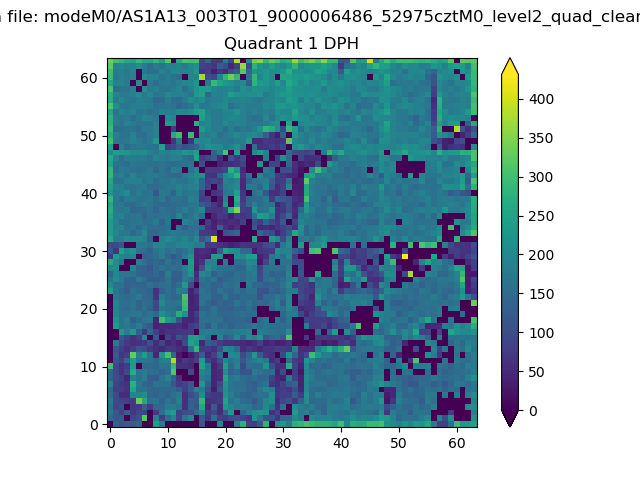 |
Quadrant B |
|---|---|---|---|
| Quadrant D | 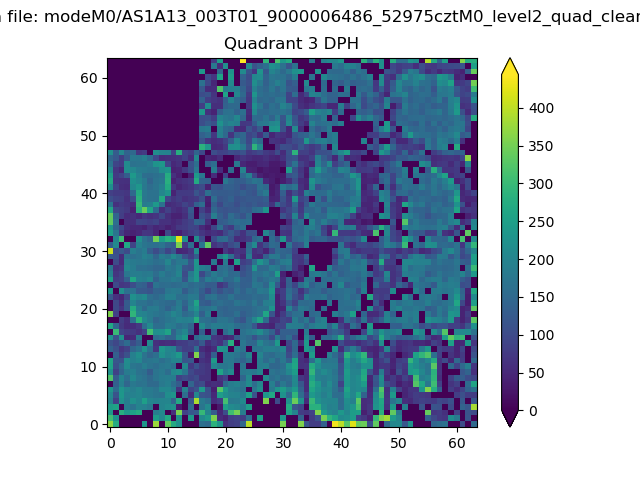 |
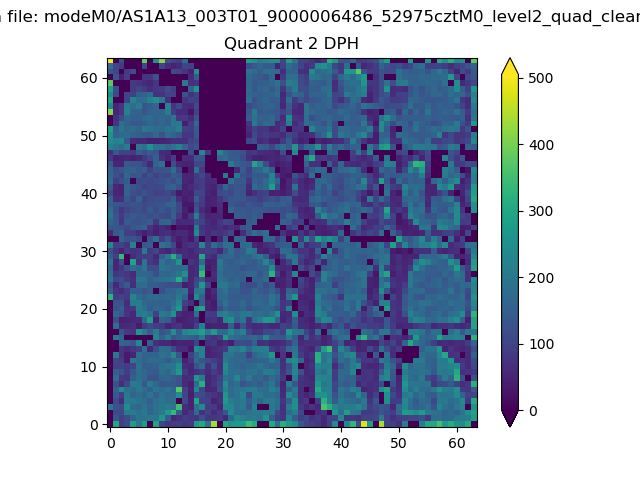 |
Quadrant C |
| Plot type | Count rate plots | Images |
|---|---|---|
| Comparison with Poisson distribution Blue bars denote a histogram of data divided into 1 sec bins. Red curve is a Poisson curve with rate = median count rate of data. |
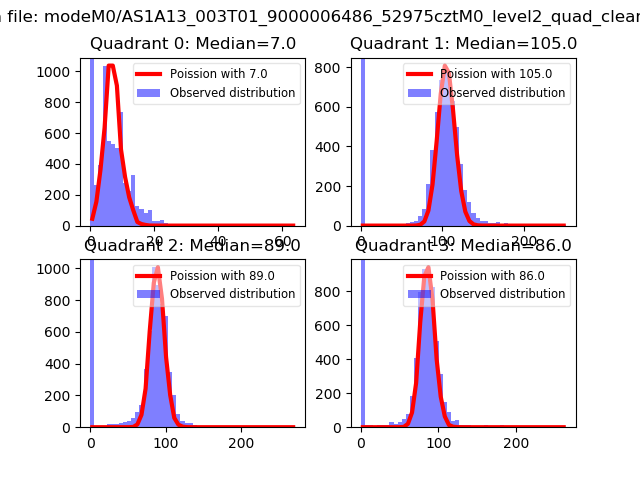 |
 |
| Quadrant-wise count rates Data is divided into 100 sec bins |
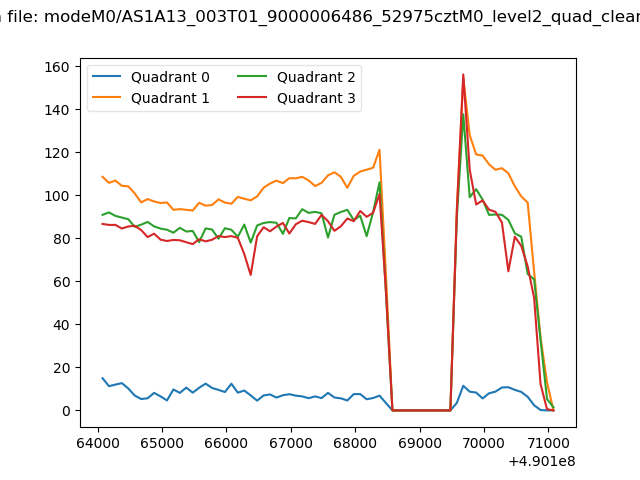 |
|
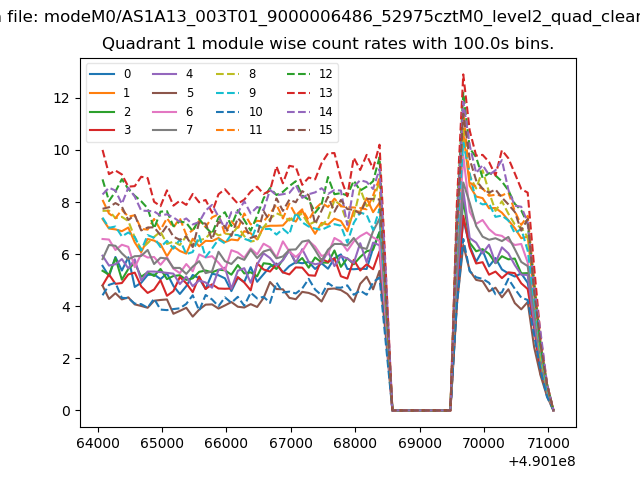
| Module-wise count rates for Quadrant A Data is divided into 100 sec bins |
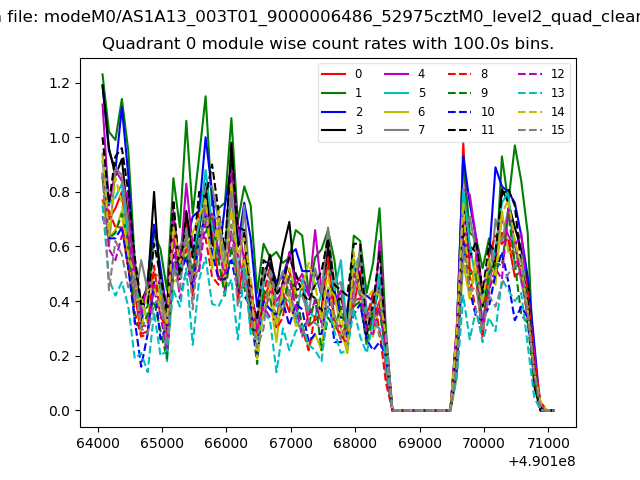 |
 |
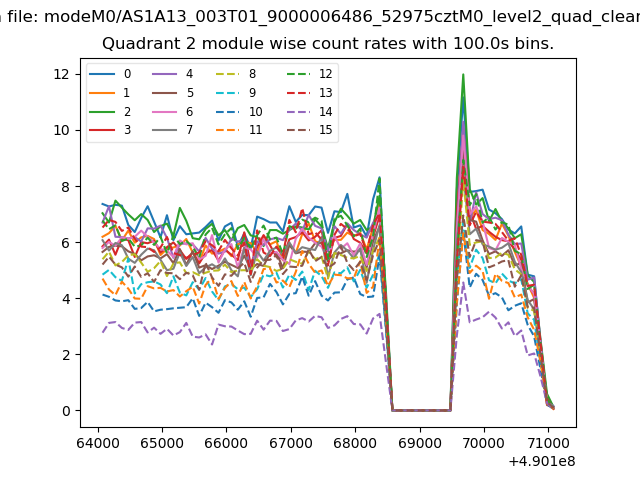
| Module-wise count rates for Quadrant B Data is divided into 100 sec bins |
 |
 |
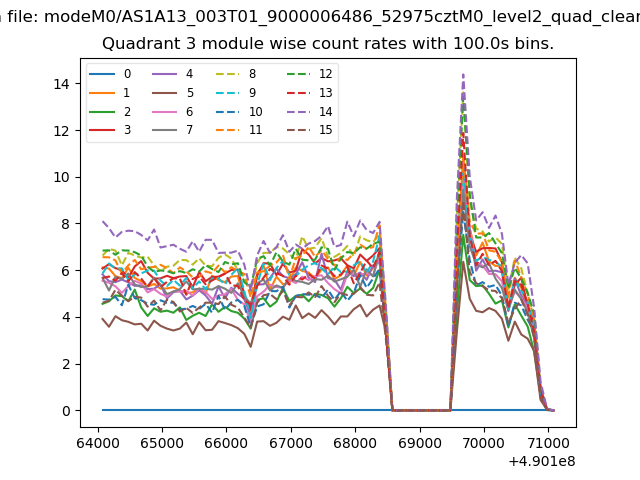
| Module-wise count rates for Quadrant C Data is divided into 100 sec bins |
 |
 |
| Module-wise count rates for Quadrant D Data is divided into 100 sec bins |
 |
 |
| Parameter | Plot |
|---|---|
| CZT HV Monitor | 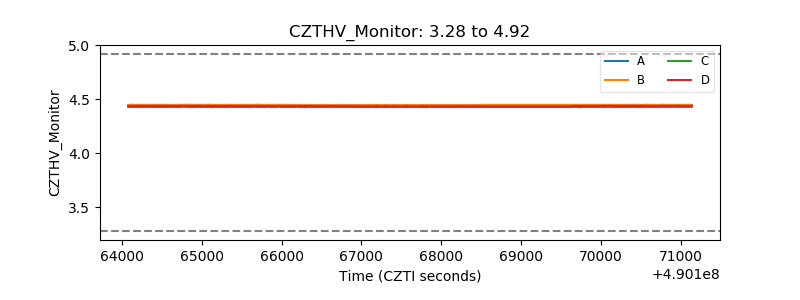 |
| D_VDD |  |
| Temperature 1 | 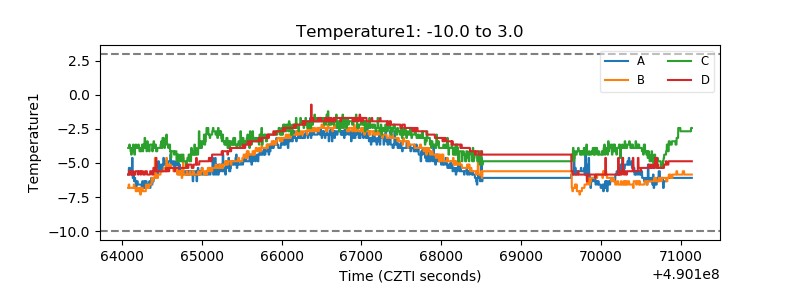 |
| Veto HV Monitor | 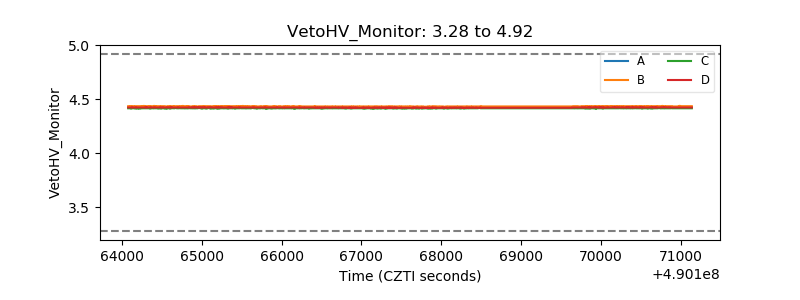 |
| Veto LLD | 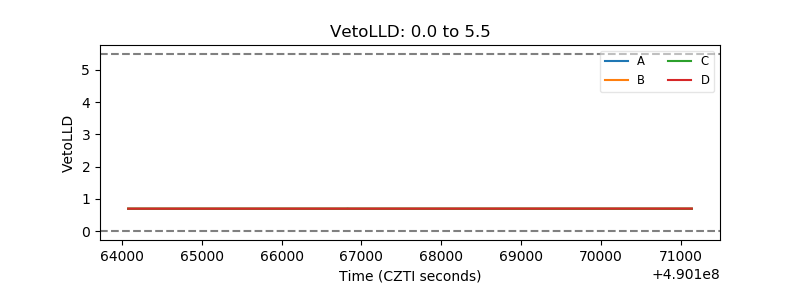 |
| Alpha Counter | 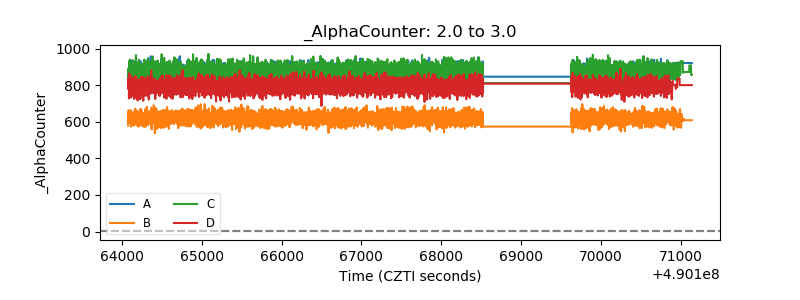 |
| _CPM_Rate | 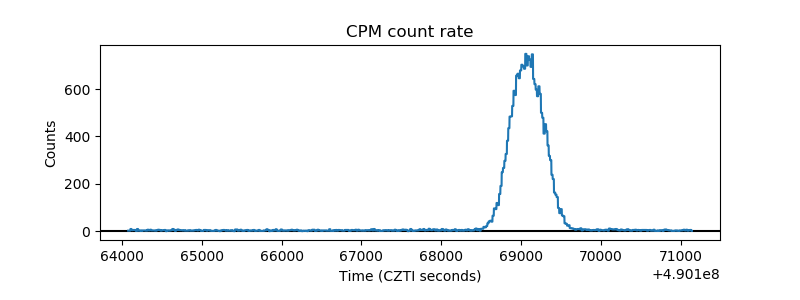 |
| CZT Counter | 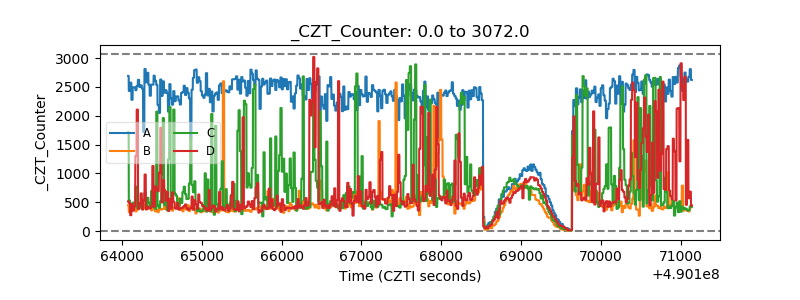 |
| +2.5 Volts monitor | 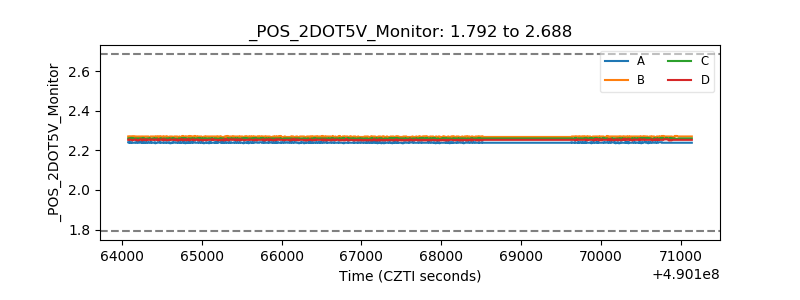 |
| +5 Volts monitor | 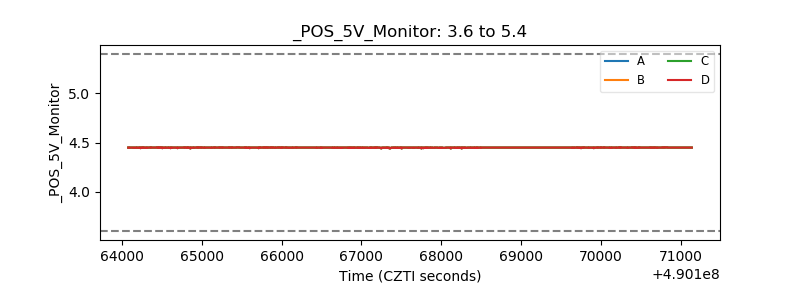 |
| _ROLL_ROT | 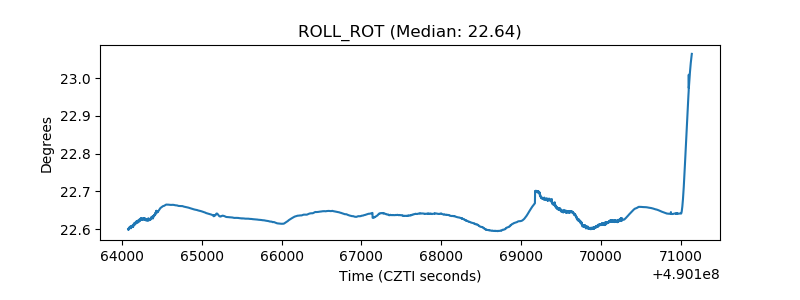 |
| _Roll_DEC | 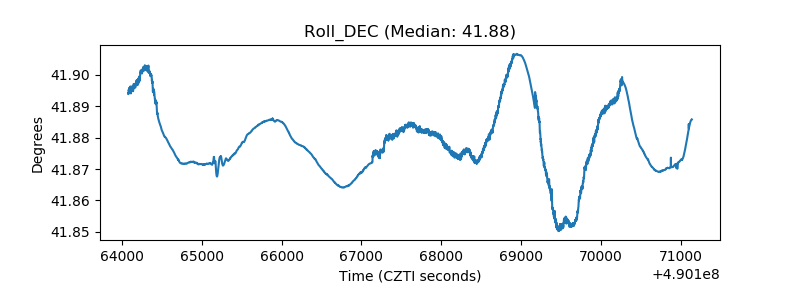 |
| _Roll_RA | 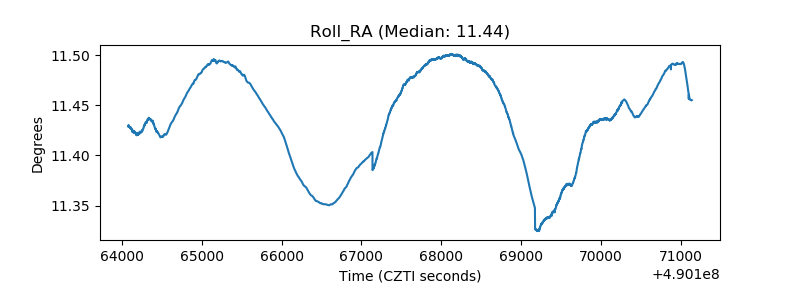 |
| Veto Counter | 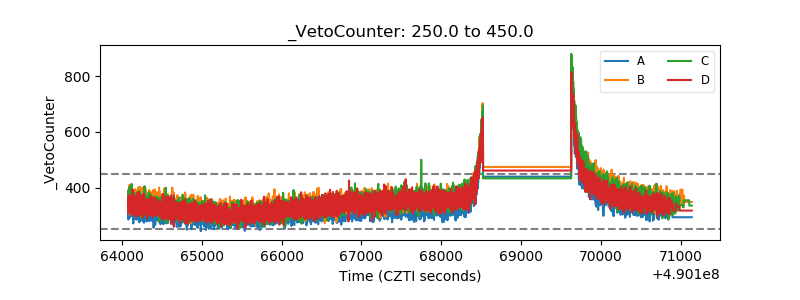 |