| Param | Original file | Final file |
|---|---|---|
| Filename | modeM0/AS1A13_003T01_9000006486_52976cztM0_level2.fits | modeM0/AS1A13_003T01_9000006486_52976cztM0_level2_quad_clean.evt |
| Size (bytes) | 1,417,415,040 | 122,457,600 |
| Size | 1.3 GB | 116.8 MB |
| Events in quadrant A | 25,056,307 | 92,371 |
| Events in quadrant B | 5,254,336 | 1,113,450 |
| Events in quadrant C | 10,791,305 | 896,096 |
| Events in quadrant D | 10,553,448 | 871,683 |
| Mode M9 | |||
|---|---|---|---|
| Quadrant | BADHDUFLAG | Total packets | Discarded packets |
| A | 0 | 22 | 0 |
| B | 0 | 22 | 0 |
| C | 0 | 22 | 0 |
| D | 0 | 22 | 0 |
| Mode M0 | |||
|---|---|---|---|
| Quadrant | BADHDUFLAG | Total packets | Discarded packets |
| A | 0 | 81512 | 0 |
| B | 0 | 23174 | 0 |
| C | 0 | 39452 | 0 |
| D | 0 | 38625 | 0 |
| Mode SS | |||
|---|---|---|---|
| Quadrant | BADHDUFLAG | Total packets | Discarded packets |
| A | 0 | 216 | 0 |
| B | 0 | 216 | 0 |
| C | 0 | 216 | 0 |
| D | 0 | 216 | 0 |
| Quadrant | Total seconds | Saturated seconds | Saturation percentage |
|---|---|---|---|
| A | 10502 | 10502 | 100.000000% |
| B | 10502 | 173 | 1.647305% |
| C | 10502 | 1785 | 16.996763% |
| D | 10502 | 1358 | 12.930870% |
Noise dominated data is calculated using 1-second bins in cleaned event files. If a bin has >2000 counts, and if more than 50% of those come from <1% of pixels, then it is considered to be noise-dominated and hence unusable.
| Quadrant | # 1 sec bins | Bins with >0 counts | Bins with >2000 counts | High rate bins dominated by noise | Noise dominated (total time) | Noise dominated (detector-on time) | Marked lightcurve |
|---|---|---|---|---|---|---|---|
| A | 12742 | 10504 | 9805 | 9805 | 76.95% | 93.35% | 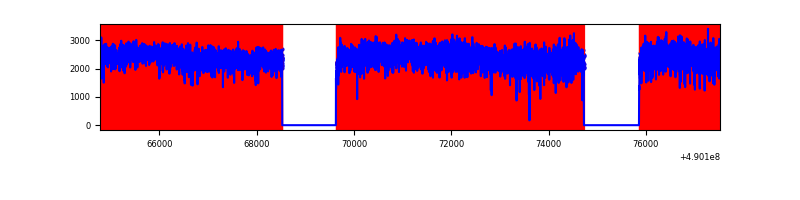 |
| B | 12742 | 10504 | 36 | 36 | 0.28% | 0.34% | 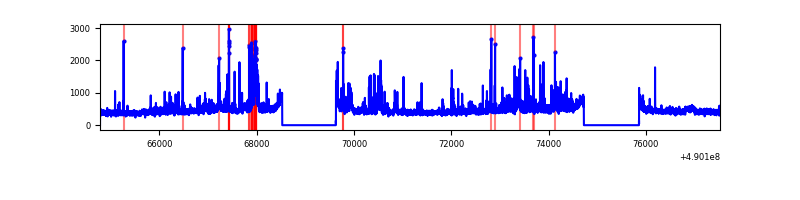 |
| C | 12742 | 10504 | 1734 | 1734 | 13.61% | 16.51% | 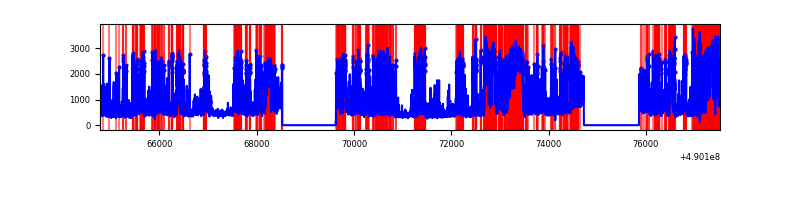 |
| D | 12742 | 10504 | 1354 | 1354 | 10.63% | 12.89% | 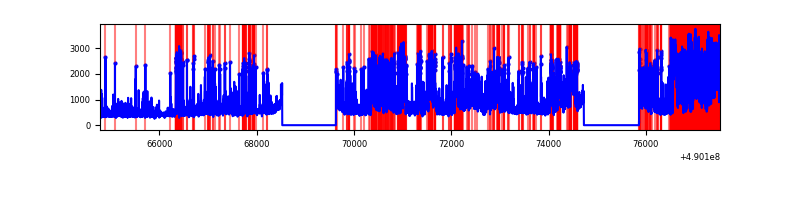 |
Top three noisy pixels from each quadrant. If the there are fewer than three noisy pixels in the level2.evt file, extra rows are filled as -1
| Pixel properties | Quadrant properties | ||||||
|---|---|---|---|---|---|---|---|
| Quadrant | DetID | PixID | Counts | Sigma | Mean | Median | Sigma |
| A | 9 | 191 | 24347876 | 728219.41 | 128 | 124 | 33.4 |
| A | 0 | 8 | 83634 | 2497.71 | 128 | 124 | 33.4 |
| A | 15 | 174 | 57405 | 1713.22 | 128 | 124 | 33.4 |
| B | 0 | 143 | 236277 | 984.47 | 1127 | 1086 | 238.9 |
| B | 10 | 128 | 170925 | 710.92 | 1127 | 1086 | 238.9 |
| B | 10 | 247 | 77910 | 321.57 | 1127 | 1086 | 238.9 |
| C | 12 | 254 | 1957772 | 7060.04 | 1011 | 1002 | 277.2 |
| C | 15 | 215 | 1801160 | 6494.98 | 1011 | 1002 | 277.2 |
| C | 7 | 80 | 853357 | 3075.3 | 1011 | 1002 | 277.2 |
| D | 8 | 176 | 2317020 | 7907.02 | 1042 | 997 | 292.9 |
| D | 2 | 62 | 1636622 | 5584.11 | 1042 | 997 | 292.9 |
| D | 15 | 78 | 484378 | 1650.29 | 1042 | 997 | 292.9 |
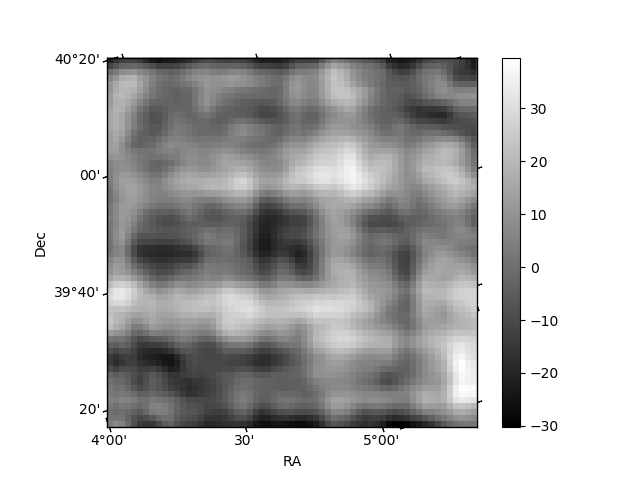
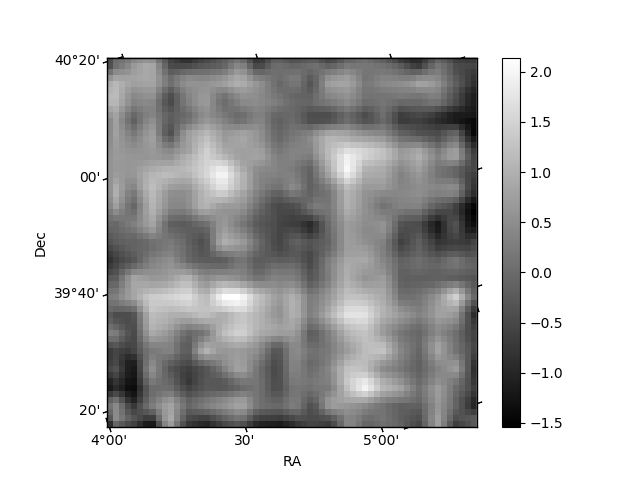
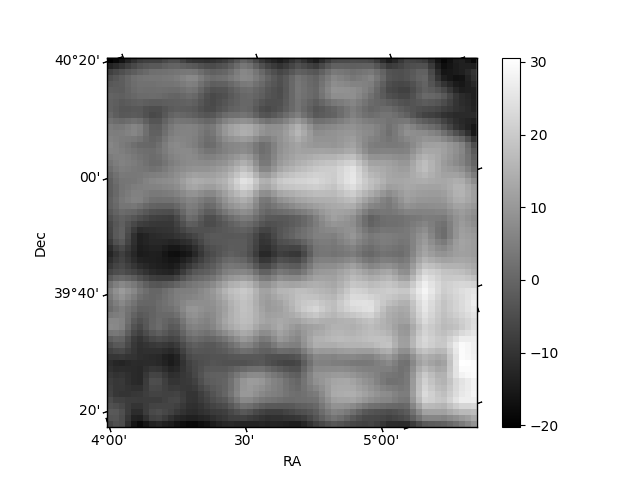
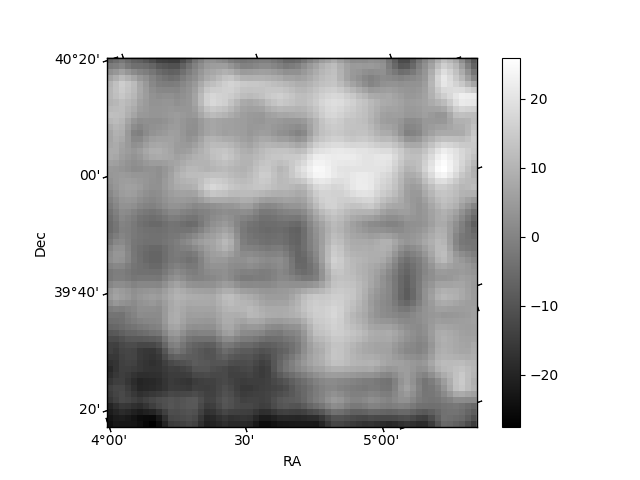
Histogram calculated using DETX and DETY for each event in the final _common_clean file
| Quadrant A | 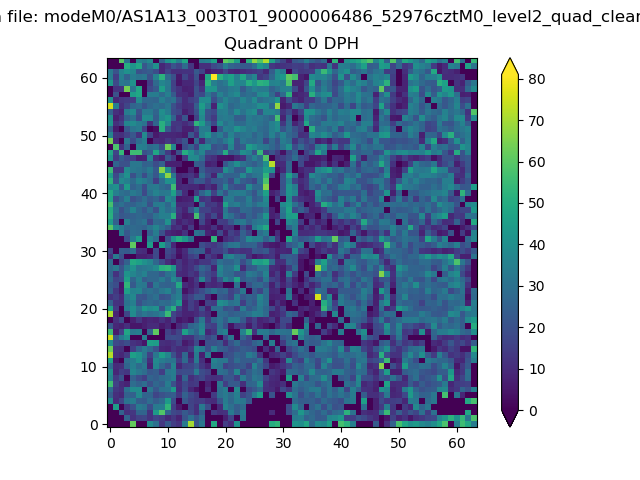 |
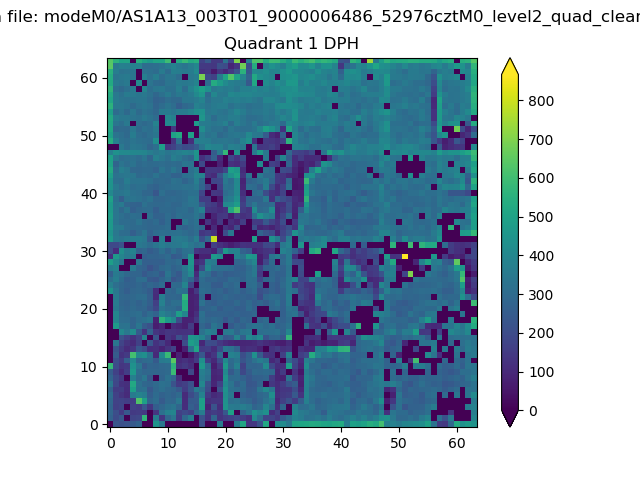 |
Quadrant B |
|---|---|---|---|
| Quadrant D | 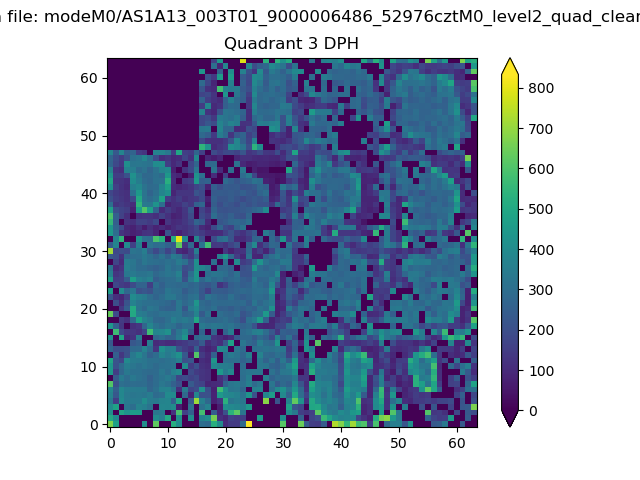 |
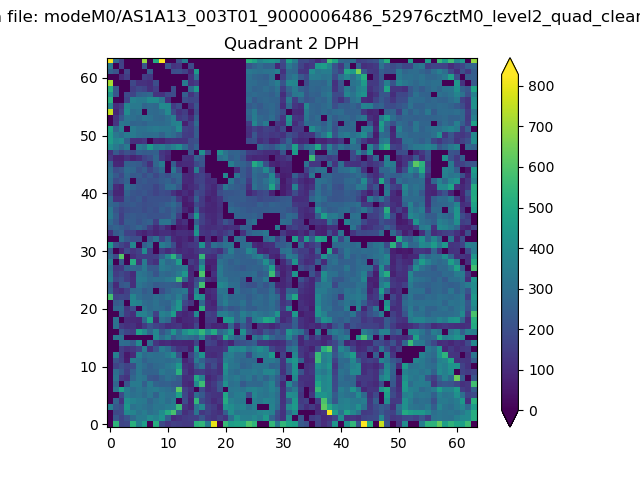 |
Quadrant C |
| Plot type | Count rate plots | Images |
|---|---|---|
| Comparison with Poisson distribution Blue bars denote a histogram of data divided into 1 sec bins. Red curve is a Poisson curve with rate = median count rate of data. |
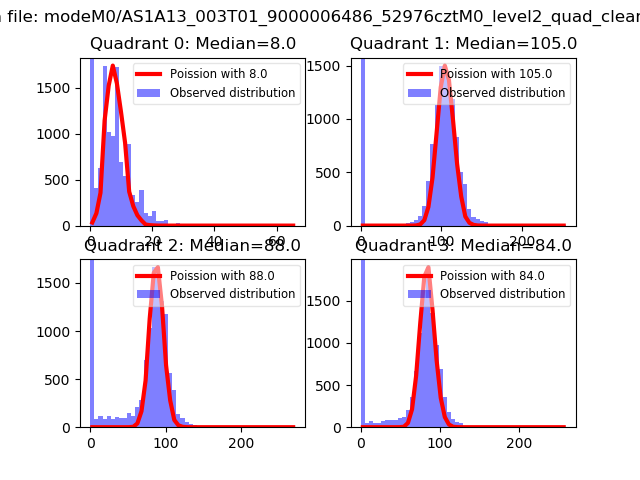 |
 |
| Quadrant-wise count rates Data is divided into 100 sec bins |
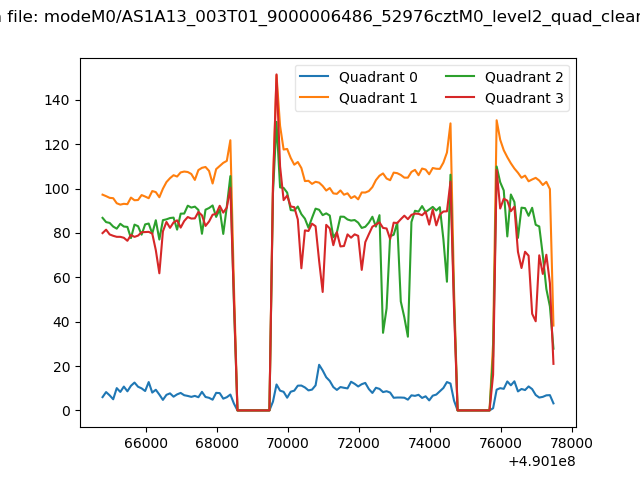 |
|
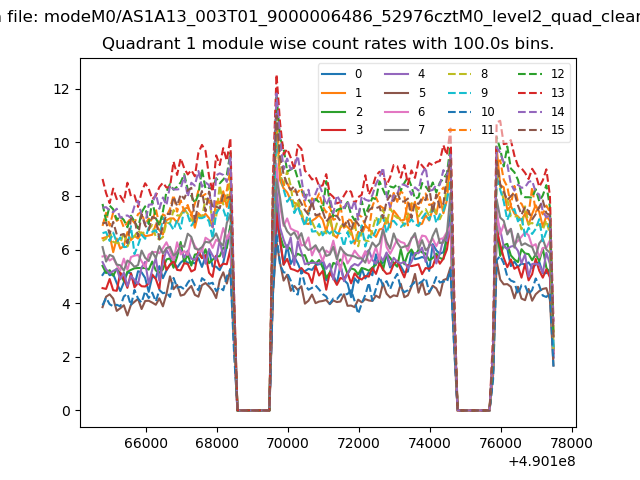
| Module-wise count rates for Quadrant A Data is divided into 100 sec bins |
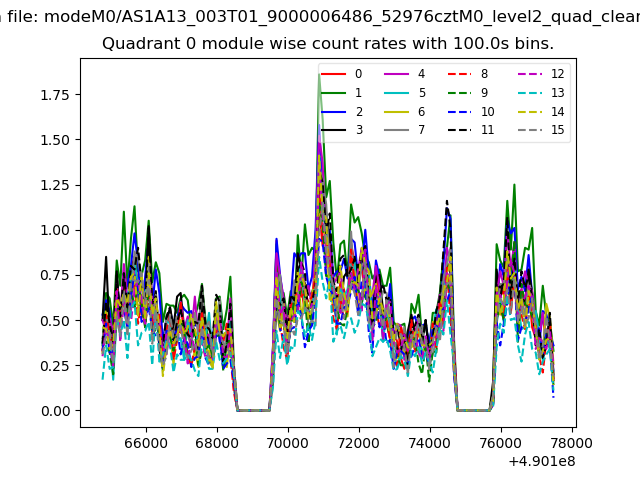 |
 |
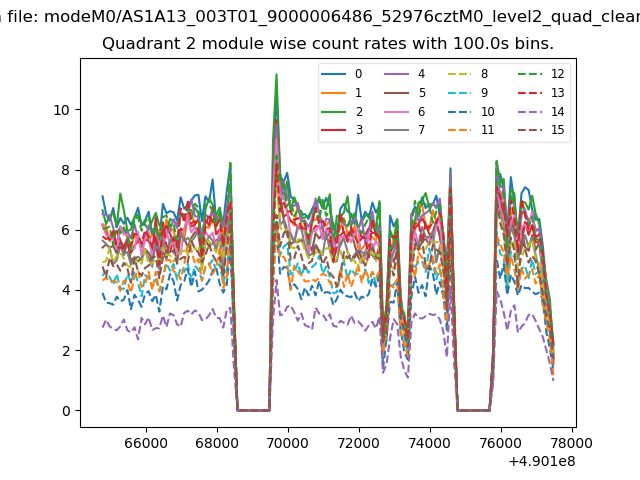
| Module-wise count rates for Quadrant B Data is divided into 100 sec bins |
 |
 |
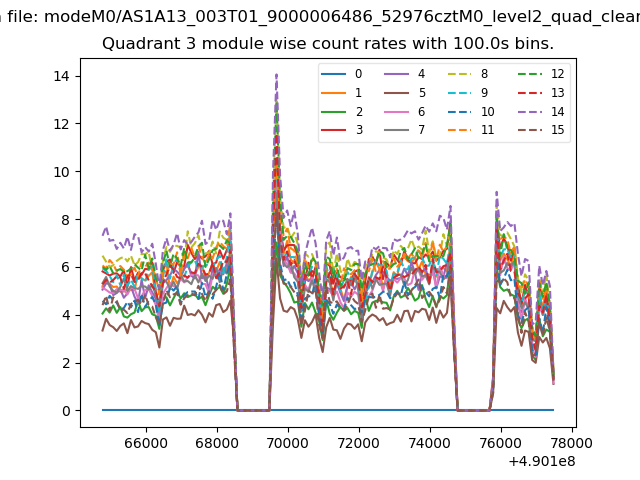
| Module-wise count rates for Quadrant C Data is divided into 100 sec bins |
 |
 |
| Module-wise count rates for Quadrant D Data is divided into 100 sec bins |
 |
 |
| Parameter | Plot |
|---|---|
| CZT HV Monitor | 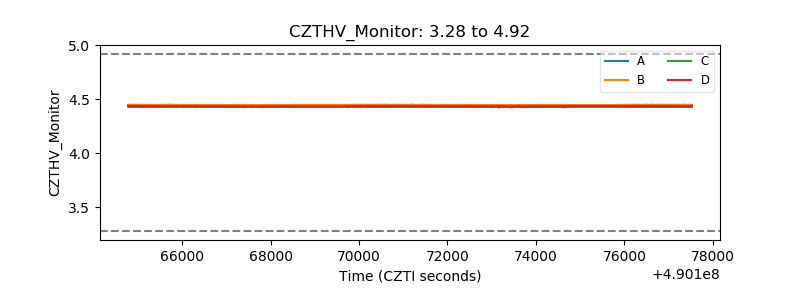 |
| D_VDD | 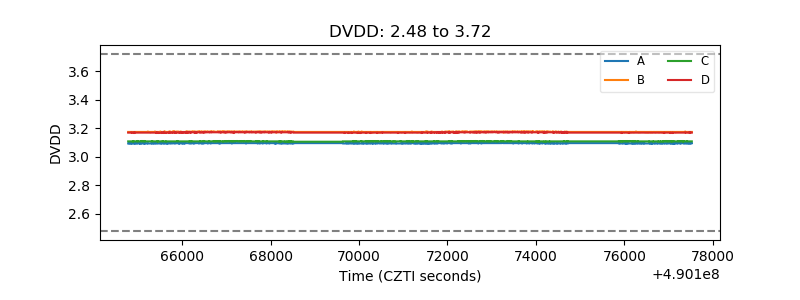 |
| Temperature 1 | 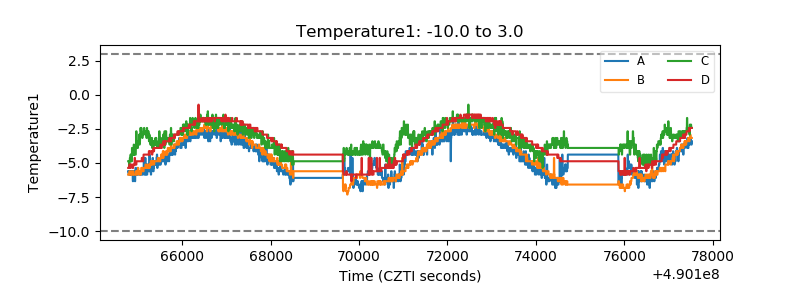 |
| Veto HV Monitor | 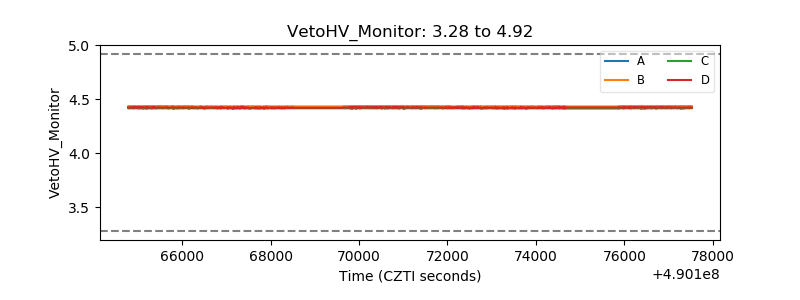 |
| Veto LLD | 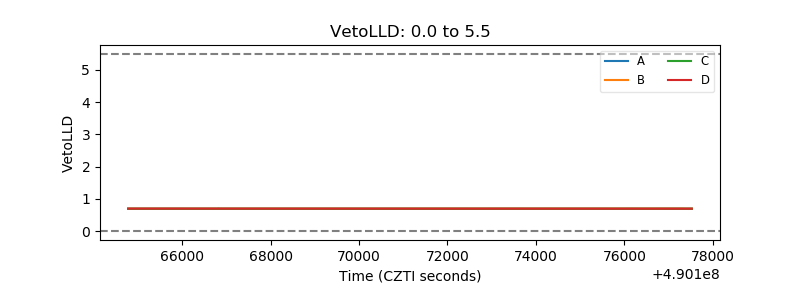 |
| Alpha Counter | 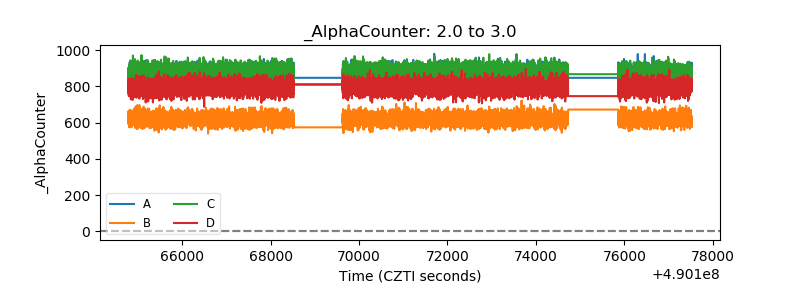 |
| _CPM_Rate | 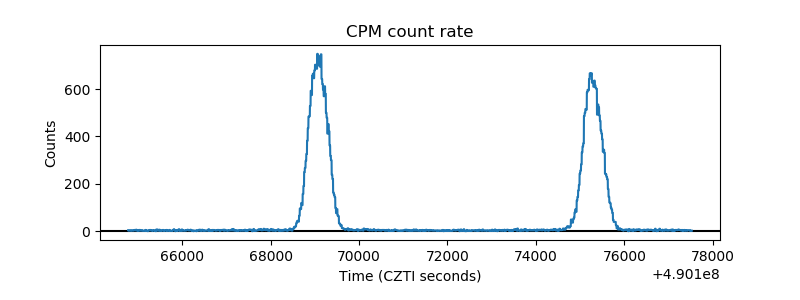 |
| CZT Counter | 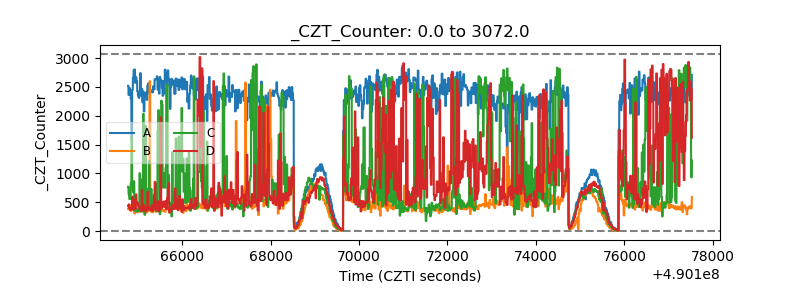 |
| +2.5 Volts monitor | 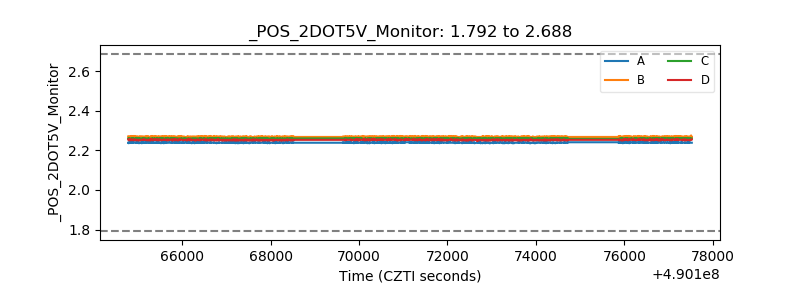 |
| +5 Volts monitor | 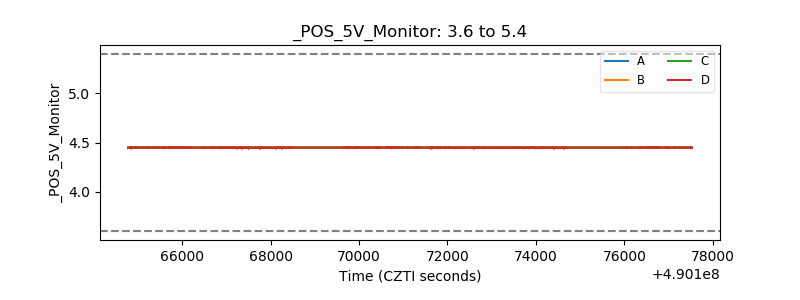 |
| _ROLL_ROT | 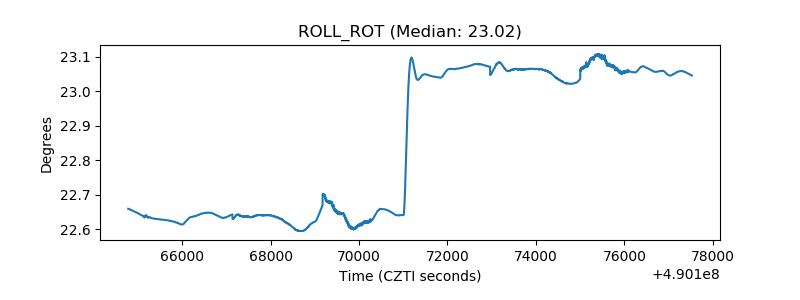 |
| _Roll_DEC | 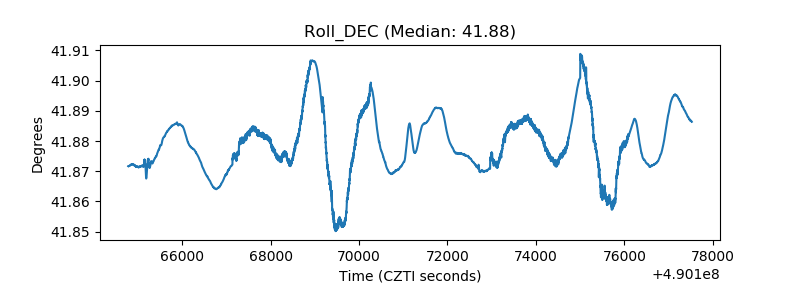 |
| _Roll_RA | 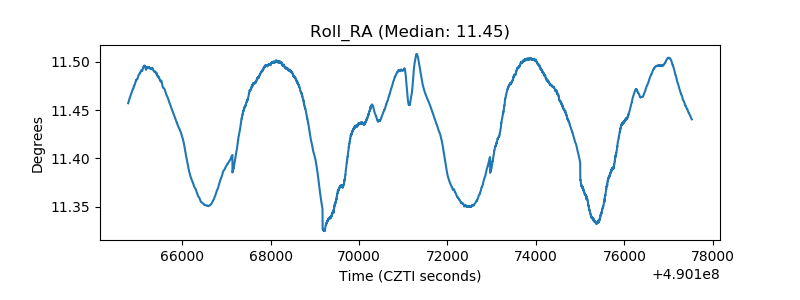 |
| Veto Counter | 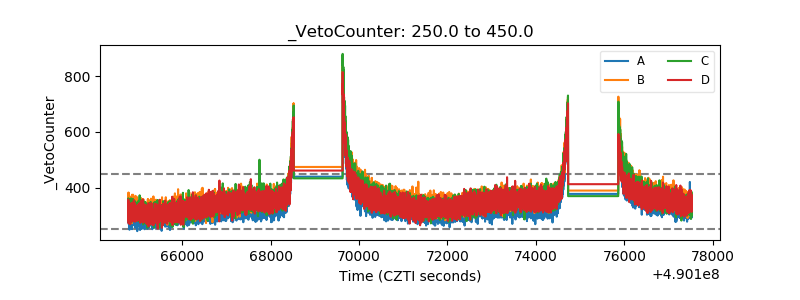 |