| Param | Original file | Final file |
|---|---|---|
| Filename | modeM0/AS1A13_003T01_9000006486_52977cztM0_level2.fits | modeM0/AS1A13_003T01_9000006486_52977cztM0_level2_quad_clean.evt |
| Size (bytes) | 986,365,440 | 64,661,760 |
| Size | 940.7 MB | 61.7 MB |
| Events in quadrant A | 14,182,667 | 54,746 |
| Events in quadrant B | 2,767,460 | 629,853 |
| Events in quadrant C | 8,972,658 | 444,355 |
| Events in quadrant D | 10,133,701 | 411,907 |
| Mode M9 | |||
|---|---|---|---|
| Quadrant | BADHDUFLAG | Total packets | Discarded packets |
| A | 0 | 11 | 0 |
| B | 0 | 11 | 0 |
| C | 0 | 11 | 0 |
| D | 0 | 11 | 0 |
| Mode M0 | |||
|---|---|---|---|
| Quadrant | BADHDUFLAG | Total packets | Discarded packets |
| A | 0 | 46058 | 0 |
| B | 0 | 12430 | 0 |
| C | 0 | 30738 | 0 |
| D | 0 | 34226 | 0 |
| Mode SS | |||
|---|---|---|---|
| Quadrant | BADHDUFLAG | Total packets | Discarded packets |
| A | 0 | 120 | 0 |
| B | 0 | 120 | 0 |
| C | 0 | 120 | 0 |
| D | 0 | 120 | 0 |
| Quadrant | Total seconds | Saturated seconds | Saturation percentage |
|---|---|---|---|
| A | 5898 | 5898 | 100.000000% |
| B | 5898 | 102 | 1.729400% |
| C | 5898 | 2259 | 38.301119% |
| D | 5898 | 2292 | 38.860631% |
Noise dominated data is calculated using 1-second bins in cleaned event files. If a bin has >2000 counts, and if more than 50% of those come from <1% of pixels, then it is considered to be noise-dominated and hence unusable.
| Quadrant | # 1 sec bins | Bins with >0 counts | Bins with >2000 counts | High rate bins dominated by noise | Noise dominated (total time) | Noise dominated (detector-on time) | Marked lightcurve |
|---|---|---|---|---|---|---|---|
| A | 7028 | 5899 | 5412 | 5412 | 77.01% | 91.74% | 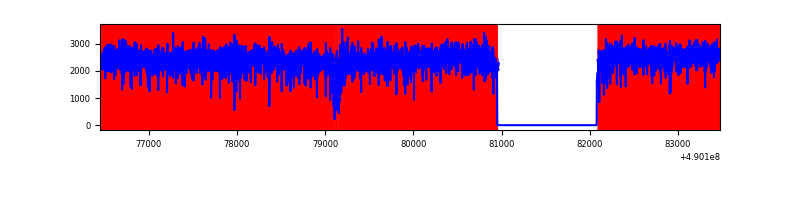 |
| B | 7028 | 5899 | 12 | 12 | 0.17% | 0.20% | 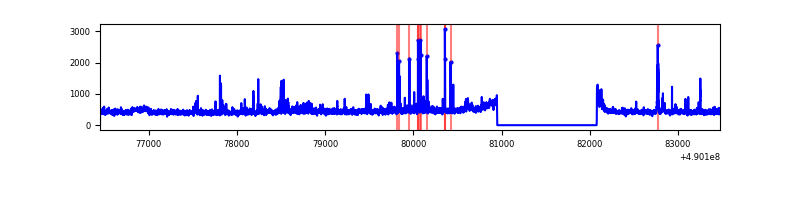 |
| C | 7028 | 5899 | 2015 | 2015 | 28.67% | 34.16% | 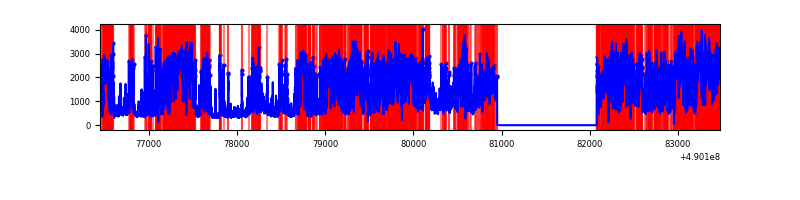 |
| D | 7028 | 5899 | 2300 | 2300 | 32.73% | 38.99% | 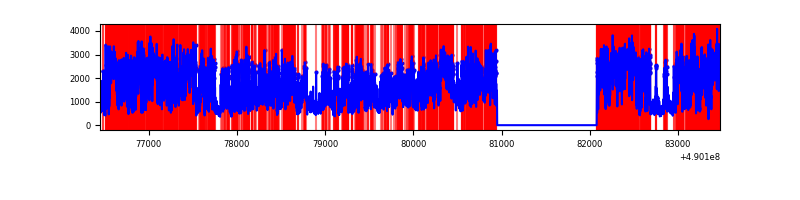 |
Top three noisy pixels from each quadrant. If the there are fewer than three noisy pixels in the level2.evt file, extra rows are filled as -1
| Pixel properties | Quadrant properties | ||||||
|---|---|---|---|---|---|---|---|
| Quadrant | DetID | PixID | Counts | Sigma | Mean | Median | Sigma |
| A | 9 | 191 | 13770710 | 662552.84 | 76 | 74 | 20.8 |
| A | 0 | 8 | 46609 | 2238.96 | 76 | 74 | 20.8 |
| A | 7 | 206 | 27666 | 1327.55 | 76 | 74 | 20.8 |
| B | 4 | 81 | 36367 | 261.92 | 636 | 614 | 136.5 |
| B | 0 | 143 | 35236 | 253.63 | 636 | 614 | 136.5 |
| B | 5 | 185 | 27241 | 195.06 | 636 | 614 | 136.5 |
| C | 7 | 80 | 2679746 | 19580.24 | 500 | 495 | 136.8 |
| C | 12 | 254 | 2154552 | 15742.07 | 500 | 495 | 136.8 |
| C | 15 | 215 | 758117 | 5536.78 | 500 | 495 | 136.8 |
| D | 8 | 176 | 4247342 | 29683.79 | 497 | 473 | 143.1 |
| D | 2 | 62 | 2042184 | 14270.68 | 497 | 473 | 143.1 |
| D | 2 | 172 | 460274 | 3213.81 | 497 | 473 | 143.1 |
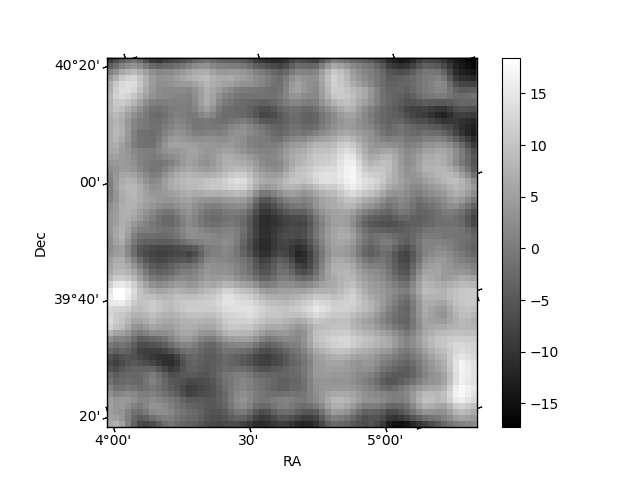
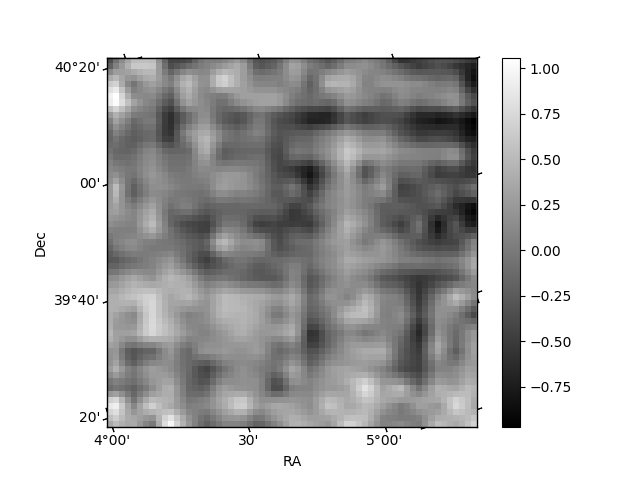
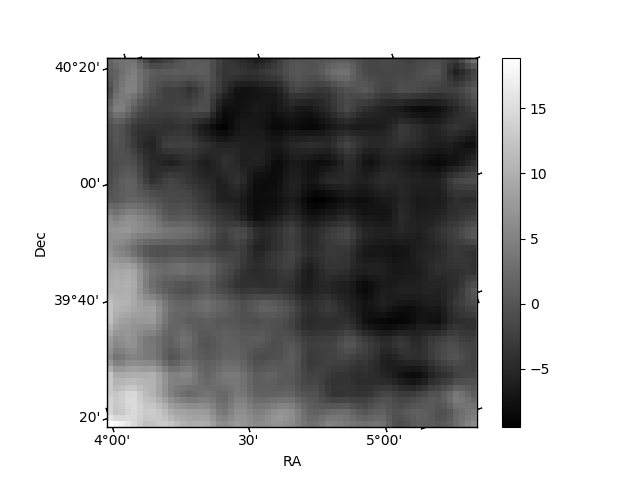
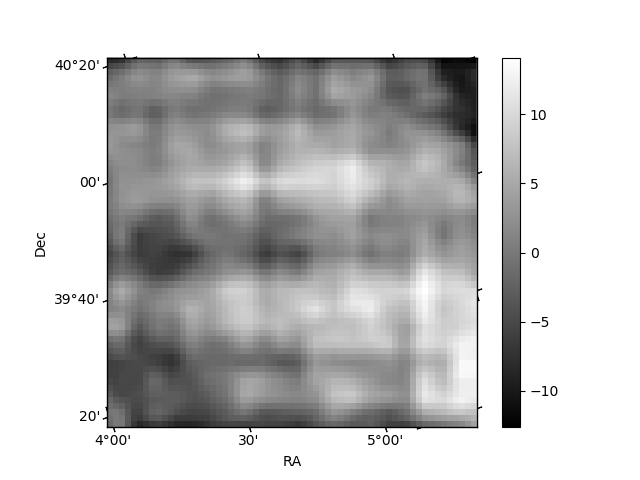
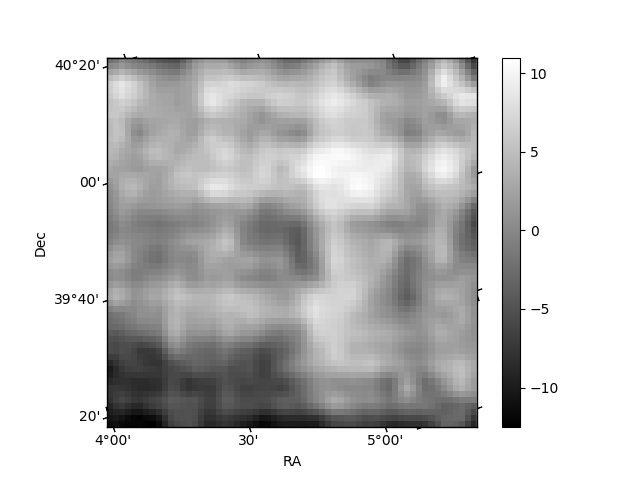
Histogram calculated using DETX and DETY for each event in the final _common_clean file
| Quadrant A | 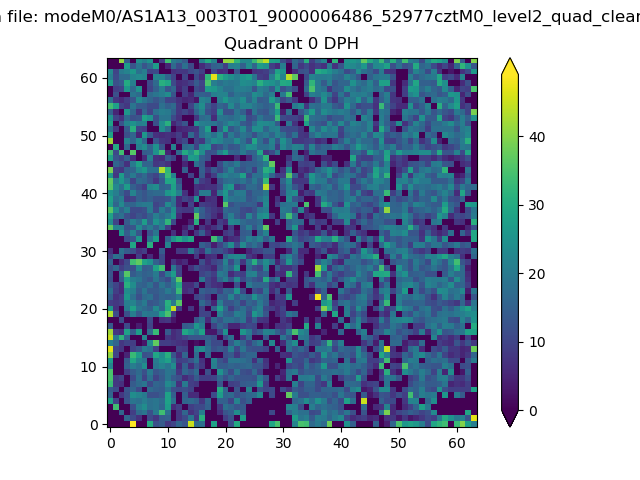 |
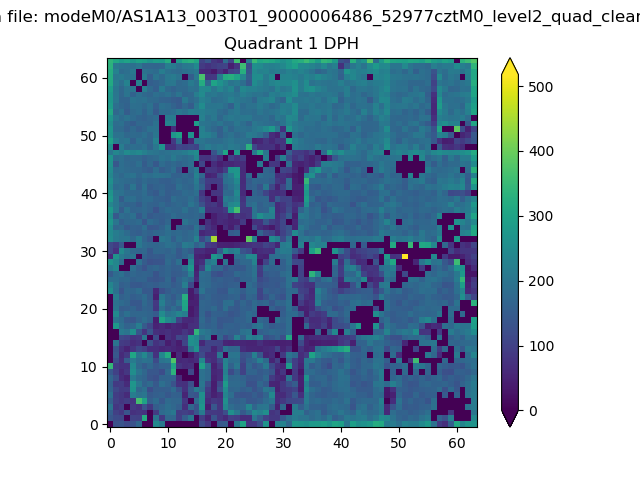 |
Quadrant B |
|---|---|---|---|
| Quadrant D | 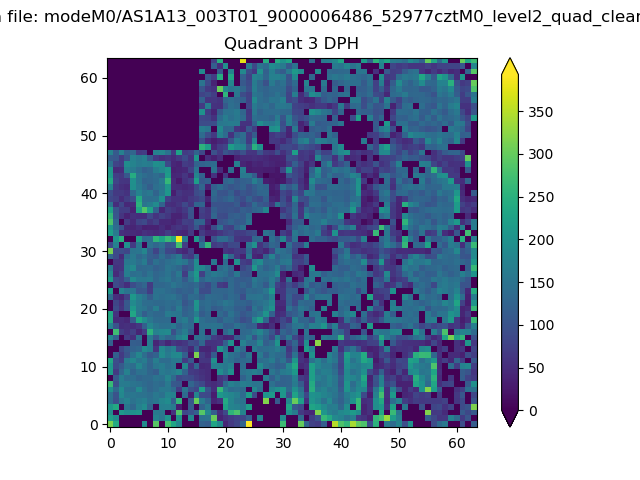 |
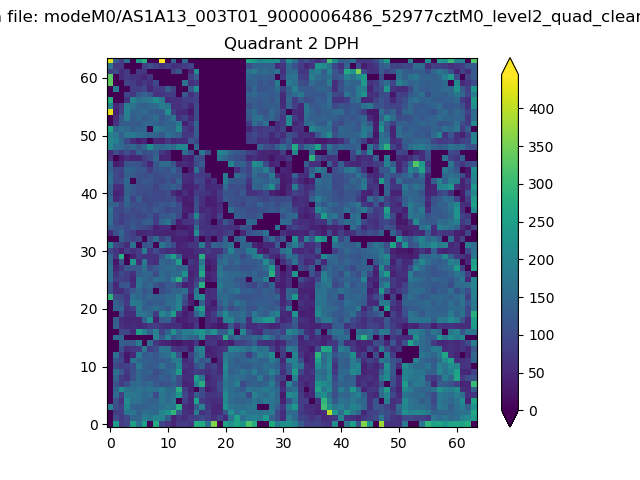 |
Quadrant C |
| Plot type | Count rate plots | Images |
|---|---|---|
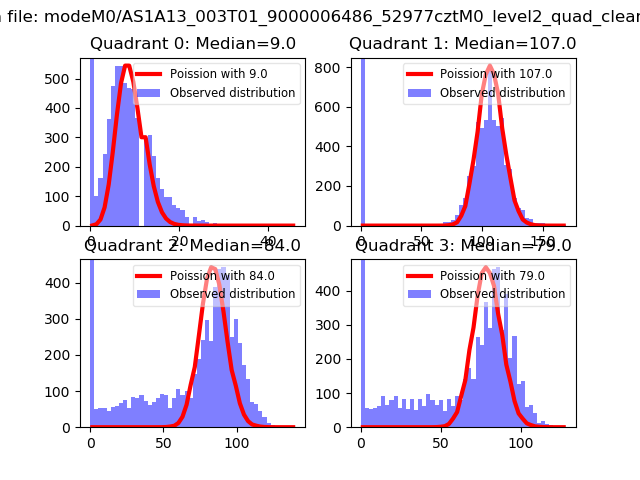
| Comparison with Poisson distribution Blue bars denote a histogram of data divided into 1 sec bins. Red curve is a Poisson curve with rate = median count rate of data. |
 |
 |
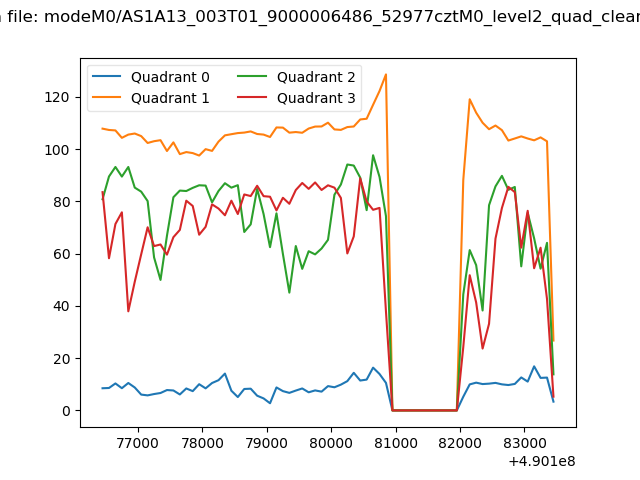
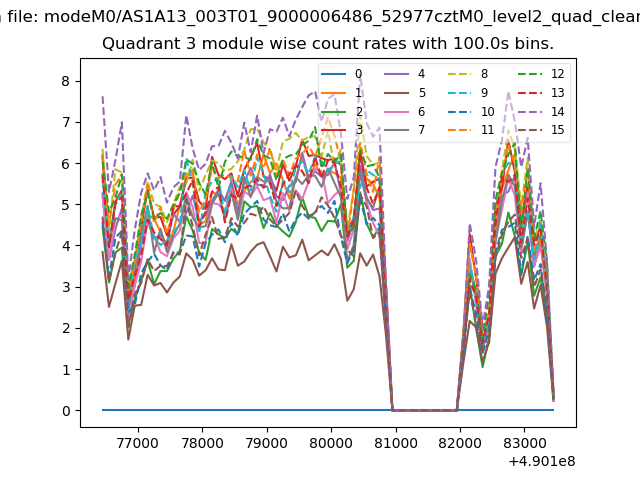
| Quadrant-wise count rates Data is divided into 100 sec bins |
 |
|
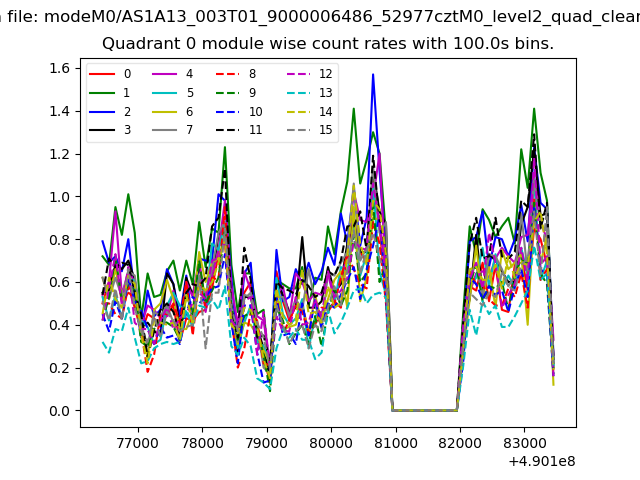
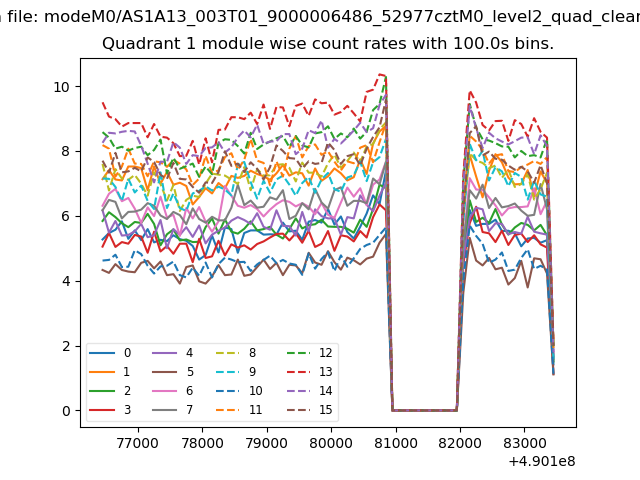
| Module-wise count rates for Quadrant A Data is divided into 100 sec bins |
 |
 |
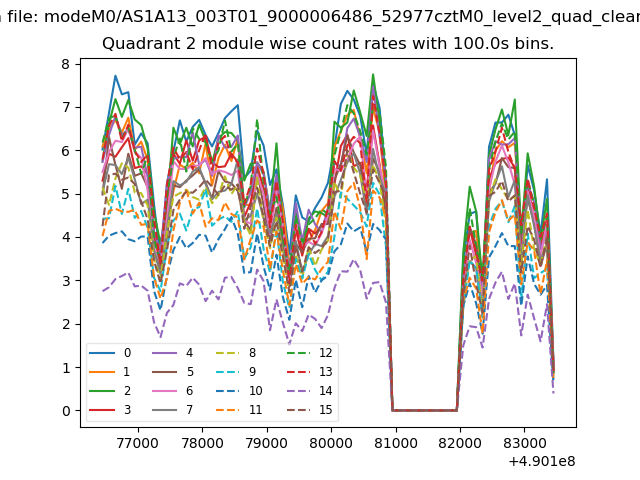
| Module-wise count rates for Quadrant B Data is divided into 100 sec bins |
 |
 |
| Module-wise count rates for Quadrant C Data is divided into 100 sec bins |
 |
 |
| Module-wise count rates for Quadrant D Data is divided into 100 sec bins |
 |
 |
| Parameter | Plot |
|---|---|
| CZT HV Monitor | 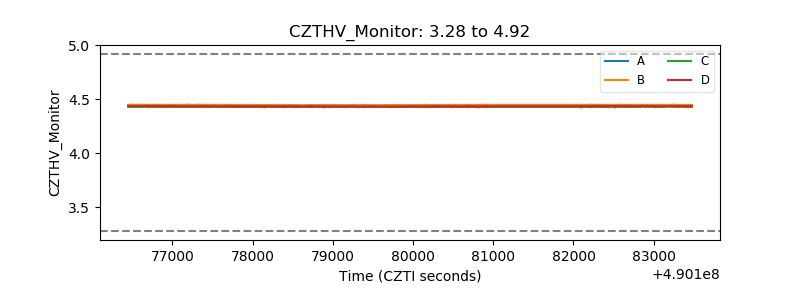 |
| D_VDD | 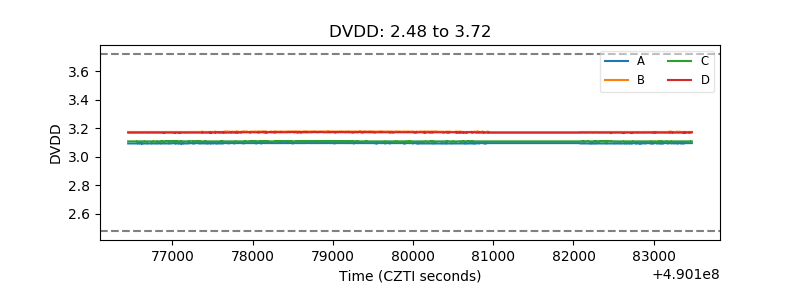 |
| Temperature 1 | 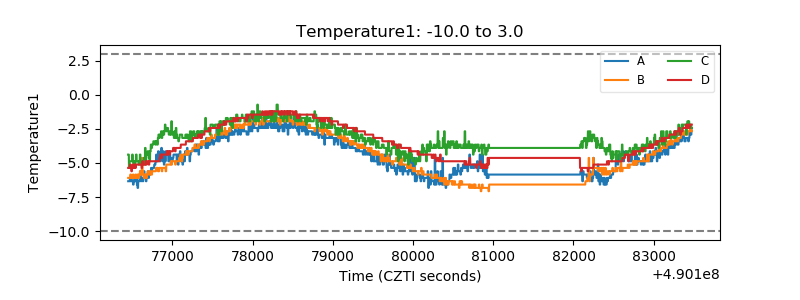 |
| Veto HV Monitor |  |
| Veto LLD | 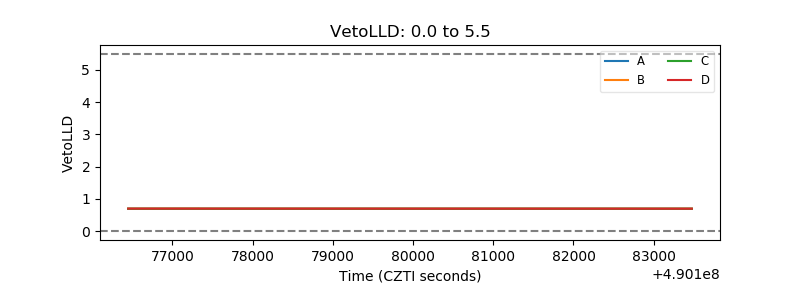 |
| Alpha Counter | 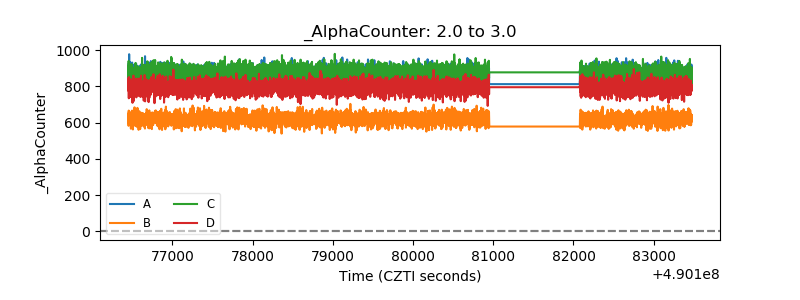 |
| _CPM_Rate | 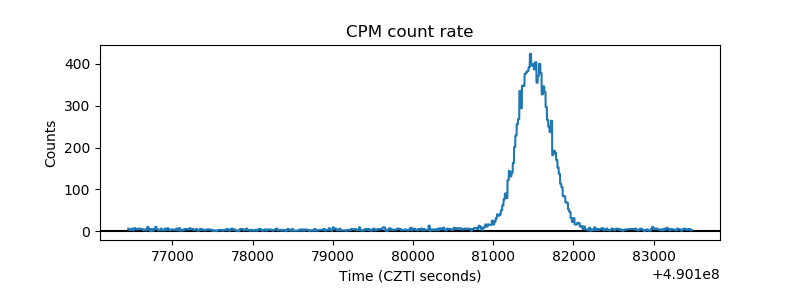 |
| CZT Counter | 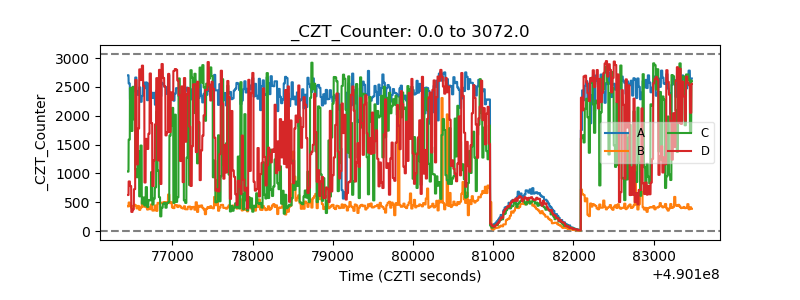 |
| +2.5 Volts monitor |  |
| +5 Volts monitor | 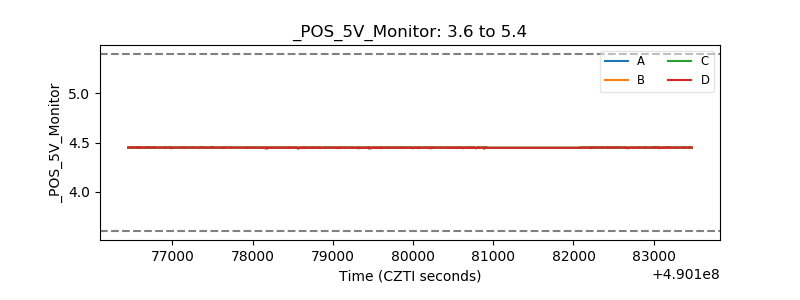 |
| _ROLL_ROT | 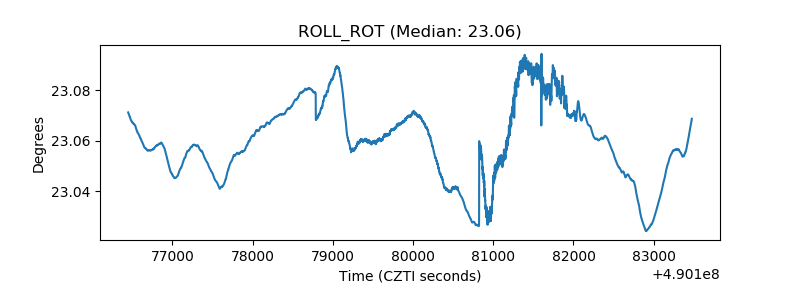 |
| _Roll_DEC | 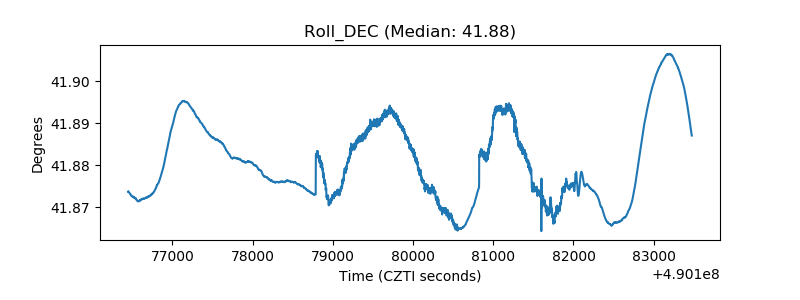 |
| _Roll_RA | 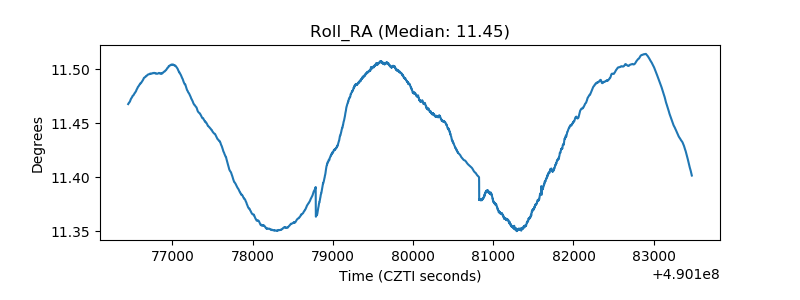 |
| Veto Counter | 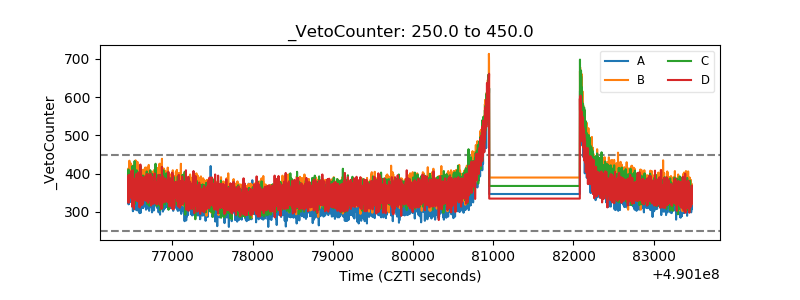 |