| Param | Original file | Final file |
|---|---|---|
| Filename | modeM0/AS1A13_003T01_9000006486_52978cztM0_level2.fits | modeM0/AS1A13_003T01_9000006486_52978cztM0_level2_quad_clean.evt |
| Size (bytes) | 1,073,548,800 | 63,244,800 |
| Size | 1023.8 MB | 60.3 MB |
| Events in quadrant A | 14,786,475 | 69,647 |
| Events in quadrant B | 3,077,185 | 632,786 |
| Events in quadrant C | 11,564,031 | 381,206 |
| Events in quadrant D | 9,845,677 | 404,103 |
| Mode M9 | |||
|---|---|---|---|
| Quadrant | BADHDUFLAG | Total packets | Discarded packets |
| A | 0 | 10 | 0 |
| B | 0 | 10 | 0 |
| C | 0 | 10 | 0 |
| D | 0 | 10 | 0 |
| Mode M0 | |||
|---|---|---|---|
| Quadrant | BADHDUFLAG | Total packets | Discarded packets |
| A | 0 | 47917 | 0 |
| B | 0 | 13444 | 0 |
| C | 0 | 38486 | 0 |
| D | 0 | 33476 | 0 |
| Mode SS | |||
|---|---|---|---|
| Quadrant | BADHDUFLAG | Total packets | Discarded packets |
| A | 0 | 122 | 0 |
| B | 0 | 122 | 0 |
| C | 0 | 122 | 0 |
| D | 0 | 122 | 0 |
| Quadrant | Total seconds | Saturated seconds | Saturation percentage |
|---|---|---|---|
| A | 6037 | 6037 | 100.000000% |
| B | 6037 | 154 | 2.550936% |
| C | 6038 | 3383 | 56.028486% |
| D | 6038 | 2617 | 43.342166% |
Noise dominated data is calculated using 1-second bins in cleaned event files. If a bin has >2000 counts, and if more than 50% of those come from <1% of pixels, then it is considered to be noise-dominated and hence unusable.
| Quadrant | # 1 sec bins | Bins with >0 counts | Bins with >2000 counts | High rate bins dominated by noise | Noise dominated (total time) | Noise dominated (detector-on time) | Marked lightcurve |
|---|---|---|---|---|---|---|---|
| A | 7047 | 6038 | 5657 | 5657 | 80.28% | 93.69% | 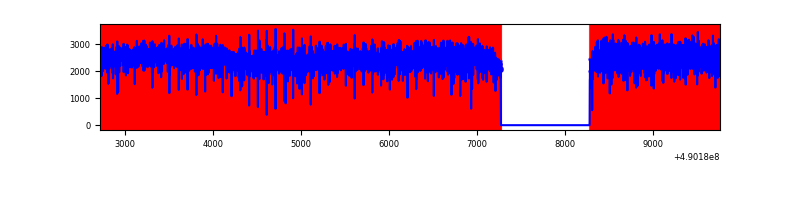 |
| B | 7047 | 6038 | 14 | 14 | 0.20% | 0.23% | 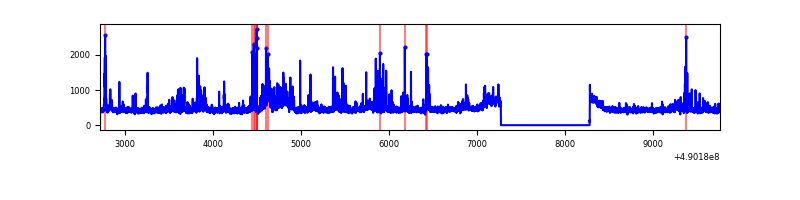 |
| C | 7048 | 6039 | 3149 | 3149 | 44.68% | 52.14% | 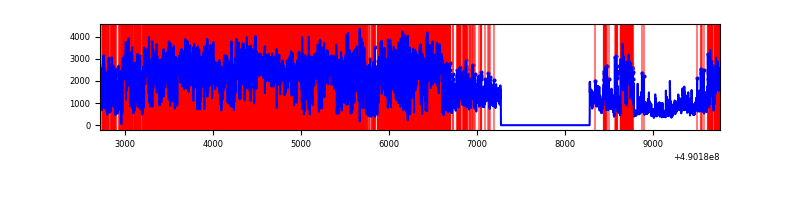 |
| D | 7048 | 6039 | 2431 | 2431 | 34.49% | 40.26% | 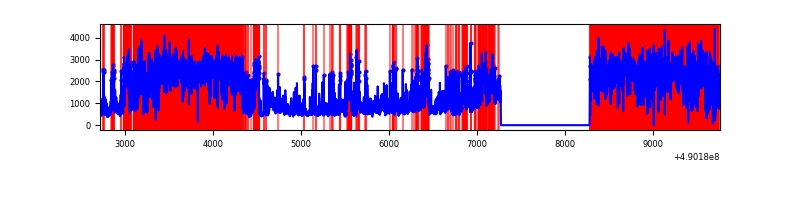 |
Top three noisy pixels from each quadrant. If the there are fewer than three noisy pixels in the level2.evt file, extra rows are filled as -1
| Pixel properties | Quadrant properties | ||||||
|---|---|---|---|---|---|---|---|
| Quadrant | DetID | PixID | Counts | Sigma | Mean | Median | Sigma |
| A | 9 | 191 | 14330894 | 568214.01 | 94 | 91 | 25.2 |
| A | 0 | 8 | 46449 | 1838.09 | 94 | 91 | 25.2 |
| A | 13 | 248 | 6048 | 236.19 | 94 | 91 | 25.2 |
| B | 0 | 143 | 236539 | 1703.82 | 651 | 629 | 138.5 |
| B | 5 | 185 | 42509 | 302.47 | 651 | 629 | 138.5 |
| B | 0 | 151 | 30768 | 217.67 | 651 | 629 | 138.5 |
| C | 7 | 80 | 8194263 | 66413.72 | 449 | 445 | 123.4 |
| C | 12 | 254 | 504116 | 4082.43 | 449 | 445 | 123.4 |
| C | 13 | 3 | 210439 | 1702.07 | 449 | 445 | 123.4 |
| D | 8 | 176 | 3371571 | 23618.6 | 498 | 476 | 142.7 |
| D | 0 | 5 | 2471886 | 17315.21 | 498 | 476 | 142.7 |
| D | 2 | 62 | 579183 | 4054.54 | 498 | 476 | 142.7 |
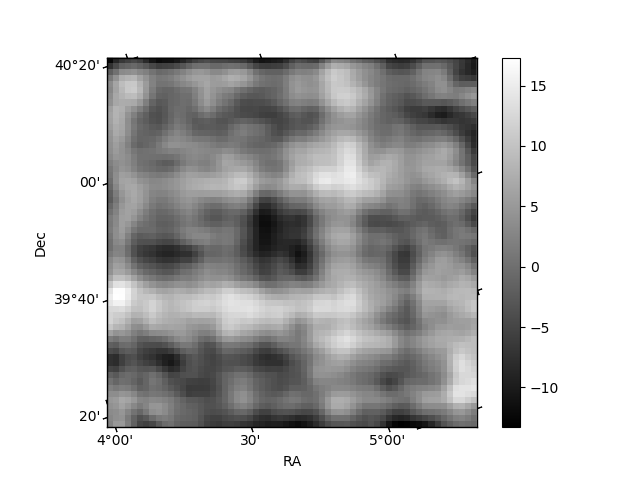
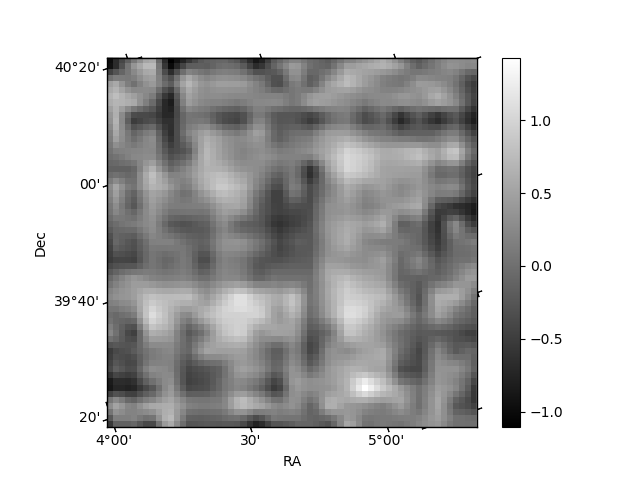
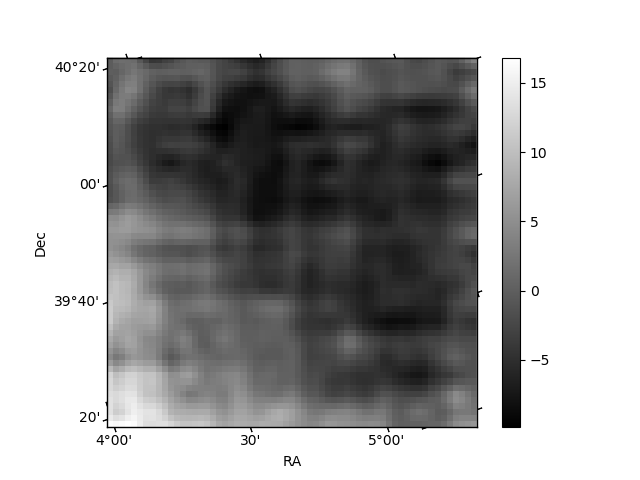
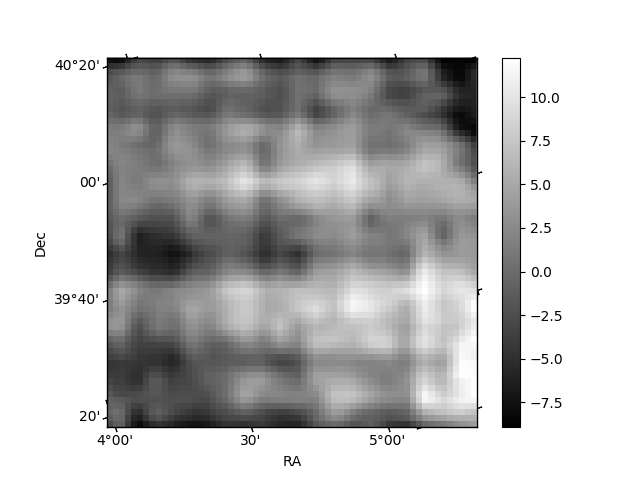
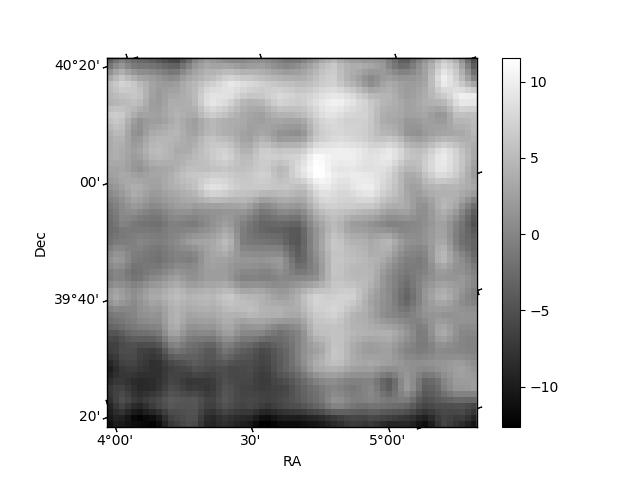
Histogram calculated using DETX and DETY for each event in the final _common_clean file
| Quadrant A | 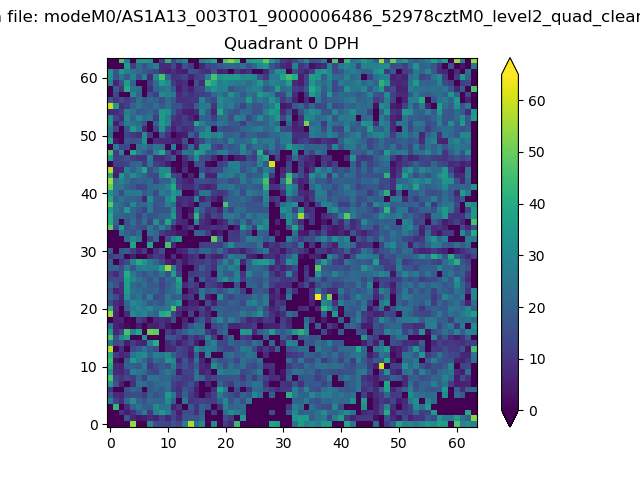 |
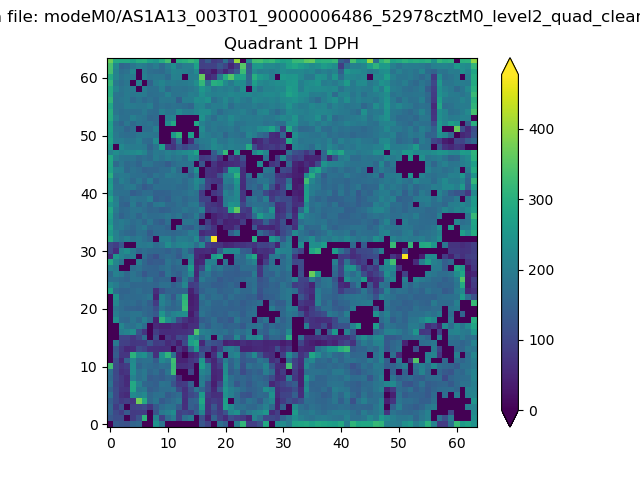 |
Quadrant B |
|---|---|---|---|
| Quadrant D | 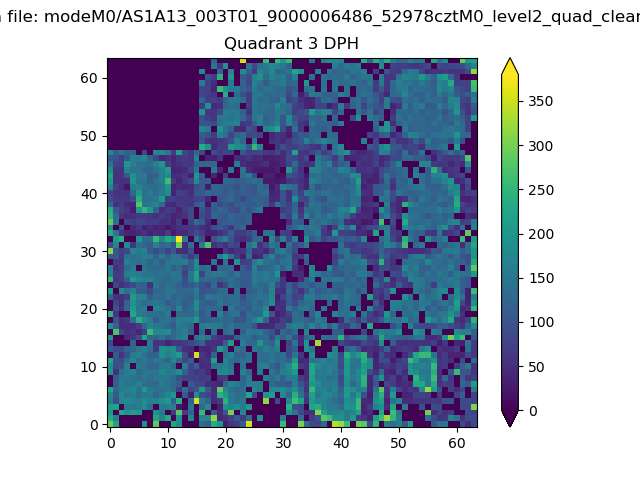 |
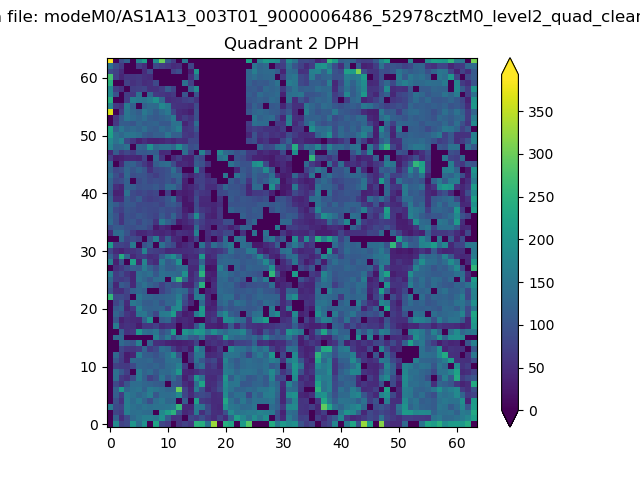 |
Quadrant C |
| Plot type | Count rate plots | Images |
|---|---|---|
| Comparison with Poisson distribution Blue bars denote a histogram of data divided into 1 sec bins. Red curve is a Poisson curve with rate = median count rate of data. |
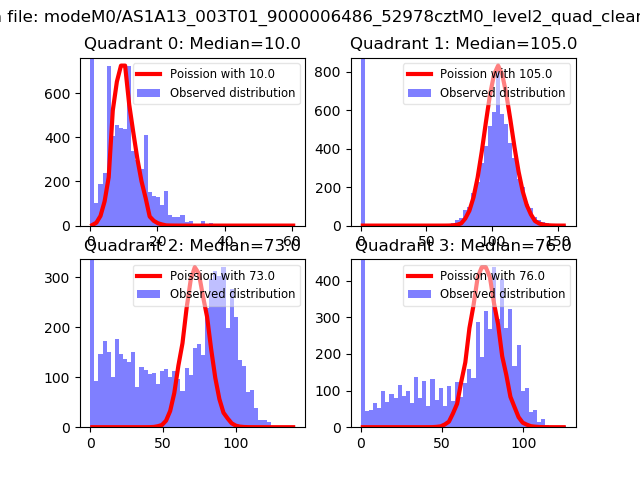 |
 |
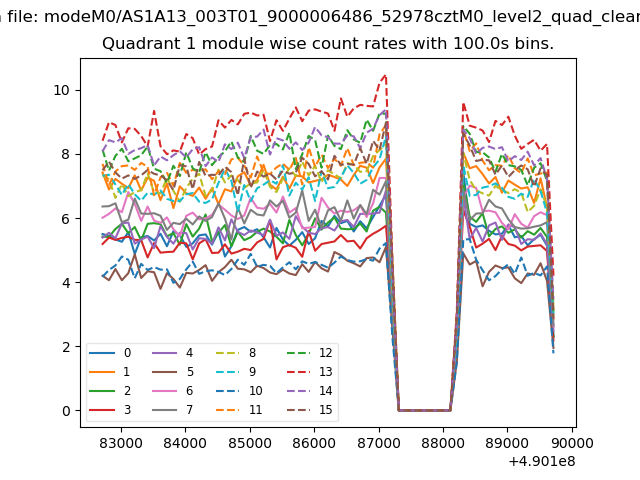
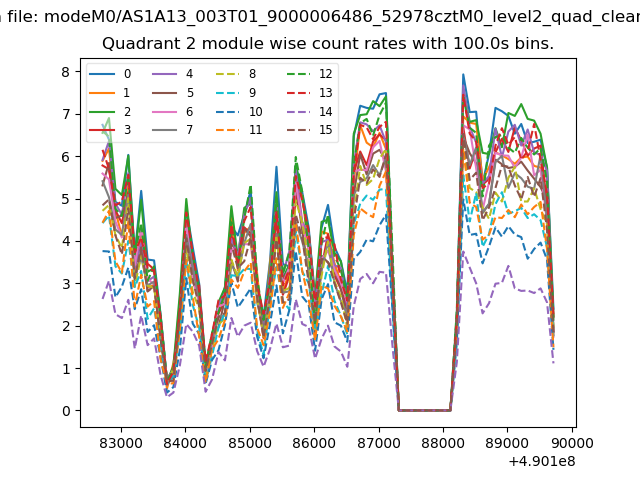
| Quadrant-wise count rates Data is divided into 100 sec bins |
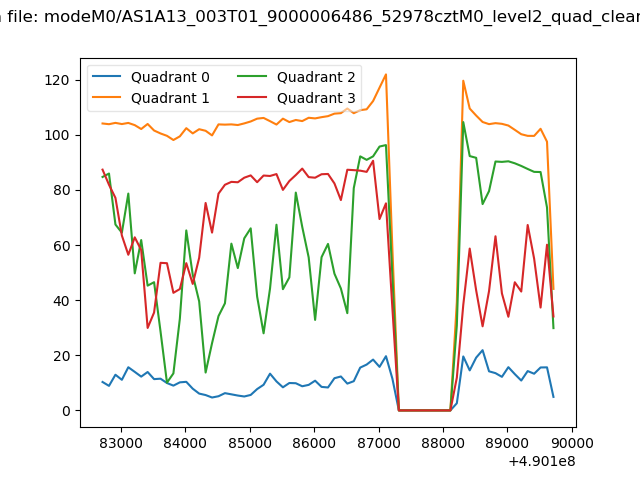 |
|
| Module-wise count rates for Quadrant A Data is divided into 100 sec bins |
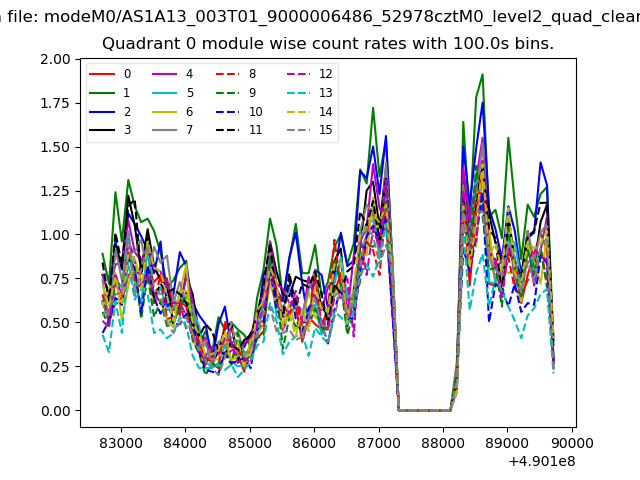 |
 |
| Module-wise count rates for Quadrant B Data is divided into 100 sec bins |
 |
 |
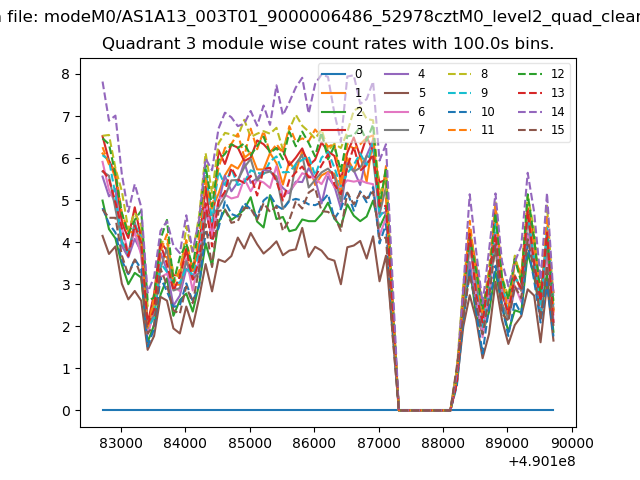
| Module-wise count rates for Quadrant C Data is divided into 100 sec bins |
 |
 |
| Module-wise count rates for Quadrant D Data is divided into 100 sec bins |
 |
 |
| Parameter | Plot |
|---|---|
| CZT HV Monitor | 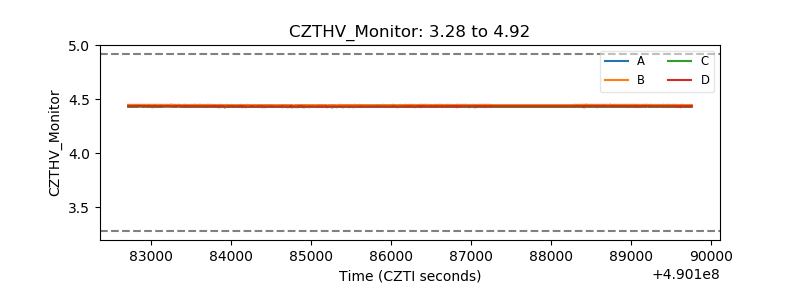 |
| D_VDD | 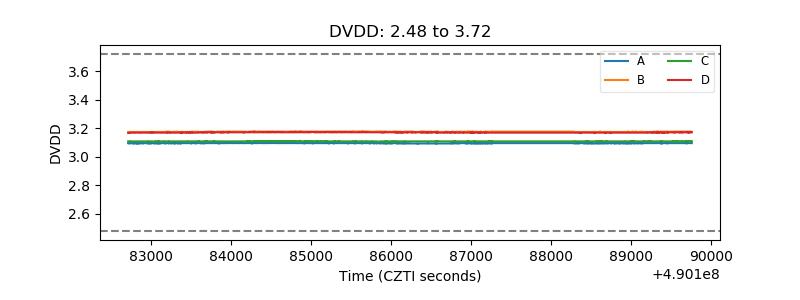 |
| Temperature 1 | 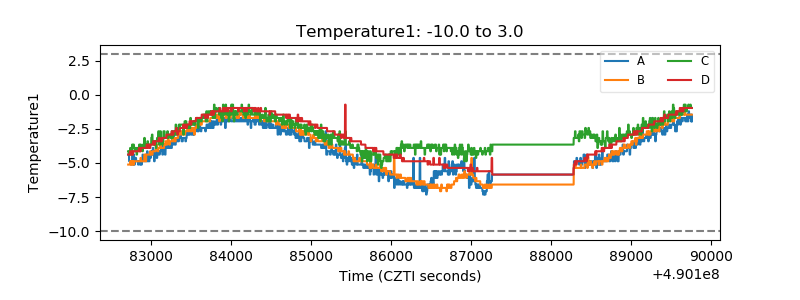 |
| Veto HV Monitor | 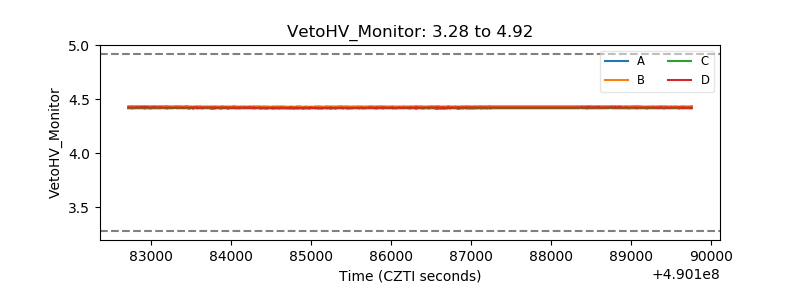 |
| Veto LLD | 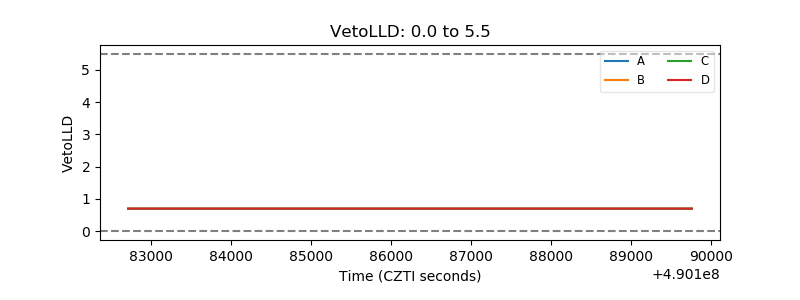 |
| Alpha Counter | 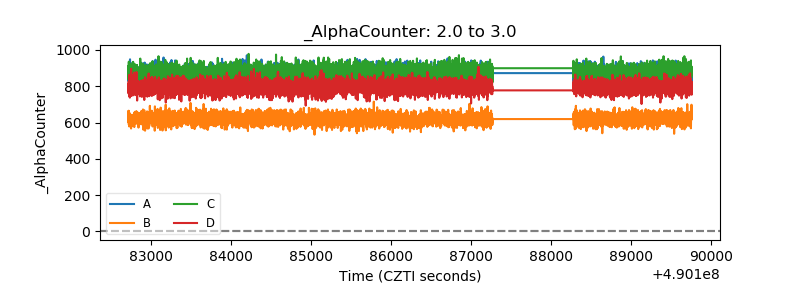 |
| _CPM_Rate | 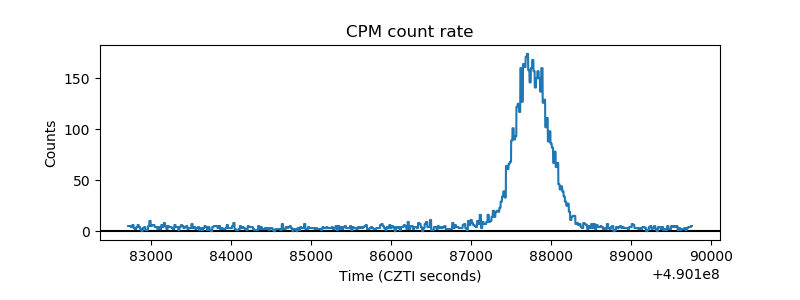 |
| CZT Counter | 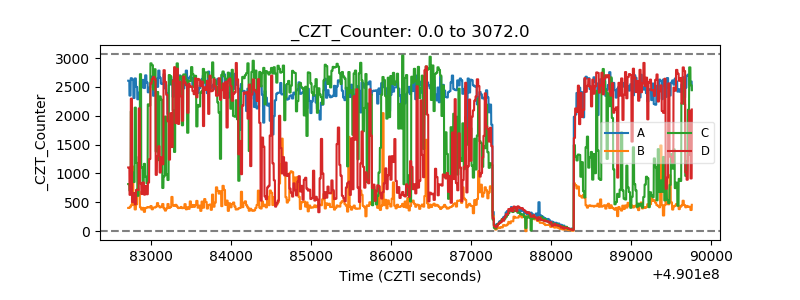 |
| +2.5 Volts monitor |  |
| +5 Volts monitor | 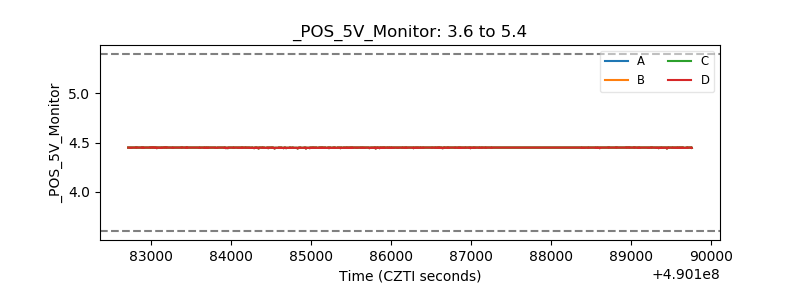 |
| _ROLL_ROT | 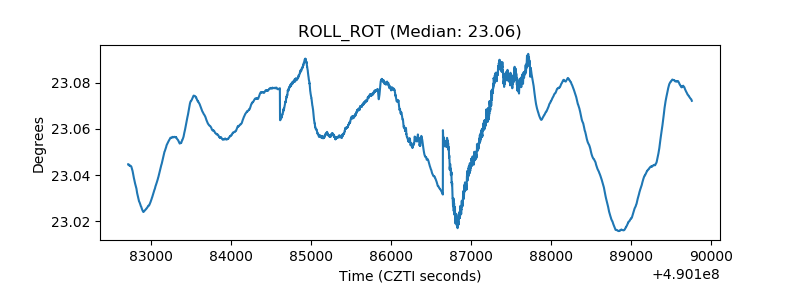 |
| _Roll_DEC | 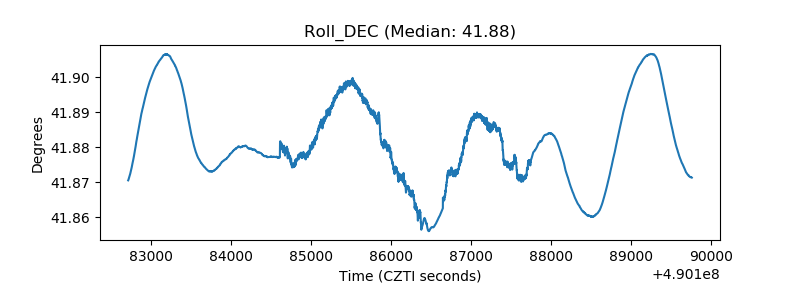 |
| _Roll_RA | 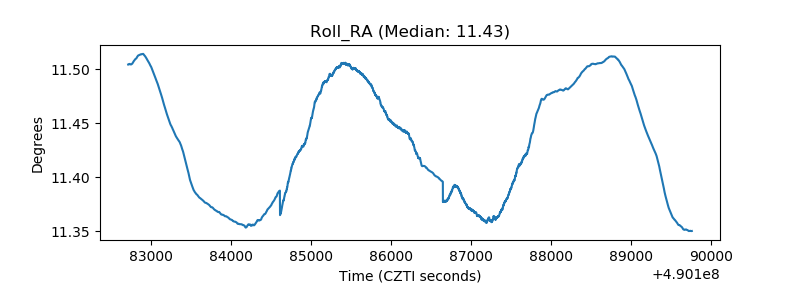 |
| Veto Counter | 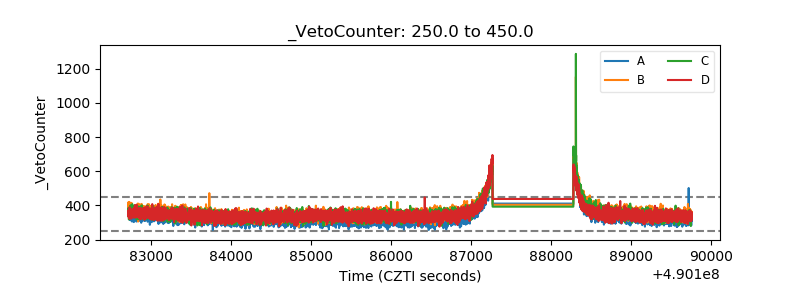 |