| Param | Original file | Final file |
|---|---|---|
| Filename | modeM0/AS1A13_003T01_9000006486_52980cztM0_level2.fits | modeM0/AS1A13_003T01_9000006486_52980cztM0_level2_quad_clean.evt |
| Size (bytes) | 1,034,032,320 | 86,016,960 |
| Size | 986.1 MB | 82.0 MB |
| Events in quadrant A | 18,136,562 | 71,167 |
| Events in quadrant B | 3,683,841 | 782,780 |
| Events in quadrant C | 5,818,691 | 654,107 |
| Events in quadrant D | 10,052,245 | 566,173 |
| Mode M0 | |||
|---|---|---|---|
| Quadrant | BADHDUFLAG | Total packets | Discarded packets |
| A | 0 | 58927 | 0 |
| B | 0 | 16316 | 0 |
| C | 0 | 22601 | 0 |
| D | 0 | 35107 | 0 |
| Mode SS | |||
|---|---|---|---|
| Quadrant | BADHDUFLAG | Total packets | Discarded packets |
| A | 0 | 152 | 0 |
| B | 0 | 152 | 0 |
| C | 0 | 152 | 0 |
| D | 0 | 152 | 0 |
| Quadrant | Total seconds | Saturated seconds | Saturation percentage |
|---|---|---|---|
| A | 7546 | 7546 | 100.000000% |
| B | 7546 | 412 | 5.459846% |
| C | 7547 | 890 | 11.792765% |
| D | 7547 | 2080 | 27.560620% |
Noise dominated data is calculated using 1-second bins in cleaned event files. If a bin has >2000 counts, and if more than 50% of those come from <1% of pixels, then it is considered to be noise-dominated and hence unusable.
| Quadrant | # 1 sec bins | Bins with >0 counts | Bins with >2000 counts | High rate bins dominated by noise | Noise dominated (total time) | Noise dominated (detector-on time) | Marked lightcurve |
|---|---|---|---|---|---|---|---|
| A | 7615 | 7546 | 6505 | 6505 | 85.42% | 86.20% | 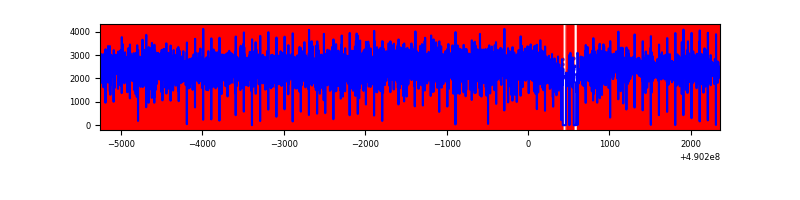 |
| B | 7616 | 7548 | 19 | 19 | 0.25% | 0.25% | 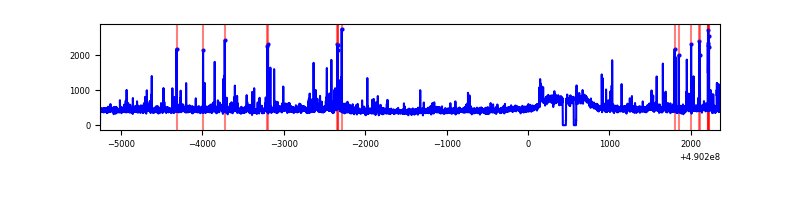 |
| C | 7617 | 7549 | 523 | 523 | 6.87% | 6.93% | 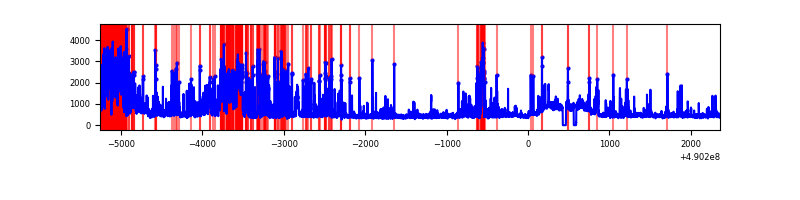 |
| D | 7617 | 7549 | 1751 | 1751 | 22.99% | 23.20% | 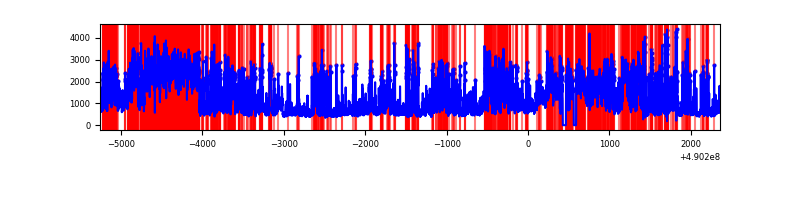 |
Top three noisy pixels from each quadrant. If the there are fewer than three noisy pixels in the level2.evt file, extra rows are filled as -1
| Pixel properties | Quadrant properties | ||||||
|---|---|---|---|---|---|---|---|
| Quadrant | DetID | PixID | Counts | Sigma | Mean | Median | Sigma |
| A | 9 | 191 | 17581595 | 636488.77 | 103 | 100 | 27.6 |
| A | 0 | 8 | 58326 | 2107.91 | 103 | 100 | 27.6 |
| A | 4 | 249 | 22190 | 799.71 | 103 | 100 | 27.6 |
| B | 10 | 63 | 70594 | 387.74 | 837 | 806 | 180.0 |
| B | 10 | 128 | 45358 | 247.53 | 837 | 806 | 180.0 |
| B | 10 | 254 | 42157 | 229.75 | 837 | 806 | 180.0 |
| C | 7 | 80 | 1260451 | 5903.56 | 796 | 787 | 213.4 |
| C | 4 | 5 | 330072 | 1543.23 | 796 | 787 | 213.4 |
| C | 15 | 224 | 329410 | 1540.13 | 796 | 787 | 213.4 |
| D | 0 | 5 | 3572582 | 18016.62 | 706 | 677 | 198.3 |
| D | 8 | 176 | 1538582 | 7757.16 | 706 | 677 | 198.3 |
| D | 2 | 62 | 876698 | 4418.63 | 706 | 677 | 198.3 |
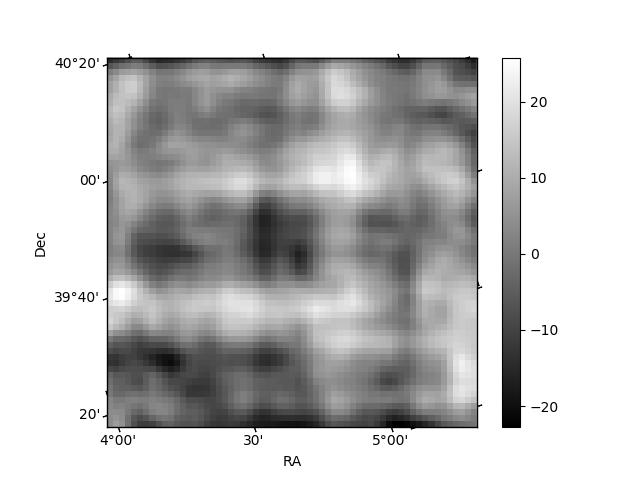
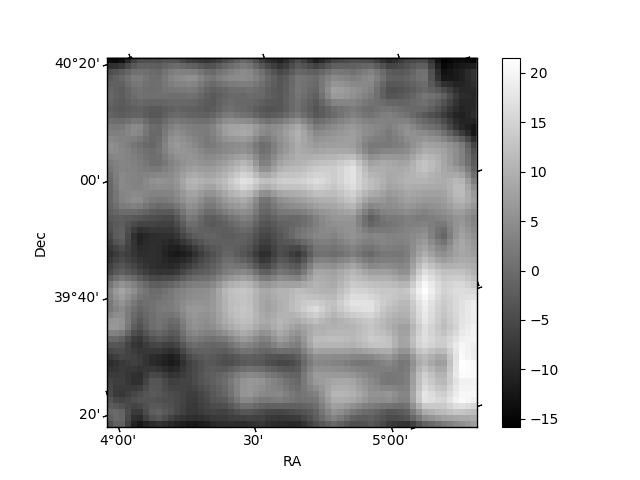
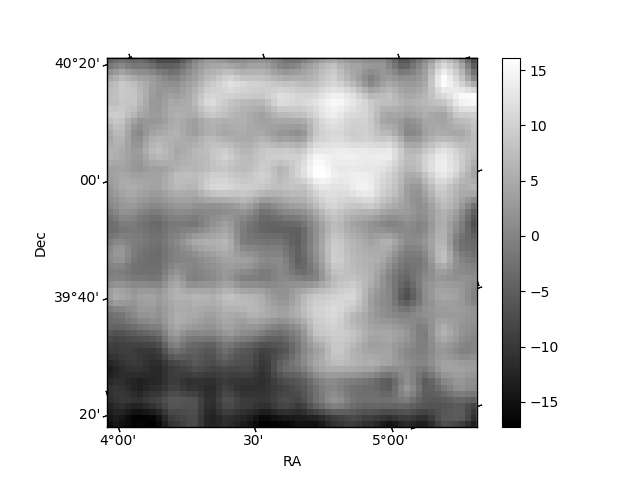
Histogram calculated using DETX and DETY for each event in the final _common_clean file
| Quadrant A | 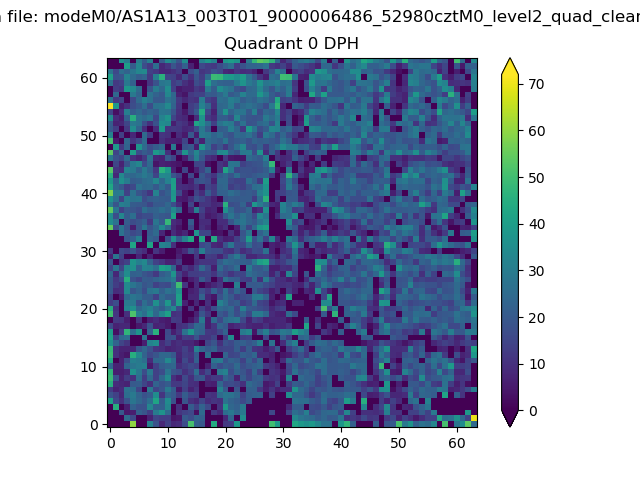 |
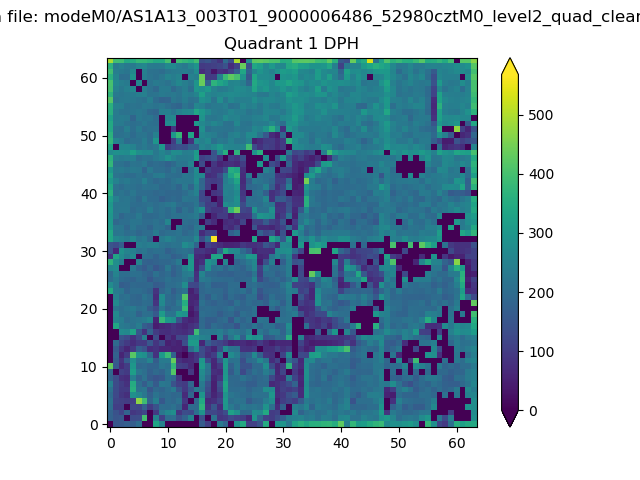 |
Quadrant B |
|---|---|---|---|
| Quadrant D | 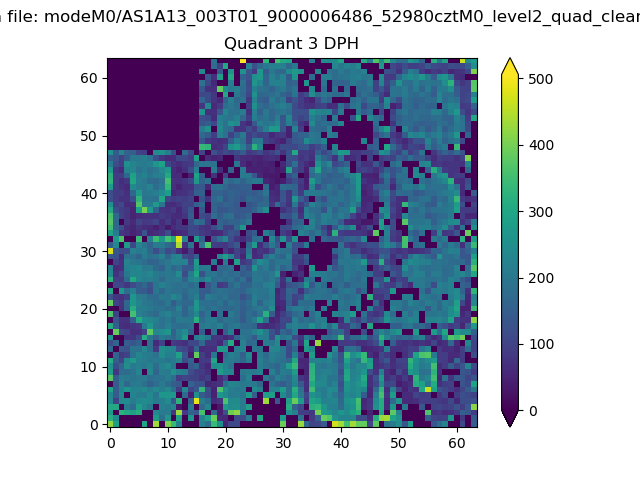 |
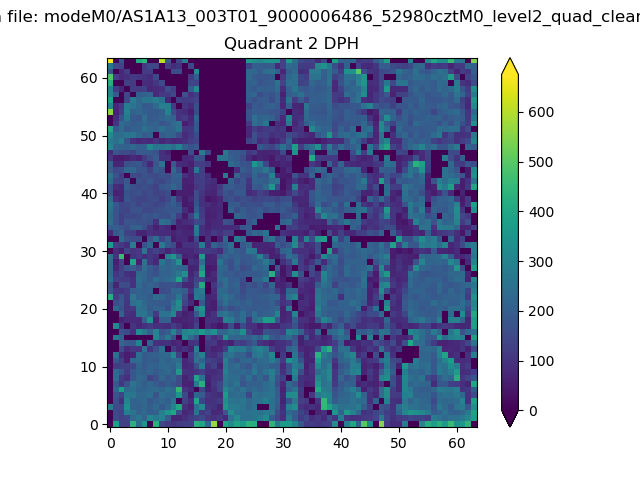 |
Quadrant C |
| Plot type | Count rate plots | Images |
|---|---|---|
| Comparison with Poisson distribution Blue bars denote a histogram of data divided into 1 sec bins. Red curve is a Poisson curve with rate = median count rate of data. |
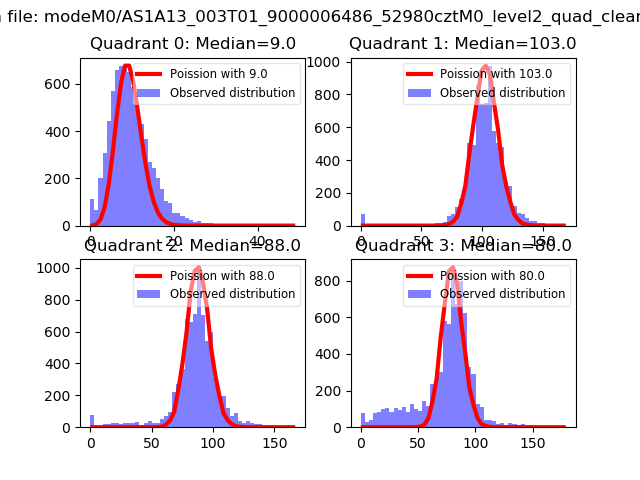 |
 |
| Quadrant-wise count rates Data is divided into 100 sec bins |
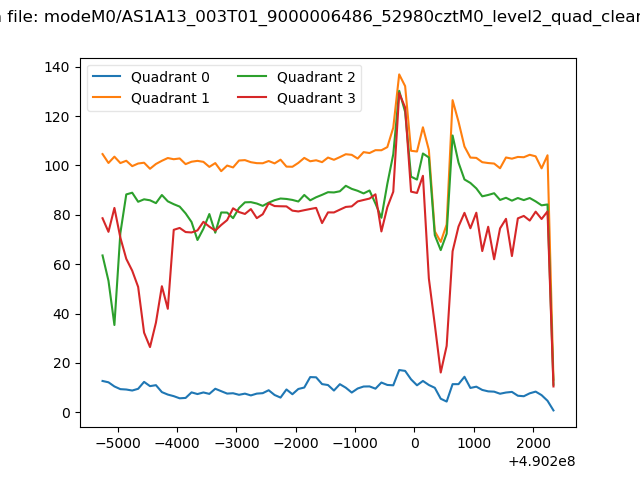 |
|
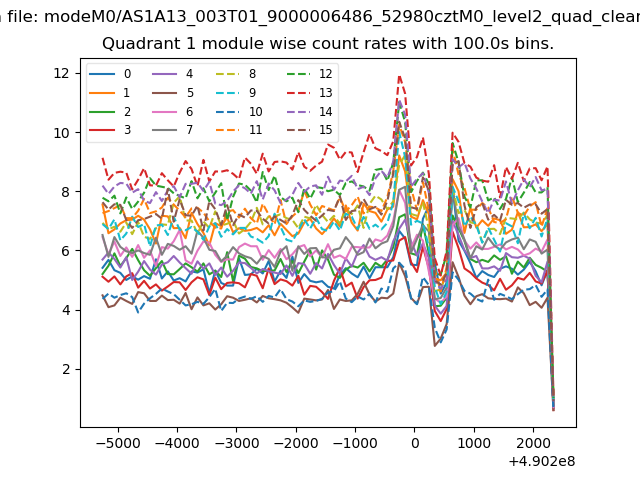
| Module-wise count rates for Quadrant A Data is divided into 100 sec bins |
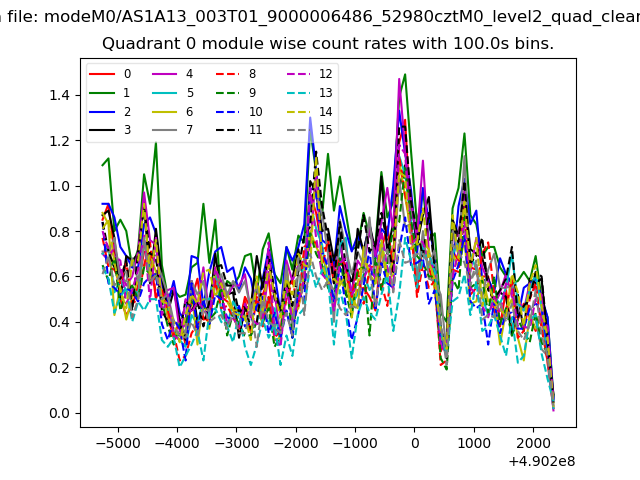 |
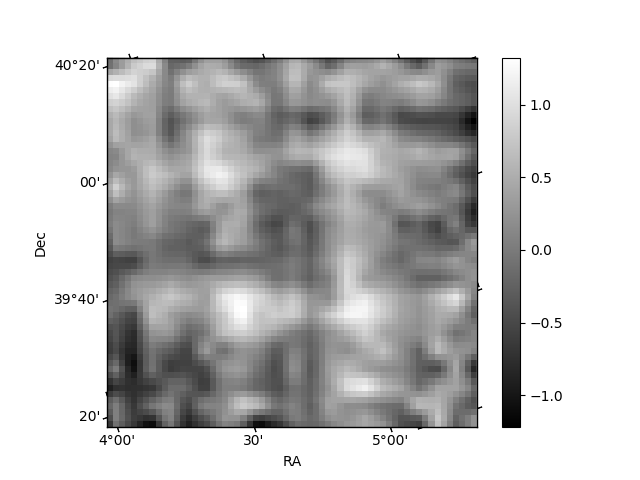 |
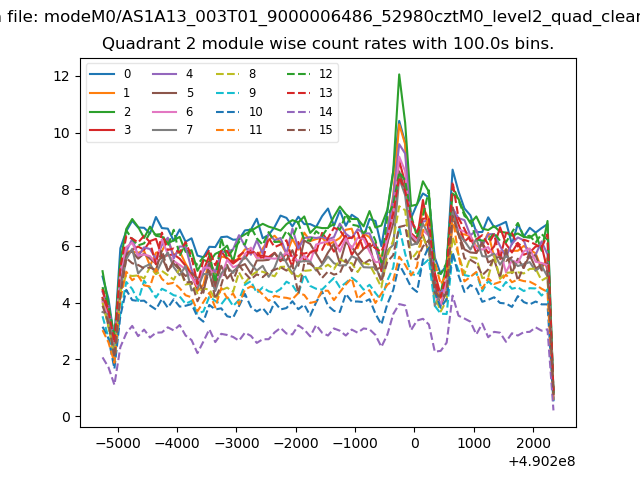
| Module-wise count rates for Quadrant B Data is divided into 100 sec bins |
 |
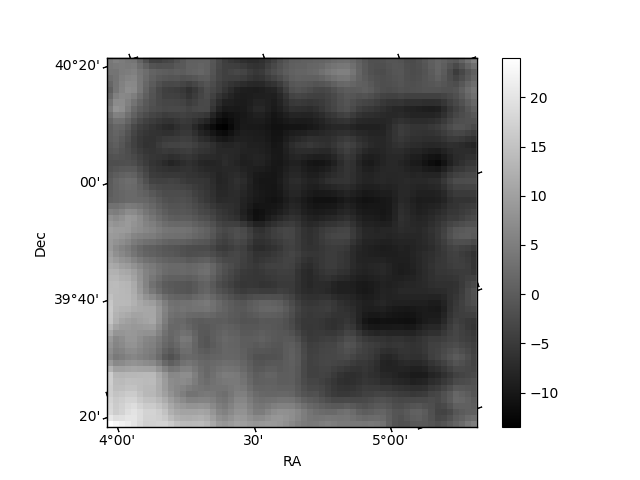 |
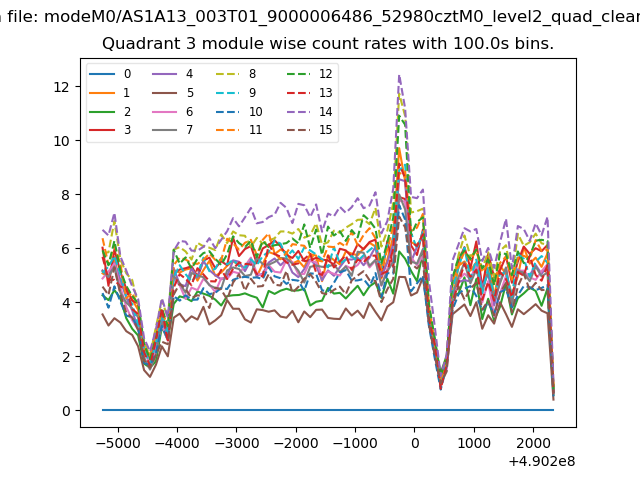
| Module-wise count rates for Quadrant C Data is divided into 100 sec bins |
 |
 |
| Module-wise count rates for Quadrant D Data is divided into 100 sec bins |
 |
 |
| Parameter | Plot |
|---|---|
| CZT HV Monitor | 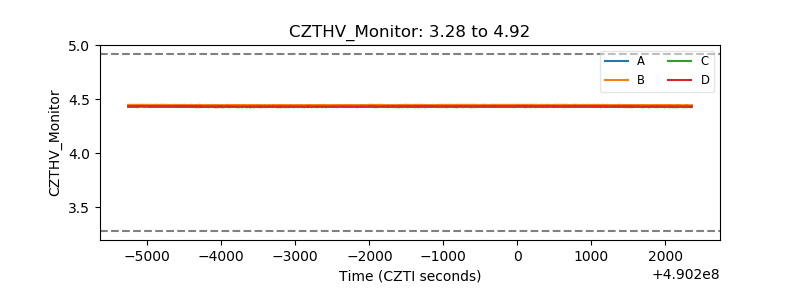 |
| D_VDD | 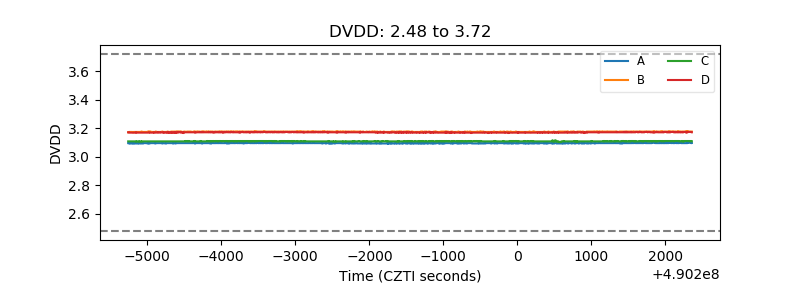 |
| Temperature 1 | 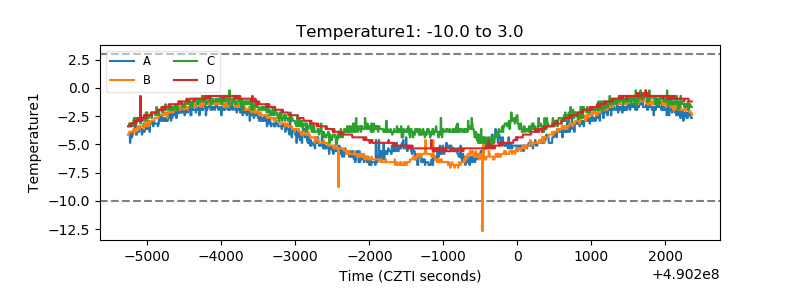 |
| Veto HV Monitor | 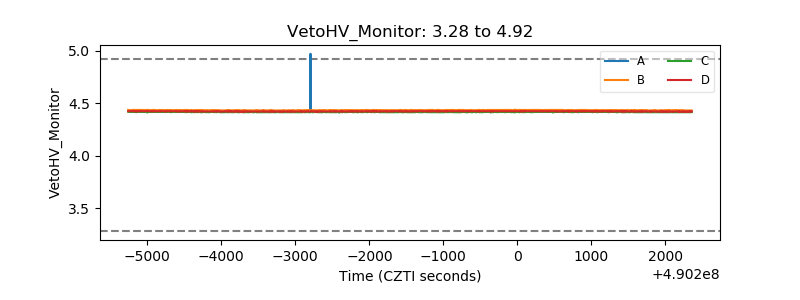 |
| Veto LLD | 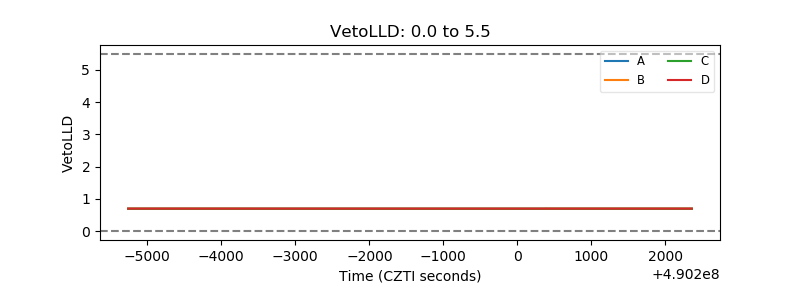 |
| Alpha Counter | 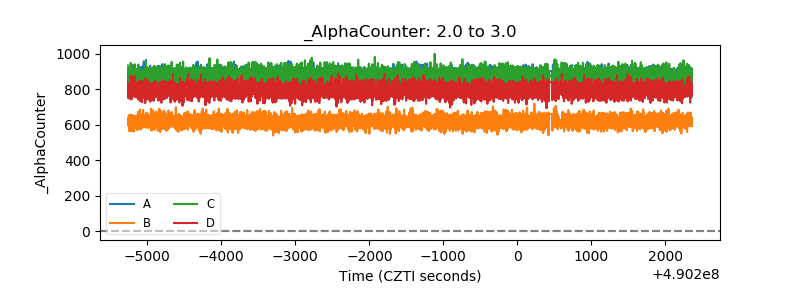 |
| _CPM_Rate | 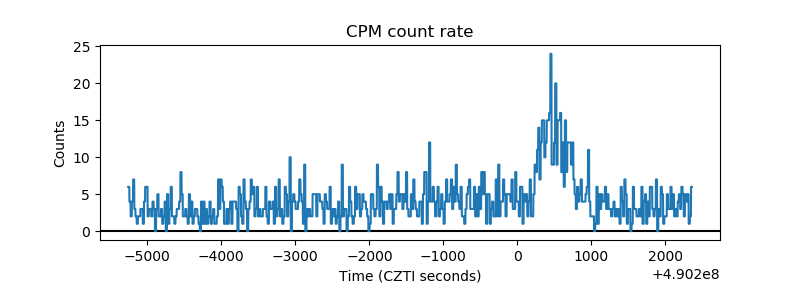 |
| CZT Counter | 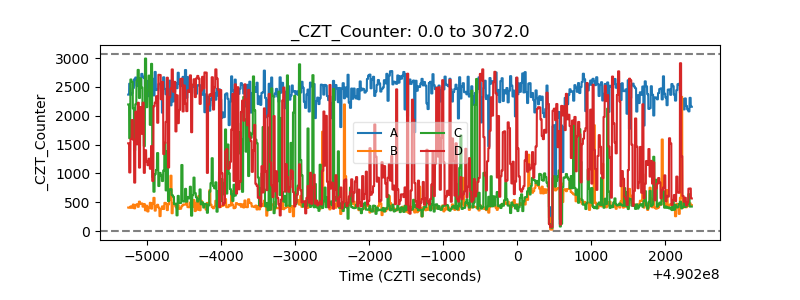 |
| +2.5 Volts monitor |  |
| +5 Volts monitor | 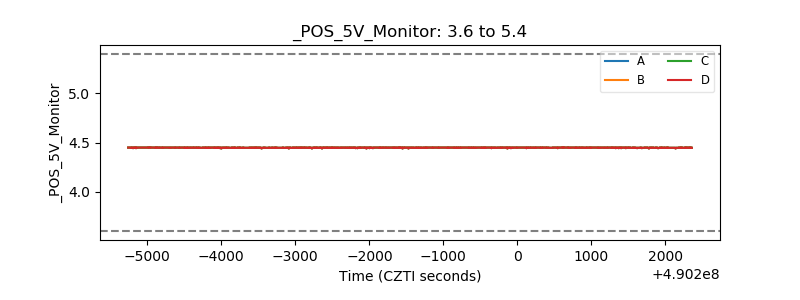 |
| _ROLL_ROT | 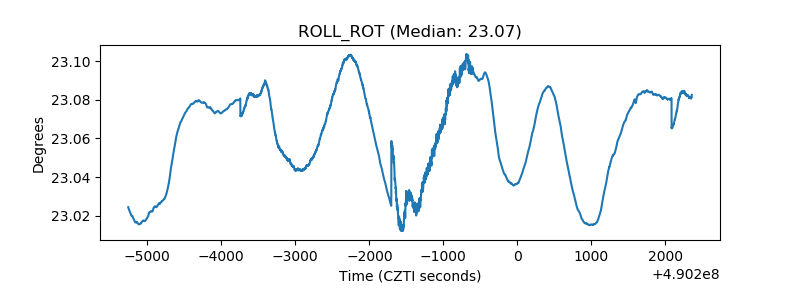 |
| _Roll_DEC | 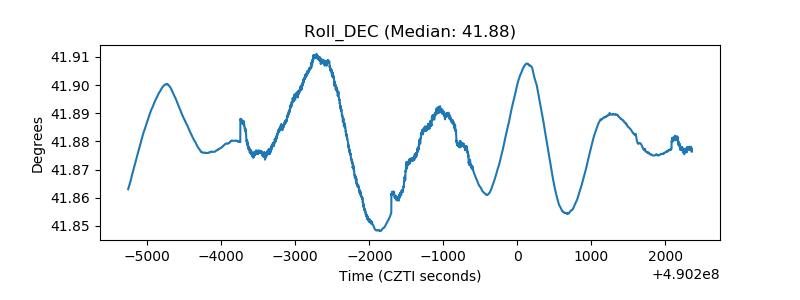 |
| _Roll_RA | 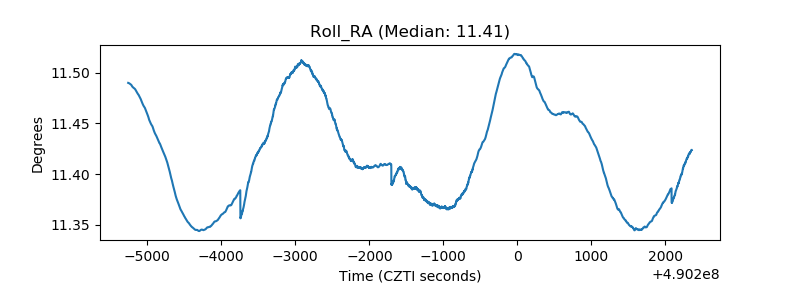 |
| Veto Counter | 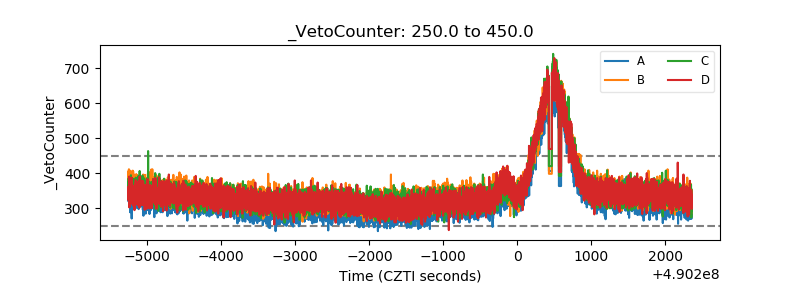 |