| Param | Original file | Final file |
|---|---|---|
| Filename | modeM0/AS1A13_003T01_9000006486_52981cztM0_level2.fits | modeM0/AS1A13_003T01_9000006486_52981cztM0_level2_quad_clean.evt |
| Size (bytes) | 1,071,993,600 | 87,117,120 |
| Size | 1022.3 MB | 83.1 MB |
| Events in quadrant A | 18,671,041 | 93,870 |
| Events in quadrant B | 4,441,807 | 775,599 |
| Events in quadrant C | 5,126,455 | 663,126 |
| Events in quadrant D | 10,851,134 | 568,692 |
| Mode M0 | |||
|---|---|---|---|
| Quadrant | BADHDUFLAG | Total packets | Discarded packets |
| A | 0 | 60582 | 0 |
| B | 0 | 18487 | 0 |
| C | 0 | 20729 | 0 |
| D | 0 | 37511 | 0 |
| Mode SS | |||
|---|---|---|---|
| Quadrant | BADHDUFLAG | Total packets | Discarded packets |
| A | 0 | 154 | 0 |
| B | 0 | 154 | 0 |
| C | 0 | 154 | 0 |
| D | 0 | 154 | 0 |
| Quadrant | Total seconds | Saturated seconds | Saturation percentage |
|---|---|---|---|
| A | 7634 | 7634 | 100.000000% |
| B | 7634 | 319 | 4.178674% |
| C | 7635 | 462 | 6.051081% |
| D | 7635 | 2210 | 28.945645% |
Noise dominated data is calculated using 1-second bins in cleaned event files. If a bin has >2000 counts, and if more than 50% of those come from <1% of pixels, then it is considered to be noise-dominated and hence unusable.
| Quadrant | # 1 sec bins | Bins with >0 counts | Bins with >2000 counts | High rate bins dominated by noise | Noise dominated (total time) | Noise dominated (detector-on time) | Marked lightcurve |
|---|---|---|---|---|---|---|---|
| A | 7634 | 7633 | 6740 | 6740 | 88.29% | 88.30% | 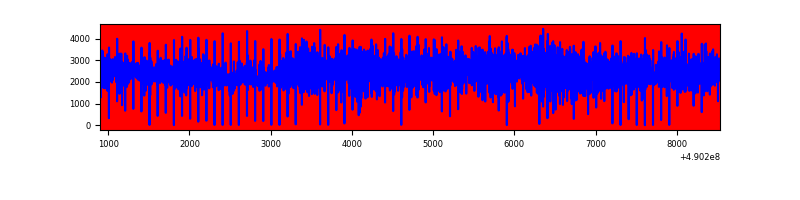 |
| B | 7634 | 7634 | 219 | 219 | 2.87% | 2.87% | 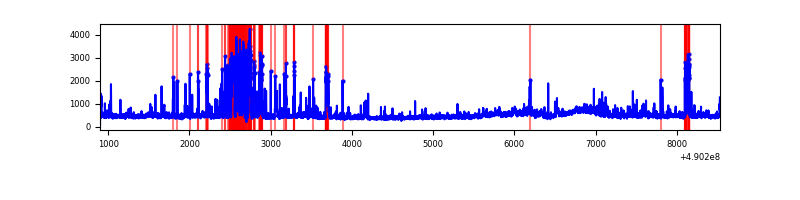 |
| C | 7635 | 7635 | 324 | 324 | 4.24% | 4.24% | 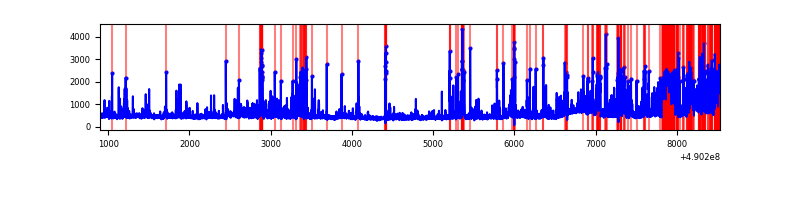 |
| D | 7635 | 7635 | 2033 | 2033 | 26.63% | 26.63% | 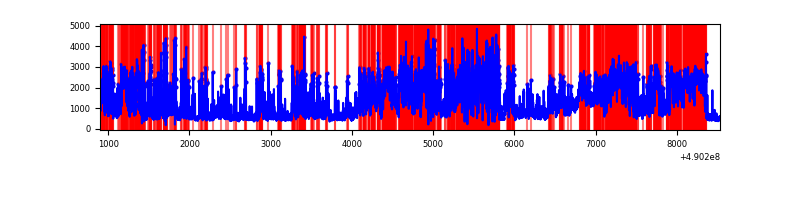 |
Top three noisy pixels from each quadrant. If the there are fewer than three noisy pixels in the level2.evt file, extra rows are filled as -1
| Pixel properties | Quadrant properties | ||||||
|---|---|---|---|---|---|---|---|
| Quadrant | DetID | PixID | Counts | Sigma | Mean | Median | Sigma |
| A | 9 | 191 | 18005479 | 546581.64 | 125 | 122 | 32.9 |
| A | 7 | 206 | 60779 | 1841.34 | 125 | 122 | 32.9 |
| A | 10 | 253 | 26847 | 811.28 | 125 | 122 | 32.9 |
| B | 10 | 63 | 654956 | 3717.72 | 817 | 788 | 176.0 |
| B | 7 | 0 | 109325 | 616.83 | 817 | 788 | 176.0 |
| B | 4 | 81 | 90593 | 510.37 | 817 | 788 | 176.0 |
| C | 9 | 38 | 565936 | 2665.38 | 784 | 776 | 212.0 |
| C | 4 | 5 | 330540 | 1555.22 | 784 | 776 | 212.0 |
| C | 13 | 3 | 308778 | 1452.58 | 784 | 776 | 212.0 |
| D | 0 | 5 | 3844027 | 19054.21 | 710 | 678 | 201.7 |
| D | 8 | 176 | 1850815 | 9172.45 | 710 | 678 | 201.7 |
| D | 6 | 42 | 774206 | 3834.93 | 710 | 678 | 201.7 |
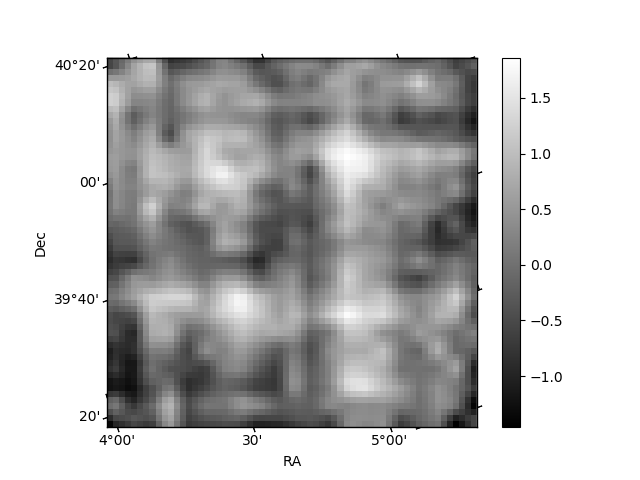
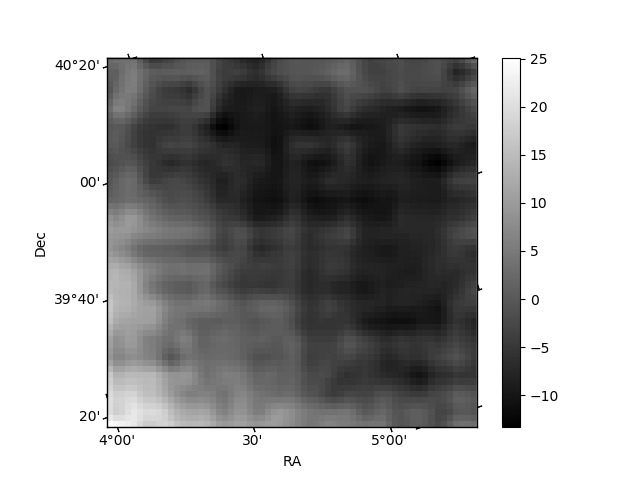
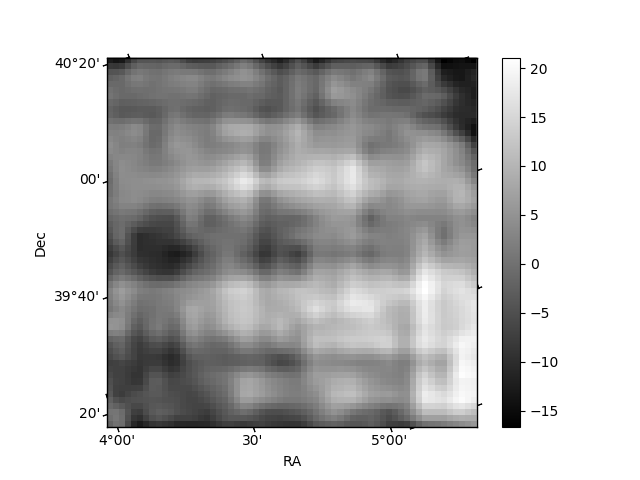
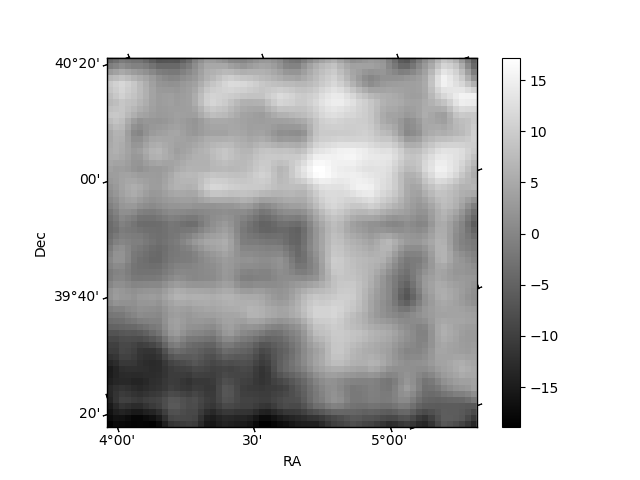
Histogram calculated using DETX and DETY for each event in the final _common_clean file
| Quadrant A | 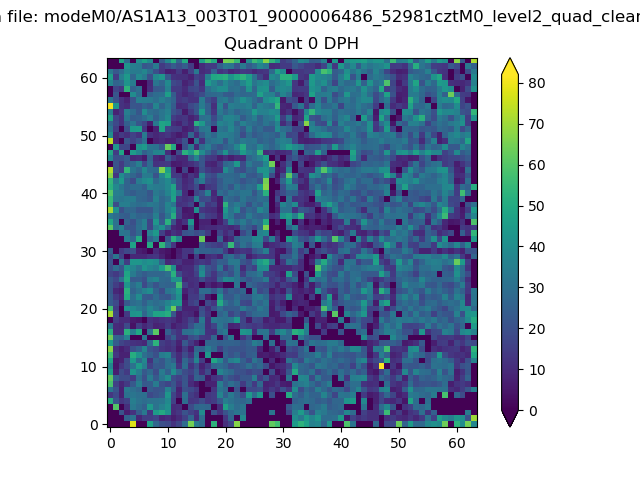 |
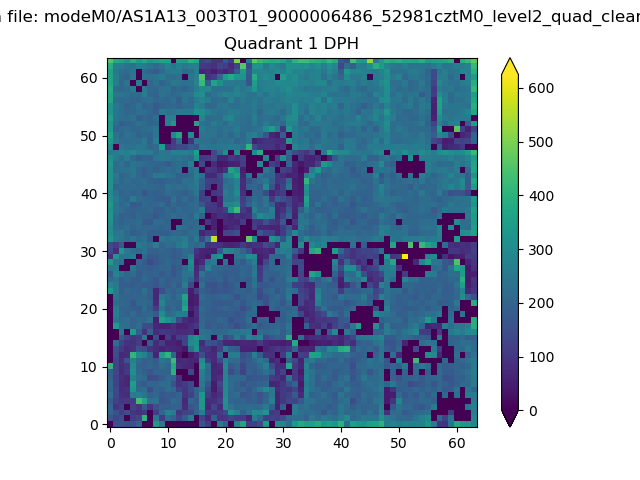 |
Quadrant B |
|---|---|---|---|
| Quadrant D | 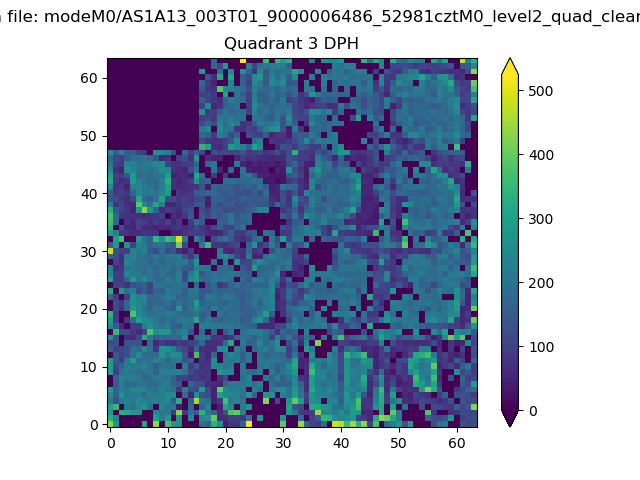 |
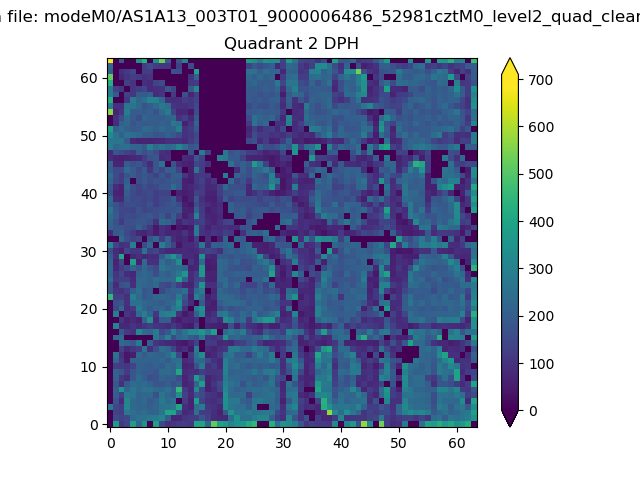 |
Quadrant C |
| Plot type | Count rate plots | Images |
|---|---|---|
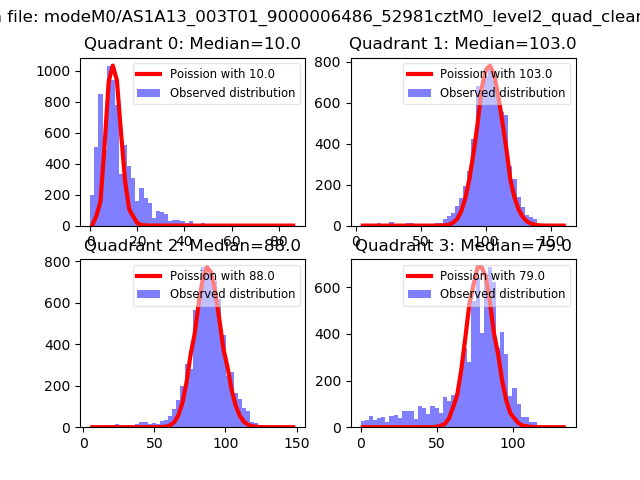
| Comparison with Poisson distribution Blue bars denote a histogram of data divided into 1 sec bins. Red curve is a Poisson curve with rate = median count rate of data. |
 |
 |
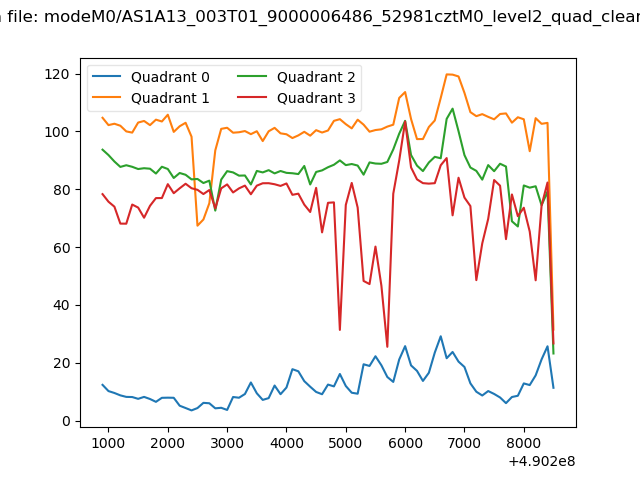
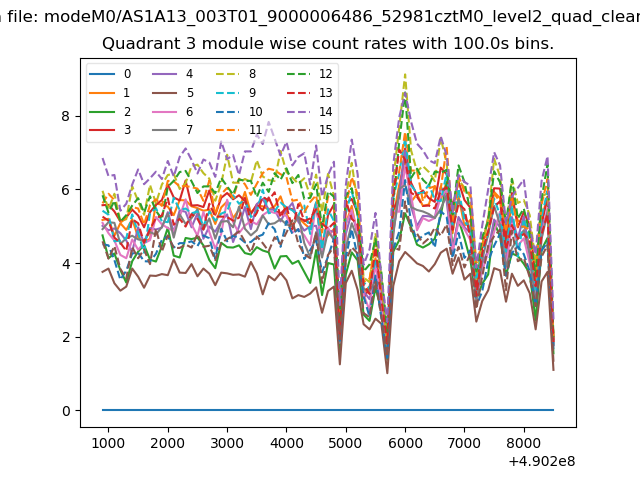
| Quadrant-wise count rates Data is divided into 100 sec bins |
 |
|
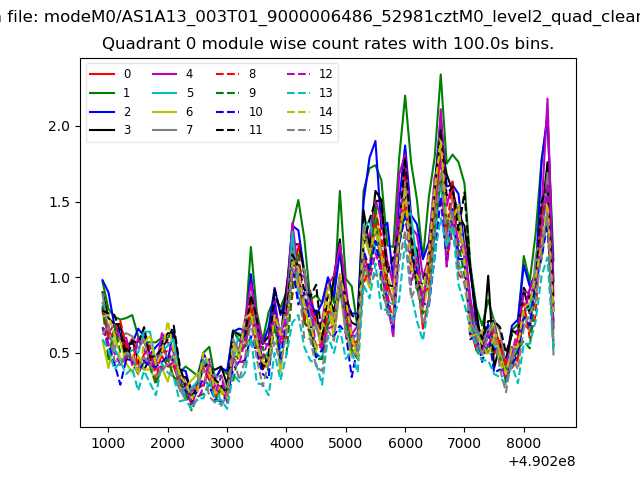
| Module-wise count rates for Quadrant A Data is divided into 100 sec bins |
 |
 |
| Module-wise count rates for Quadrant B Data is divided into 100 sec bins |
 |
 |
| Module-wise count rates for Quadrant C Data is divided into 100 sec bins |
 |
 |
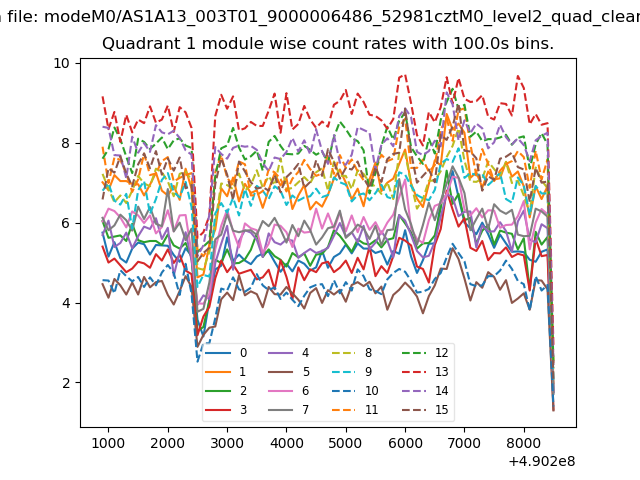
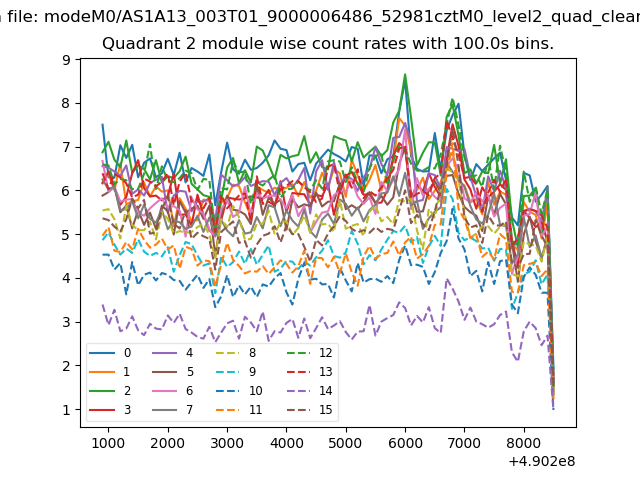
| Module-wise count rates for Quadrant D Data is divided into 100 sec bins |
 |
 |
| Parameter | Plot |
|---|---|
| CZT HV Monitor | 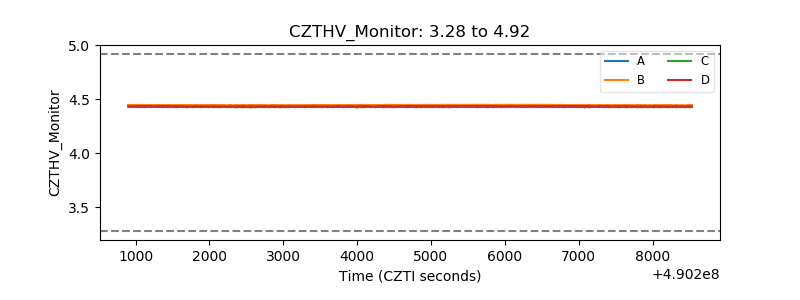 |
| D_VDD | 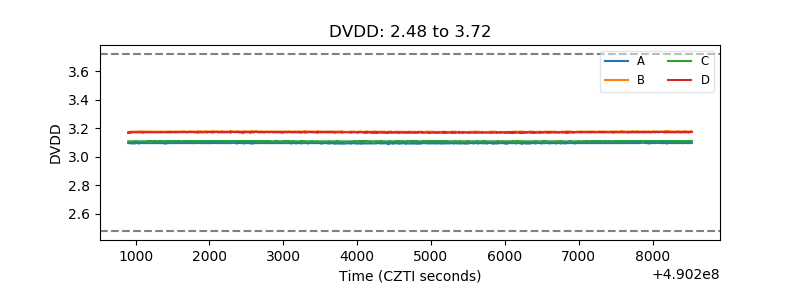 |
| Temperature 1 | 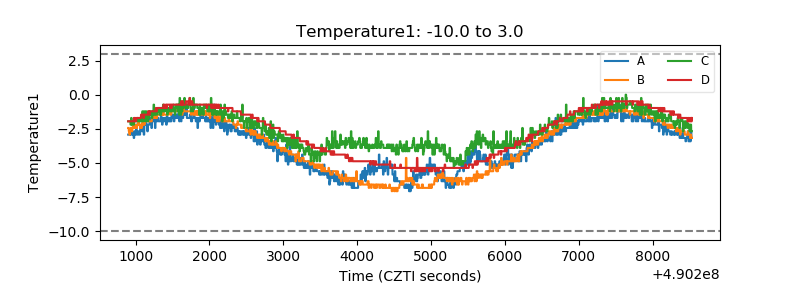 |
| Veto HV Monitor | 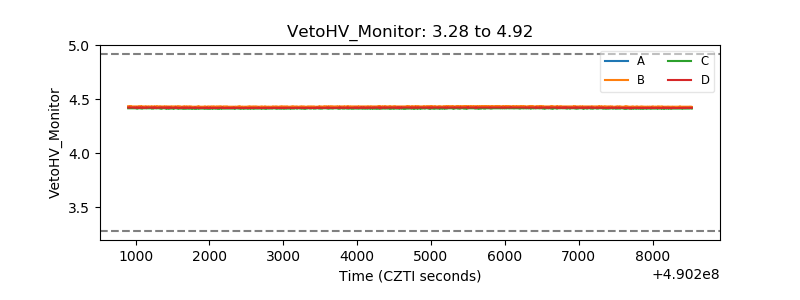 |
| Veto LLD | 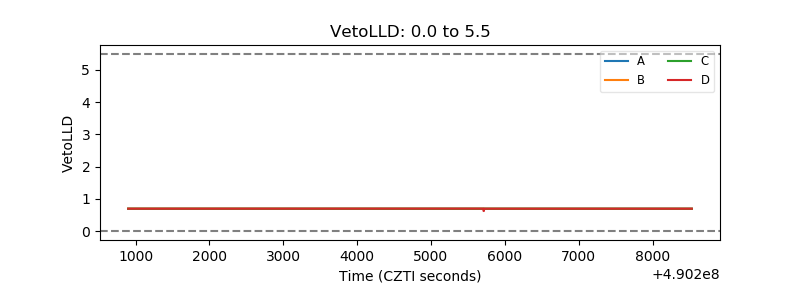 |
| Alpha Counter | 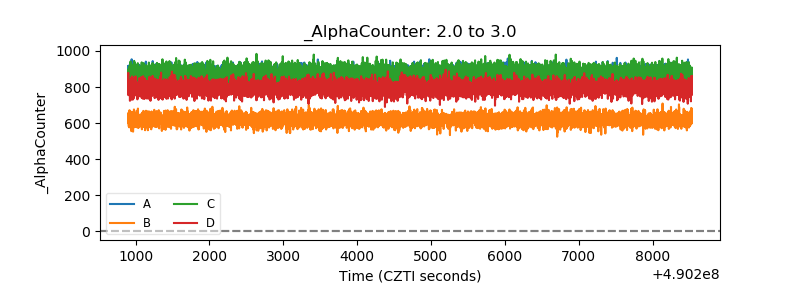 |
| _CPM_Rate | 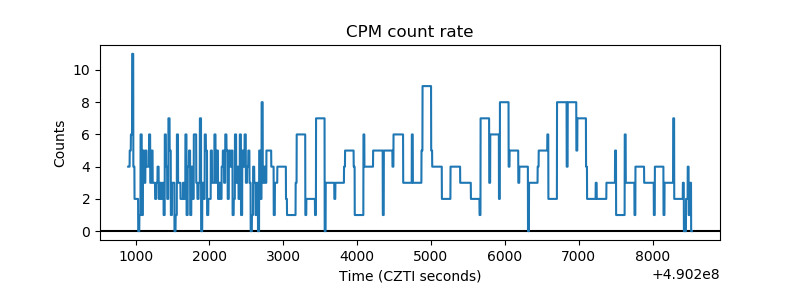 |
| CZT Counter | 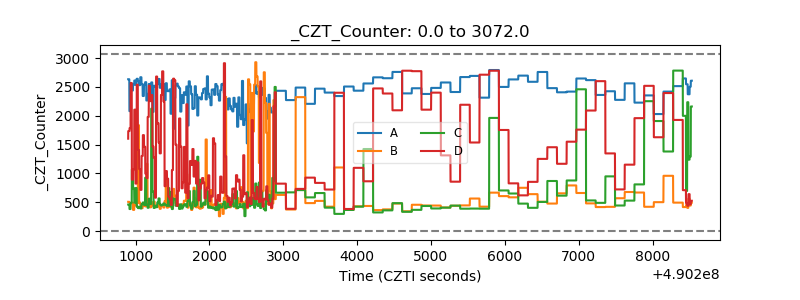 |
| +2.5 Volts monitor |  |
| +5 Volts monitor | 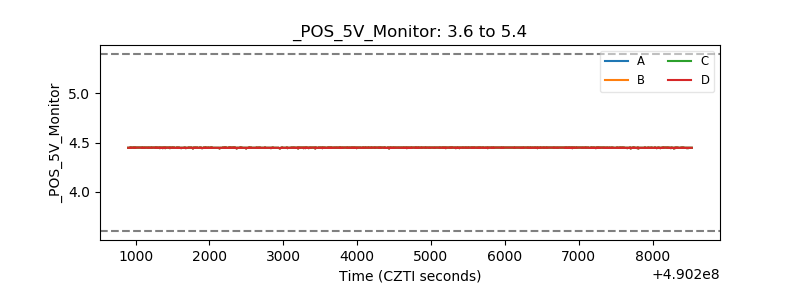 |
| _ROLL_ROT | 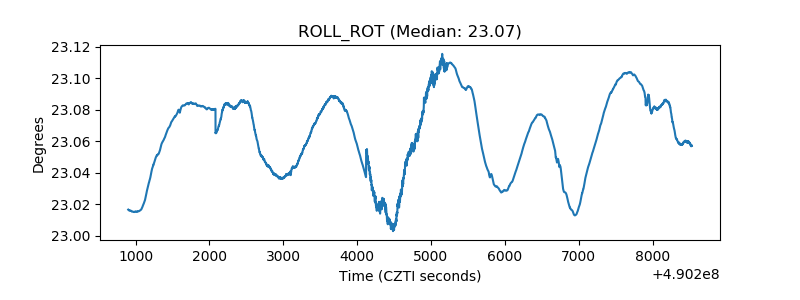 |
| _Roll_DEC | 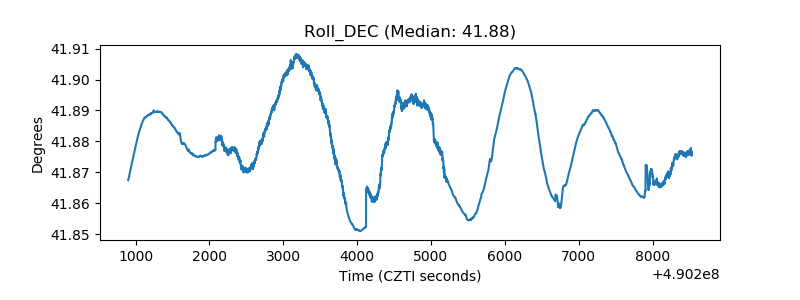 |
| _Roll_RA | 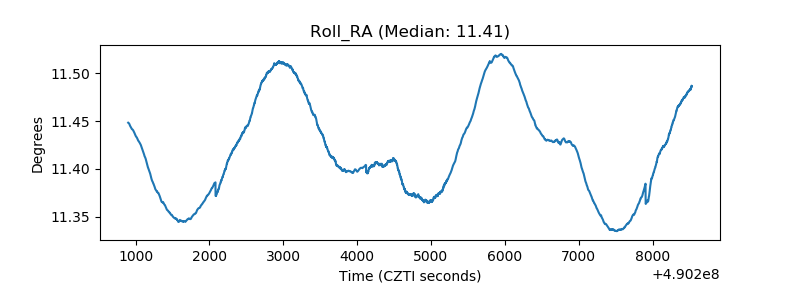 |
| Veto Counter | 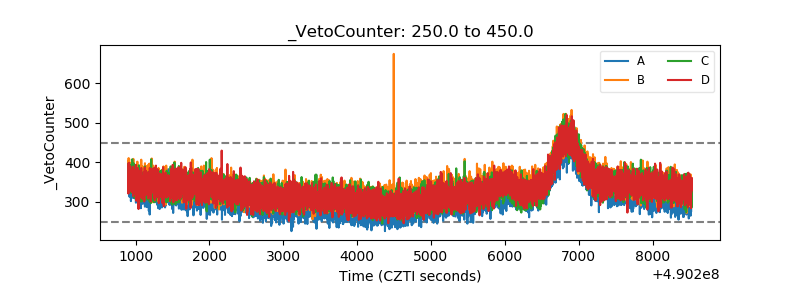 |