| Param | Original file | Final file |
|---|---|---|
| Filename | modeM0/AS1A13_003T01_9000006486_52982cztM0_level2.fits | modeM0/AS1A13_003T01_9000006486_52982cztM0_level2_quad_clean.evt |
| Size (bytes) | 922,760,640 | 92,249,280 |
| Size | 880.0 MB | 88.0 MB |
| Events in quadrant A | 12,755,346 | 357,587 |
| Events in quadrant B | 3,933,779 | 779,830 |
| Events in quadrant C | 7,908,729 | 586,552 |
| Events in quadrant D | 8,973,477 | 541,599 |
| Mode M0 | |||
|---|---|---|---|
| Quadrant | BADHDUFLAG | Total packets | Discarded packets |
| A | 0 | 43029 | 1 |
| B | 0 | 17022 | 0 |
| C | 0 | 28699 | 0 |
| D | 0 | 31839 | 0 |
| Mode SS | |||
|---|---|---|---|
| Quadrant | BADHDUFLAG | Total packets | Discarded packets |
| A | 0 | 152 | 0 |
| B | 0 | 152 | 0 |
| C | 0 | 152 | 0 |
| D | 0 | 152 | 0 |
| Quadrant | Total seconds | Saturated seconds | Saturation percentage |
|---|---|---|---|
| A | 7577 | 4010 | 52.923321% |
| B | 7577 | 108 | 1.425366% |
| C | 7578 | 1266 | 16.706255% |
| D | 7578 | 1506 | 19.873317% |
Noise dominated data is calculated using 1-second bins in cleaned event files. If a bin has >2000 counts, and if more than 50% of those come from <1% of pixels, then it is considered to be noise-dominated and hence unusable.
| Quadrant | # 1 sec bins | Bins with >0 counts | Bins with >2000 counts | High rate bins dominated by noise | Noise dominated (total time) | Noise dominated (detector-on time) | Marked lightcurve |
|---|---|---|---|---|---|---|---|
| A | 7577 | 7576 | 3336 | 3336 | 44.03% | 44.03% | 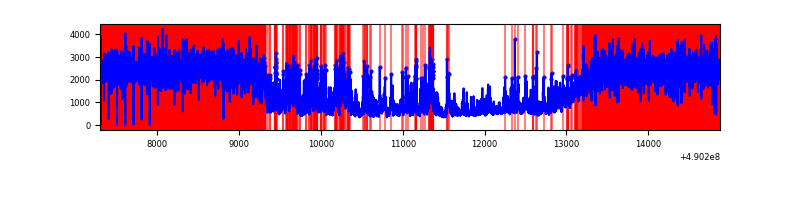 |
| B | 7577 | 7577 | 41 | 41 | 0.54% | 0.54% | 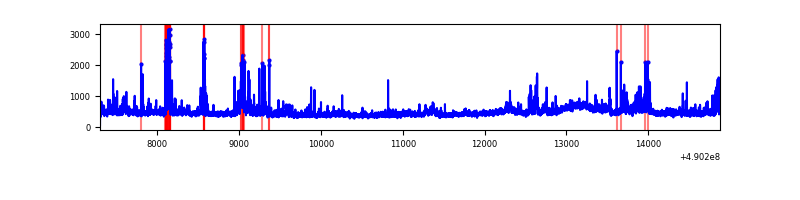 |
| C | 7578 | 7578 | 1153 | 1153 | 15.22% | 15.22% | 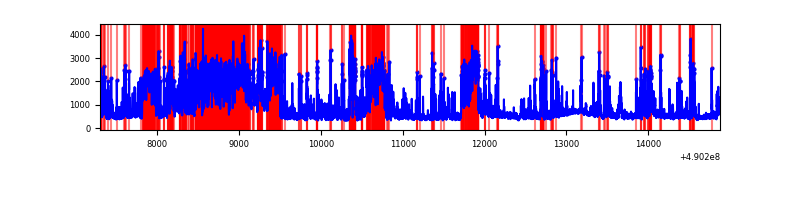 |
| D | 7578 | 7578 | 1372 | 1372 | 18.11% | 18.11% | 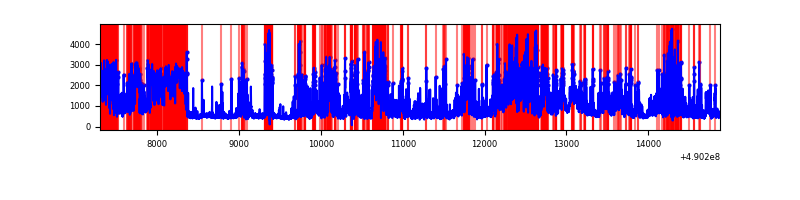 |
Top three noisy pixels from each quadrant. If the there are fewer than three noisy pixels in the level2.evt file, extra rows are filled as -1
| Pixel properties | Quadrant properties | ||||||
|---|---|---|---|---|---|---|---|
| Quadrant | DetID | PixID | Counts | Sigma | Mean | Median | Sigma |
| A | 9 | 191 | 10005457 | 73022.02 | 545 | 532 | 137.0 |
| A | 0 | 8 | 119799 | 870.48 | 545 | 532 | 137.0 |
| A | 10 | 253 | 96848 | 702.97 | 545 | 532 | 137.0 |
| B | 10 | 128 | 214003 | 1215.86 | 821 | 793 | 175.4 |
| B | 10 | 63 | 105536 | 597.31 | 821 | 793 | 175.4 |
| B | 10 | 254 | 73838 | 416.55 | 821 | 793 | 175.4 |
| C | 9 | 38 | 1233255 | 5996.11 | 756 | 751 | 205.6 |
| C | 2 | 12 | 1106796 | 5380.89 | 756 | 751 | 205.6 |
| C | 4 | 5 | 1002187 | 4871.97 | 756 | 751 | 205.6 |
| D | 0 | 5 | 2611190 | 12427.87 | 738 | 705 | 210.1 |
| D | 8 | 176 | 1727965 | 8223.06 | 738 | 705 | 210.1 |
| D | 2 | 62 | 514489 | 2446.0 | 738 | 705 | 210.1 |
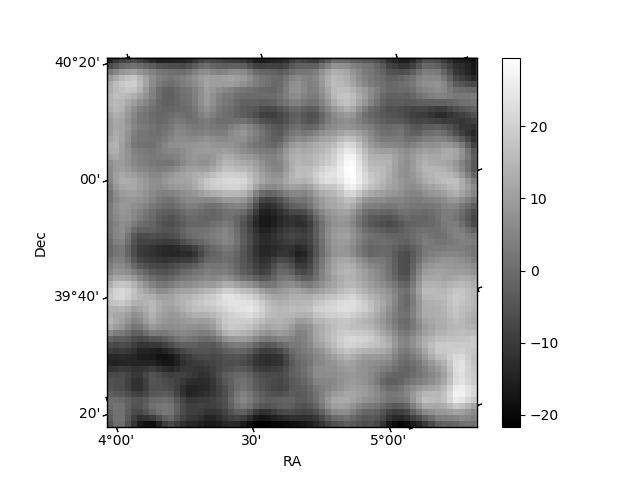
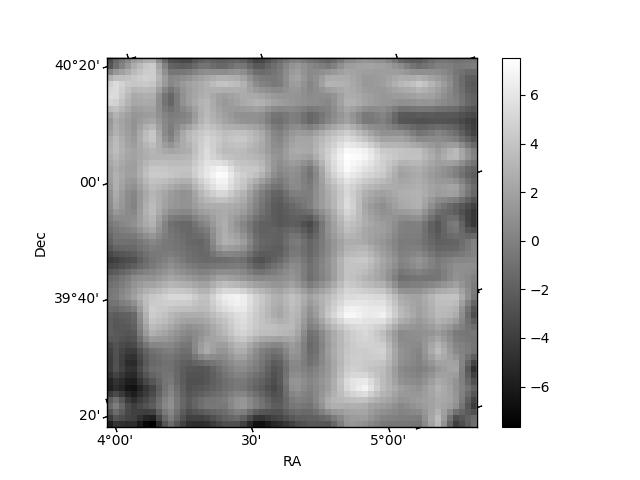
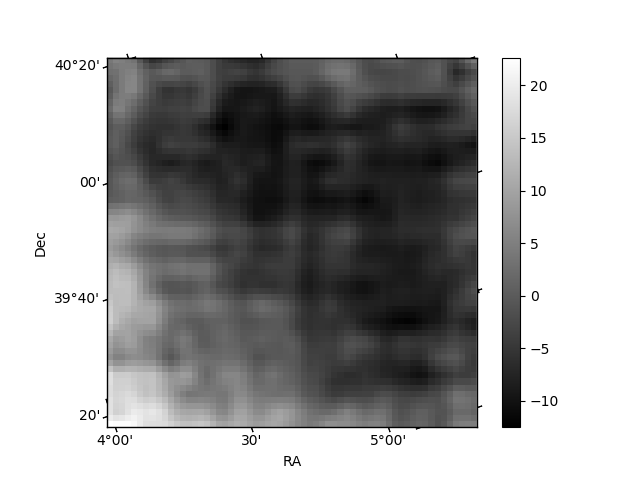
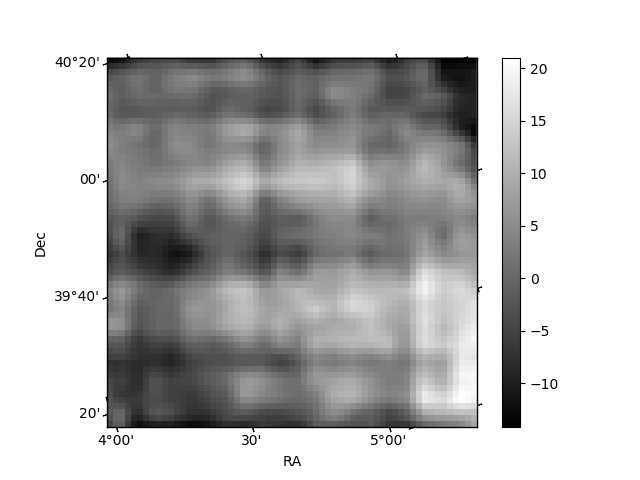
Histogram calculated using DETX and DETY for each event in the final _common_clean file
| Quadrant A | 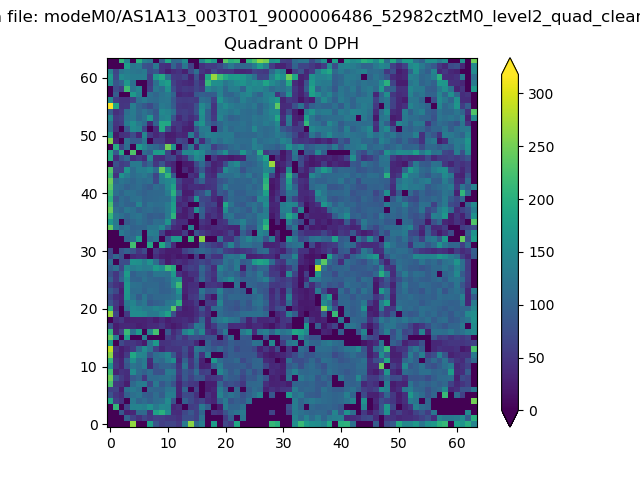 |
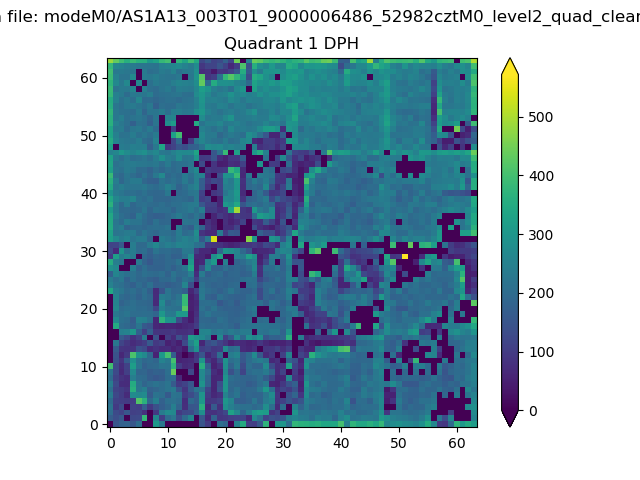 |
Quadrant B |
|---|---|---|---|
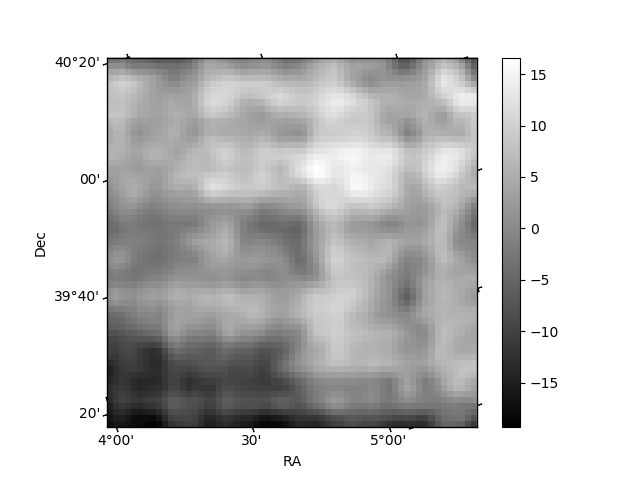
| Quadrant D | 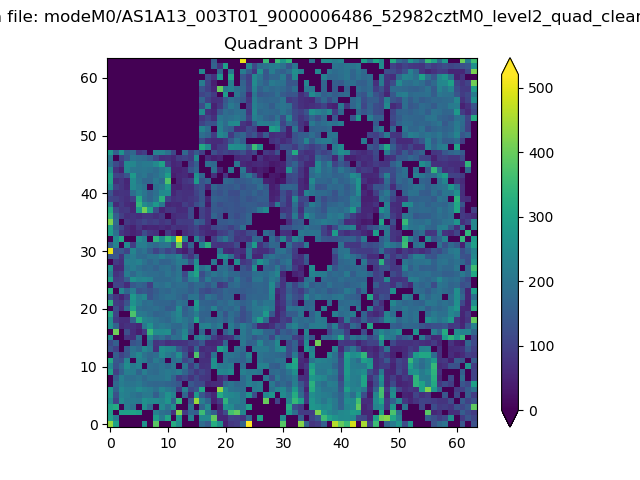 |
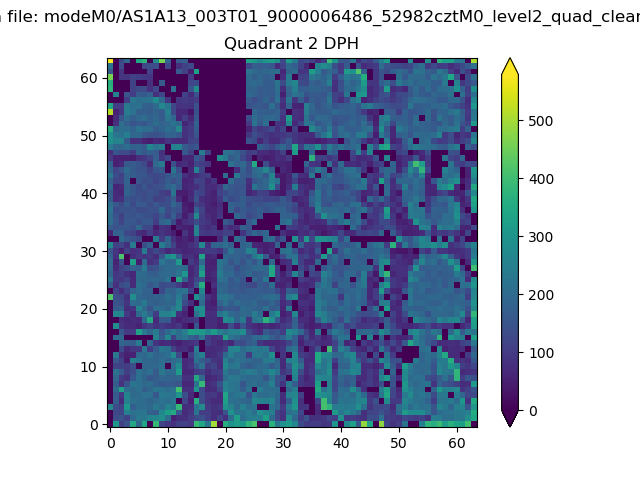 |
Quadrant C |
| Plot type | Count rate plots | Images |
|---|---|---|
| Comparison with Poisson distribution Blue bars denote a histogram of data divided into 1 sec bins. Red curve is a Poisson curve with rate = median count rate of data. |
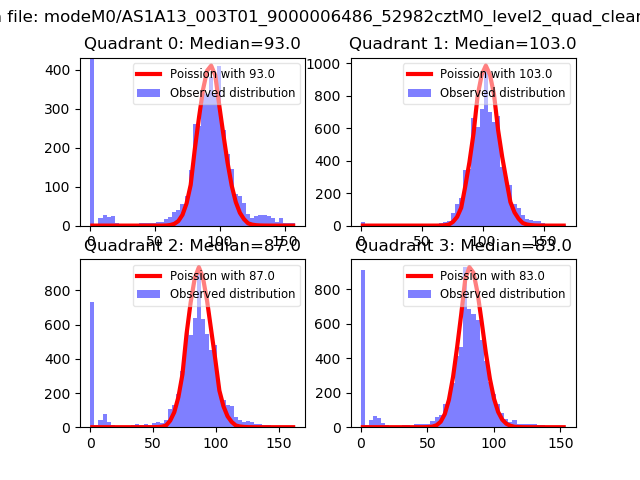 |
 |
| Quadrant-wise count rates Data is divided into 100 sec bins |
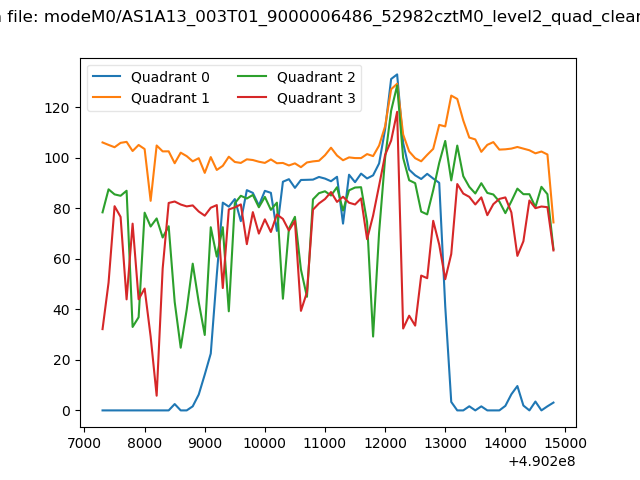 |
|
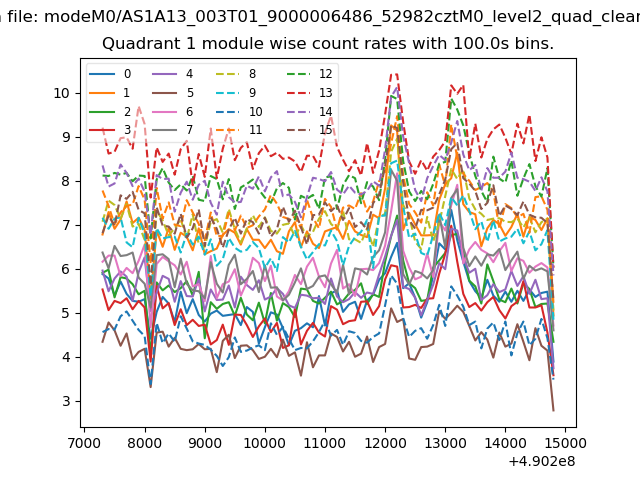
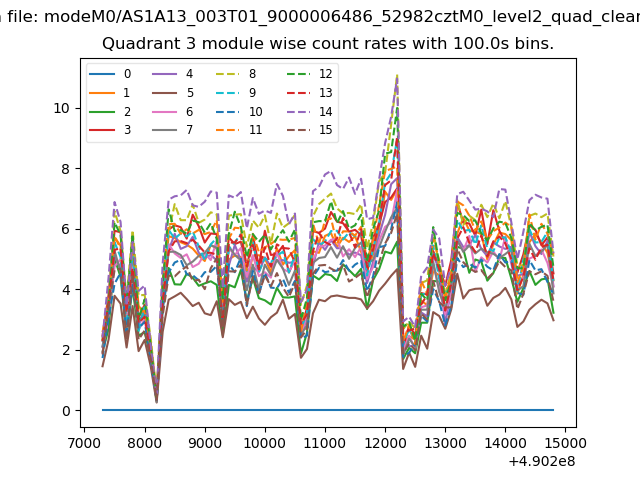
| Module-wise count rates for Quadrant A Data is divided into 100 sec bins |
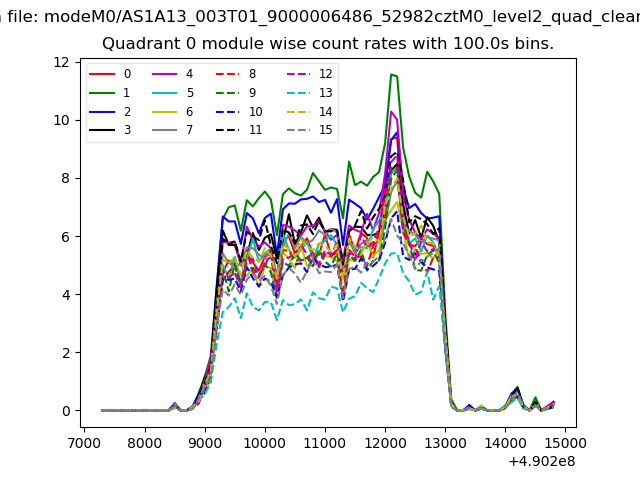 |
 |
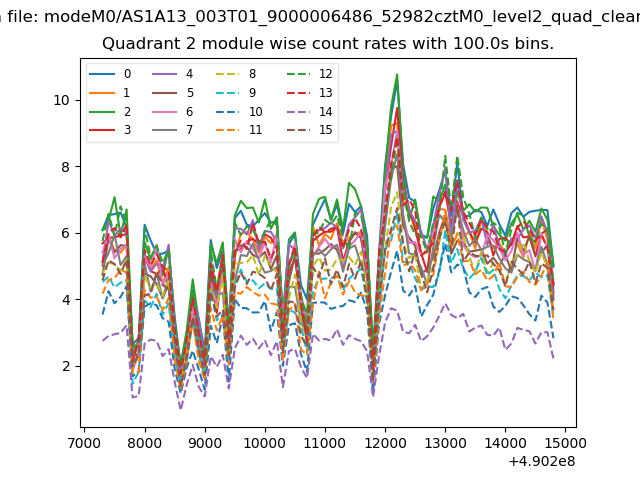
| Module-wise count rates for Quadrant B Data is divided into 100 sec bins |
 |
 |
| Module-wise count rates for Quadrant C Data is divided into 100 sec bins |
 |
 |
| Module-wise count rates for Quadrant D Data is divided into 100 sec bins |
 |
 |
| Parameter | Plot |
|---|---|
| CZT HV Monitor | 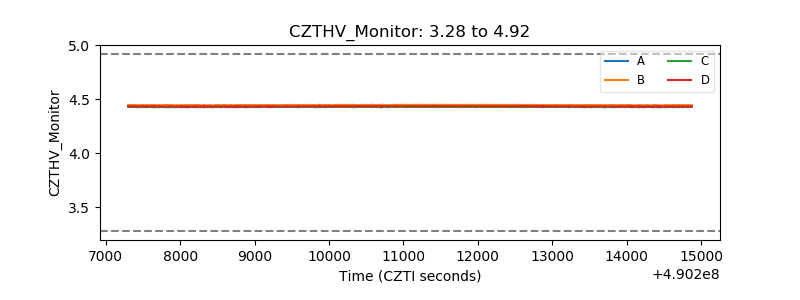 |
| D_VDD | 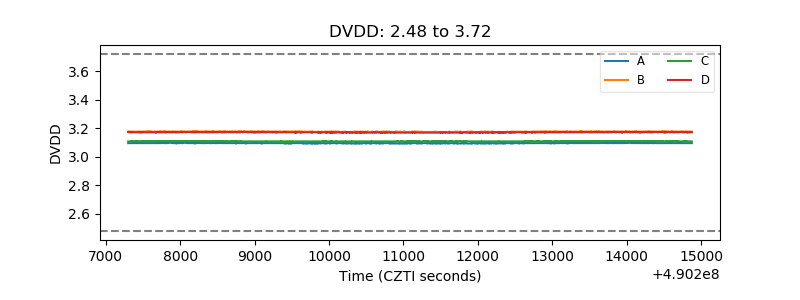 |
| Temperature 1 | 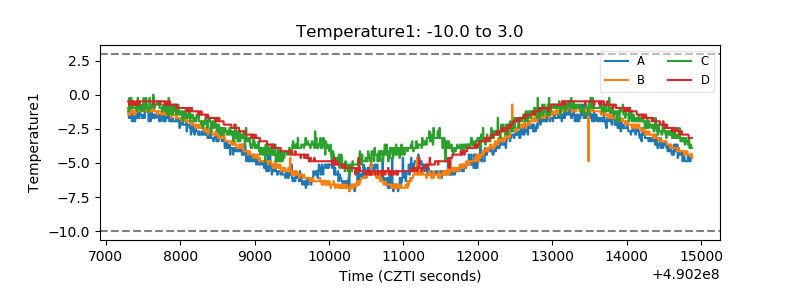 |
| Veto HV Monitor |  |
| Veto LLD | 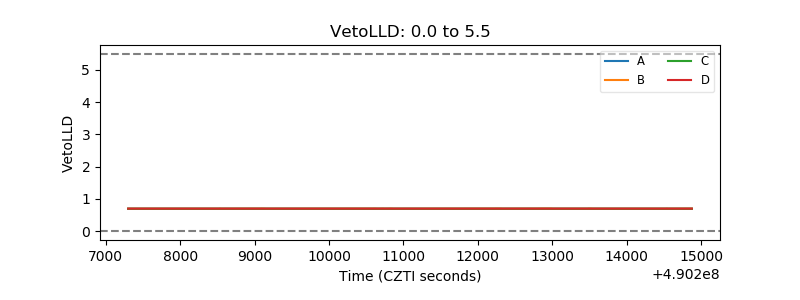 |
| Alpha Counter | 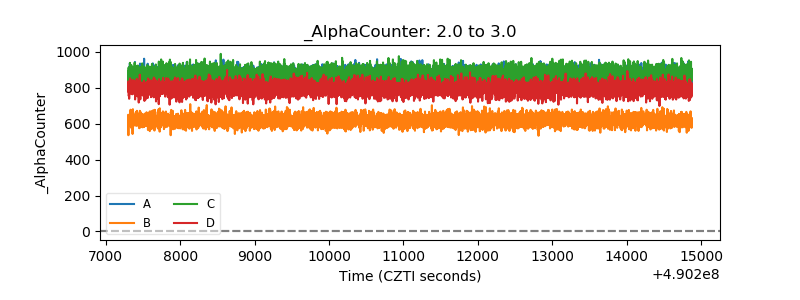 |
| _CPM_Rate | 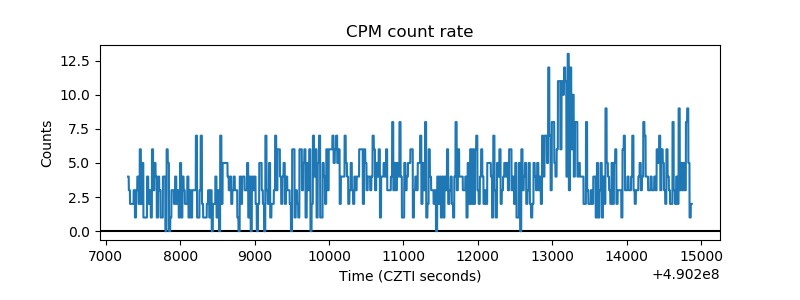 |
| CZT Counter | 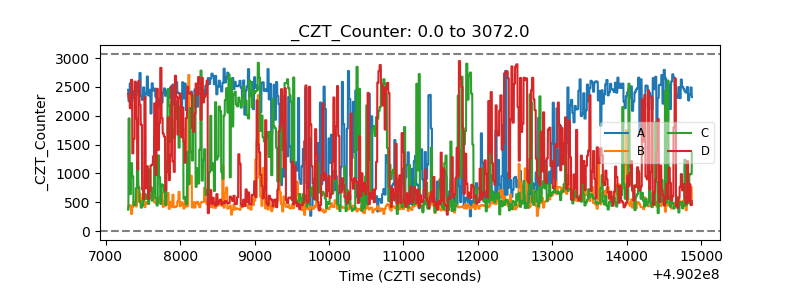 |
| +2.5 Volts monitor |  |
| +5 Volts monitor |  |
| _ROLL_ROT |  |
| _Roll_DEC | 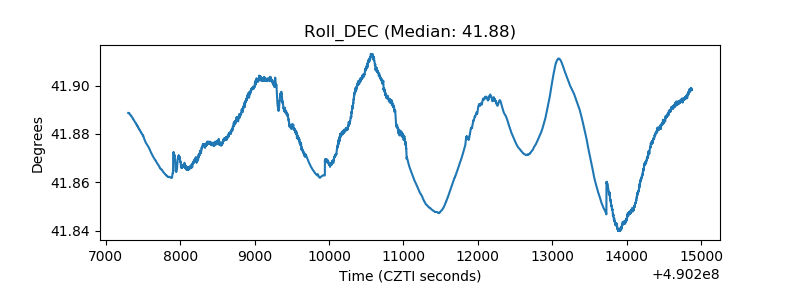 |
| _Roll_RA |  |
| Veto Counter |  |