| Param | Original file | Final file |
|---|---|---|
| Filename | modeM0/AS1A13_003T01_9000006486_52988cztM0_level2.fits | modeM0/AS1A13_003T01_9000006486_52988cztM0_level2_quad_clean.evt |
| Size (bytes) | 859,872,960 | 77,068,800 |
| Size | 820.0 MB | 73.5 MB |
| Events in quadrant A | 14,925,860 | 143,621 |
| Events in quadrant B | 3,054,291 | 687,086 |
| Events in quadrant C | 5,149,370 | 576,626 |
| Events in quadrant D | 8,192,923 | 468,961 |
| Mode M9 | |||
|---|---|---|---|
| Quadrant | BADHDUFLAG | Total packets | Discarded packets |
| A | 0 | 10 | 0 |
| B | 0 | 10 | 0 |
| C | 0 | 10 | 0 |
| D | 0 | 10 | 0 |
| Mode M0 | |||
|---|---|---|---|
| Quadrant | BADHDUFLAG | Total packets | Discarded packets |
| A | 0 | 48769 | 1 |
| B | 0 | 14028 | 1 |
| C | 0 | 19884 | 1 |
| D | 0 | 28891 | 1 |
| Mode SS | |||
|---|---|---|---|
| Quadrant | BADHDUFLAG | Total packets | Discarded packets |
| A | 0 | 134 | 0 |
| B | 0 | 134 | 0 |
| C | 0 | 134 | 0 |
| D | 0 | 134 | 0 |
| Quadrant | Total seconds | Saturated seconds | Saturation percentage |
|---|---|---|---|
| A | 6552 | 5264 | 80.341880% |
| B | 6552 | 71 | 1.083639% |
| C | 6552 | 428 | 6.532357% |
| D | 6552 | 1460 | 22.283272% |
Noise dominated data is calculated using 1-second bins in cleaned event files. If a bin has >2000 counts, and if more than 50% of those come from <1% of pixels, then it is considered to be noise-dominated and hence unusable.
| Quadrant | # 1 sec bins | Bins with >0 counts | Bins with >2000 counts | High rate bins dominated by noise | Noise dominated (total time) | Noise dominated (detector-on time) | Marked lightcurve |
|---|---|---|---|---|---|---|---|
| A | 7532 | 6553 | 4704 | 4704 | 62.45% | 71.78% | 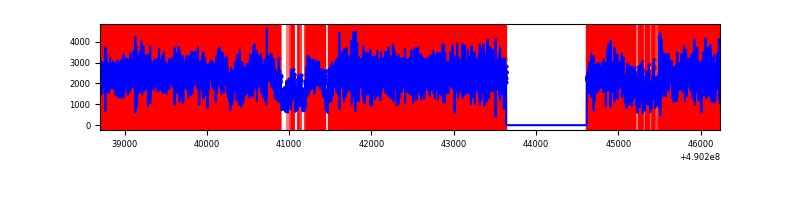 |
| B | 7532 | 6553 | 15 | 15 | 0.20% | 0.23% | 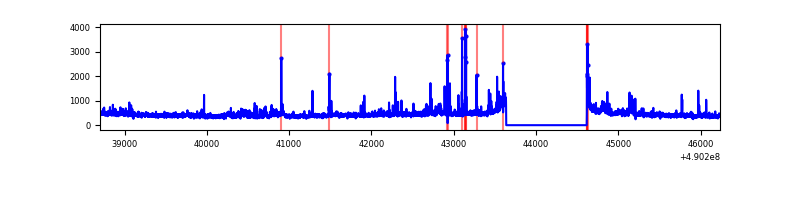 |
| C | 7532 | 6553 | 383 | 383 | 5.08% | 5.84% | 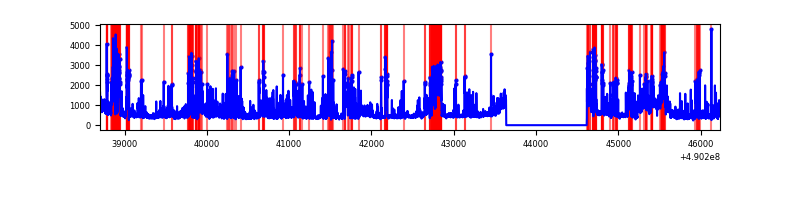 |
| D | 7532 | 6553 | 1308 | 1308 | 17.37% | 19.96% | 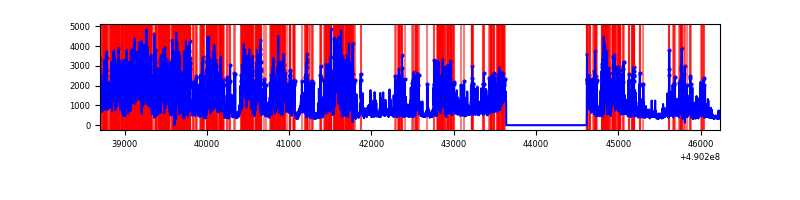 |
Top three noisy pixels from each quadrant. If the there are fewer than three noisy pixels in the level2.evt file, extra rows are filled as -1
| Pixel properties | Quadrant properties | ||||||
|---|---|---|---|---|---|---|---|
| Quadrant | DetID | PixID | Counts | Sigma | Mean | Median | Sigma |
| A | 9 | 191 | 11956987 | 113436.04 | 409 | 400 | 105.4 |
| A | 4 | 249 | 629063 | 5964.33 | 409 | 400 | 105.4 |
| A | 15 | 190 | 518120 | 4911.78 | 409 | 400 | 105.4 |
| B | 10 | 254 | 96539 | 644.53 | 684 | 658 | 148.8 |
| B | 10 | 63 | 81135 | 540.98 | 684 | 658 | 148.8 |
| B | 1 | 255 | 52368 | 347.6 | 684 | 658 | 148.8 |
| C | 1 | 241 | 479953 | 2650.03 | 647 | 640 | 180.9 |
| C | 15 | 234 | 454123 | 2507.22 | 647 | 640 | 180.9 |
| C | 9 | 38 | 411968 | 2274.16 | 647 | 640 | 180.9 |
| D | 0 | 5 | 2228218 | 12807.94 | 600 | 572 | 173.9 |
| D | 8 | 176 | 1740274 | 10002.48 | 600 | 572 | 173.9 |
| D | 2 | 62 | 486388 | 2793.22 | 600 | 572 | 173.9 |
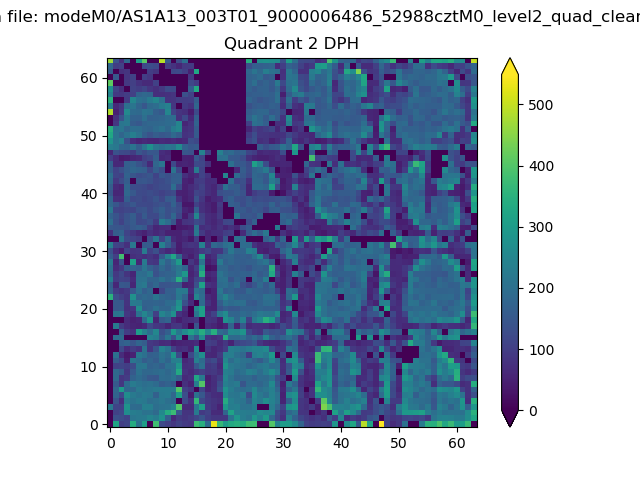
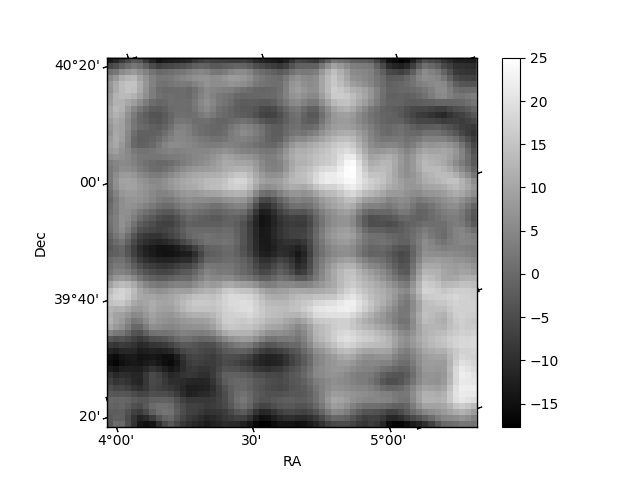
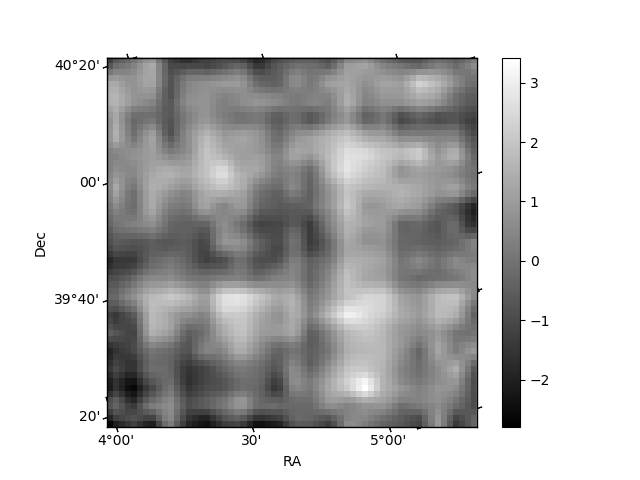
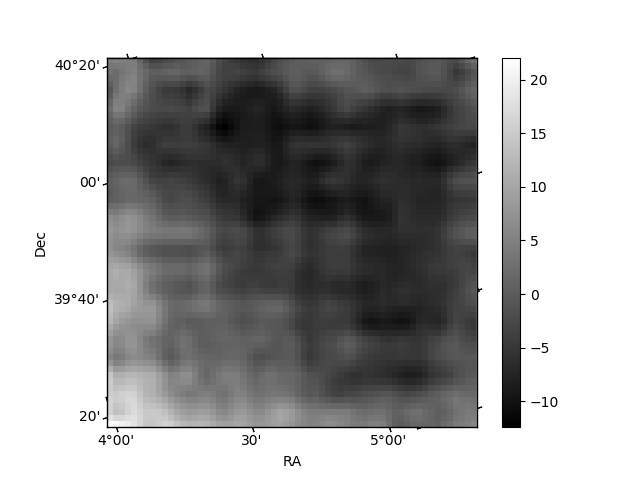
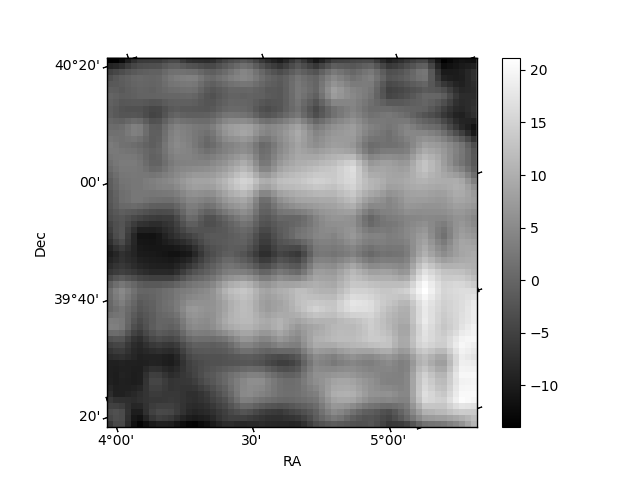
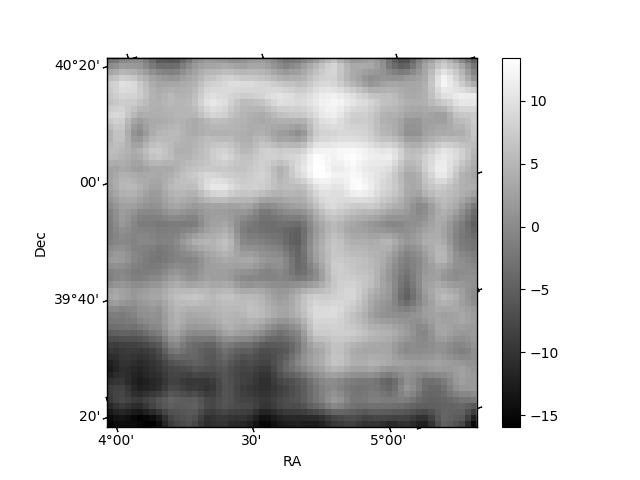
Histogram calculated using DETX and DETY for each event in the final _common_clean file
| Quadrant A | 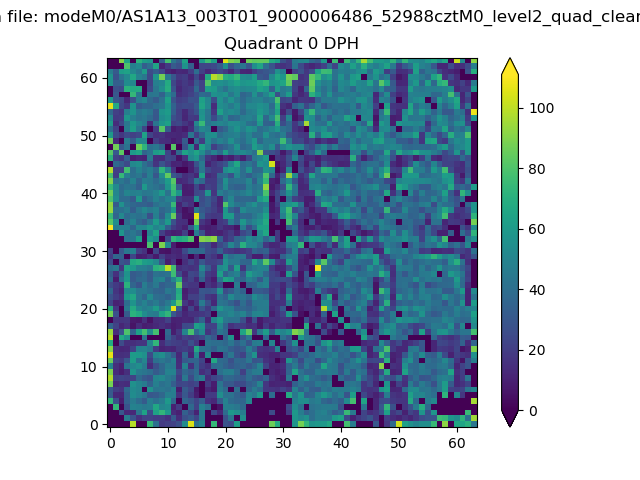 |
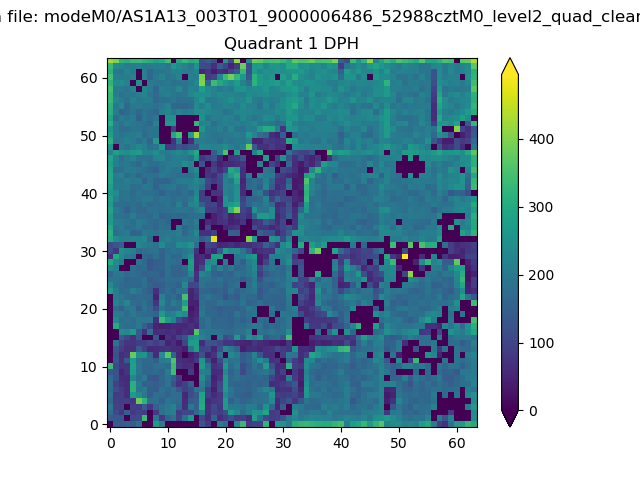 |
Quadrant B |
|---|---|---|---|
| Quadrant D | 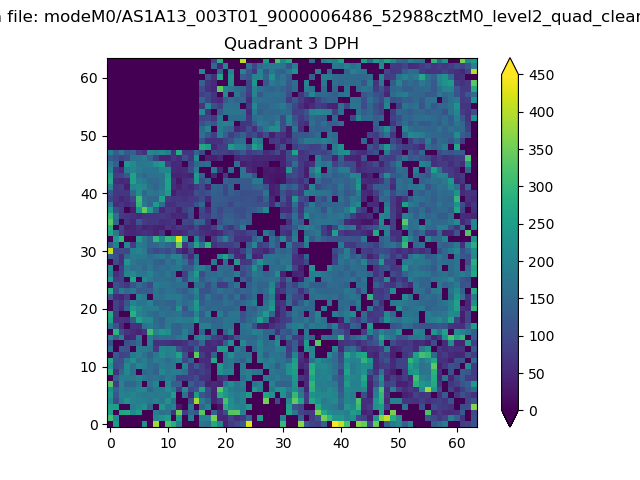 |
 |
Quadrant C |
| Plot type | Count rate plots | Images |
|---|---|---|
| Comparison with Poisson distribution Blue bars denote a histogram of data divided into 1 sec bins. Red curve is a Poisson curve with rate = median count rate of data. |
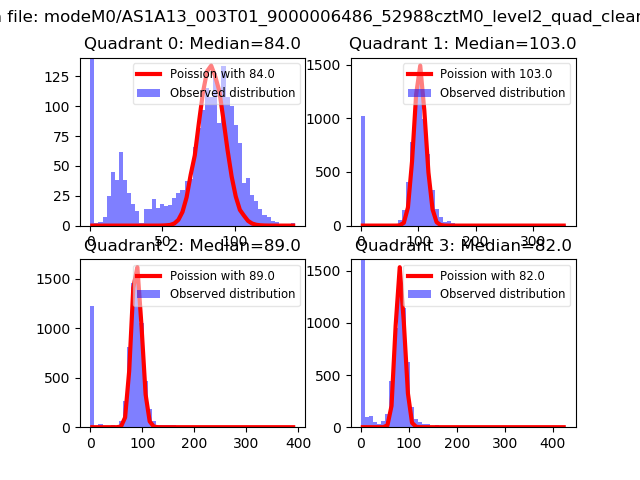 |
 |
| Quadrant-wise count rates Data is divided into 100 sec bins |
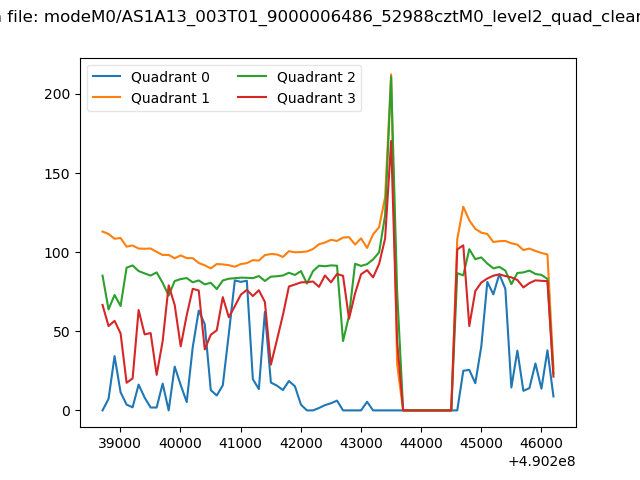 |
|
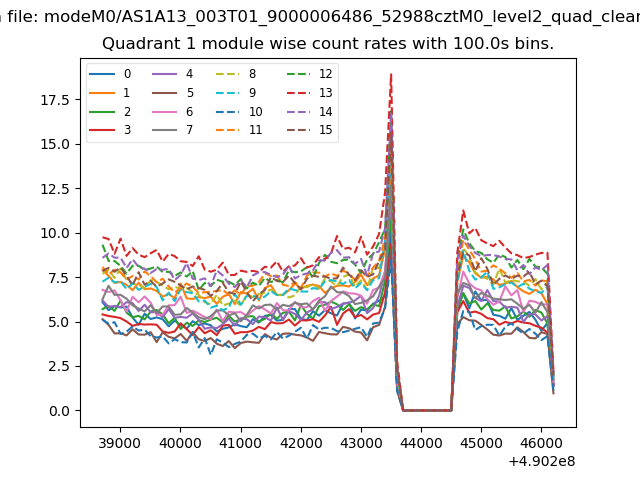
| Module-wise count rates for Quadrant A Data is divided into 100 sec bins |
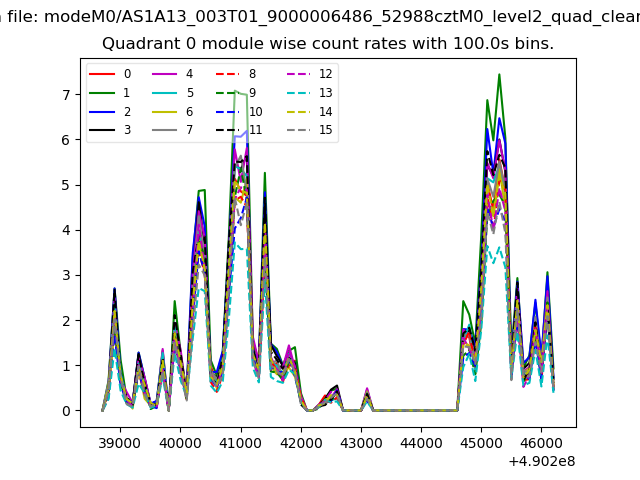 |
 |
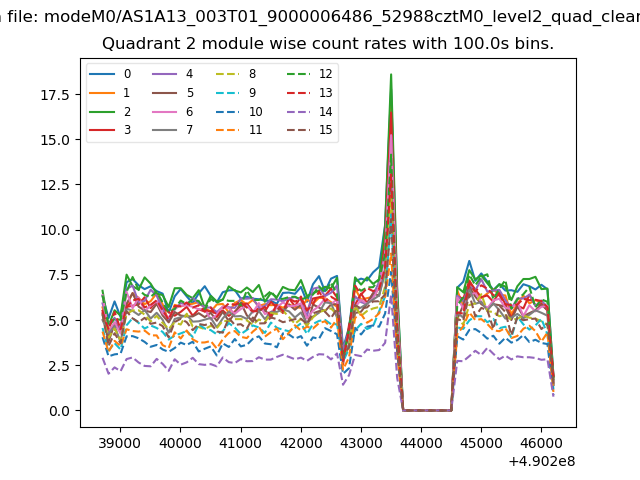
| Module-wise count rates for Quadrant B Data is divided into 100 sec bins |
 |
 |
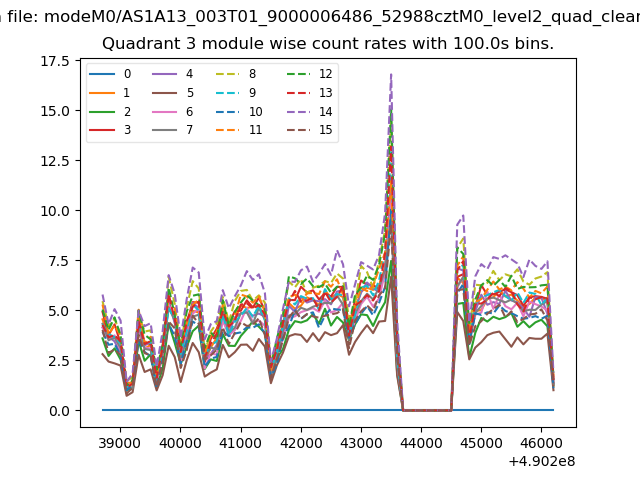
| Module-wise count rates for Quadrant C Data is divided into 100 sec bins |
 |
 |
| Module-wise count rates for Quadrant D Data is divided into 100 sec bins |
 |
 |
| Parameter | Plot |
|---|---|
| CZT HV Monitor | 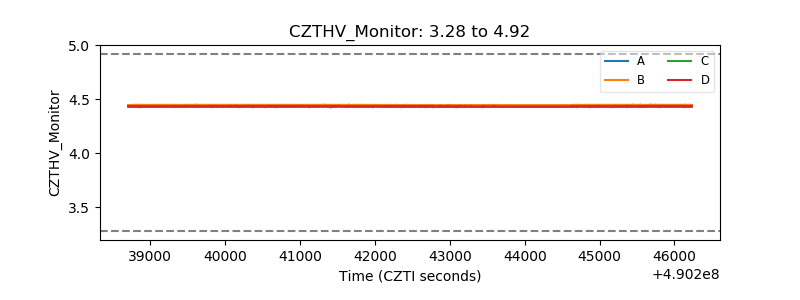 |
| D_VDD | 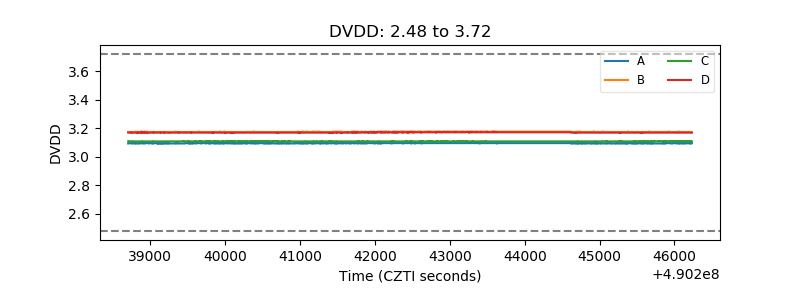 |
| Temperature 1 | 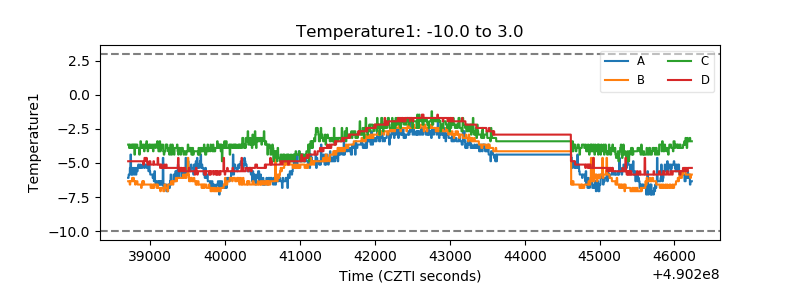 |
| Veto HV Monitor | 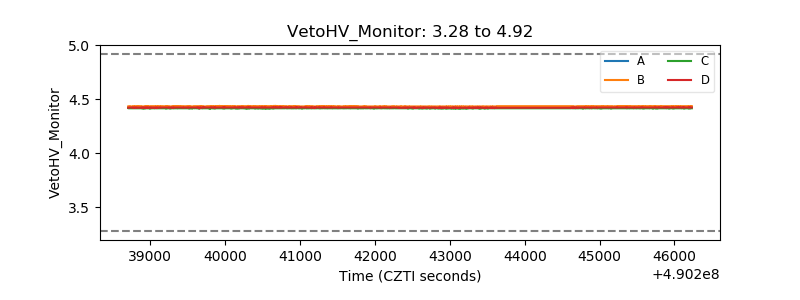 |
| Veto LLD | 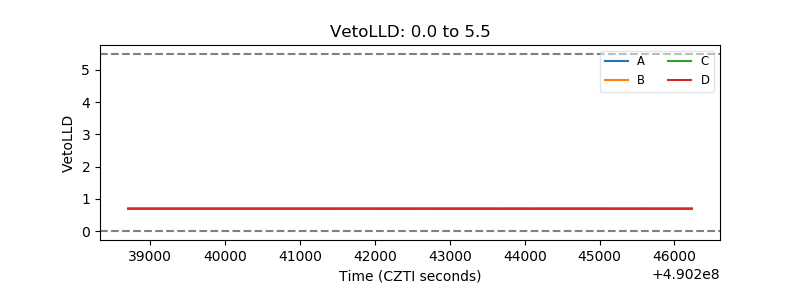 |
| Alpha Counter | 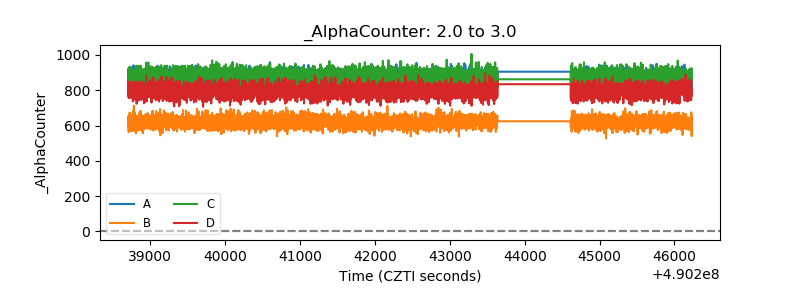 |
| _CPM_Rate | 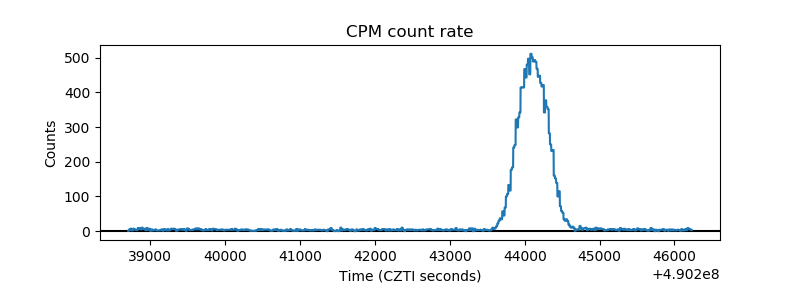 |
| CZT Counter | 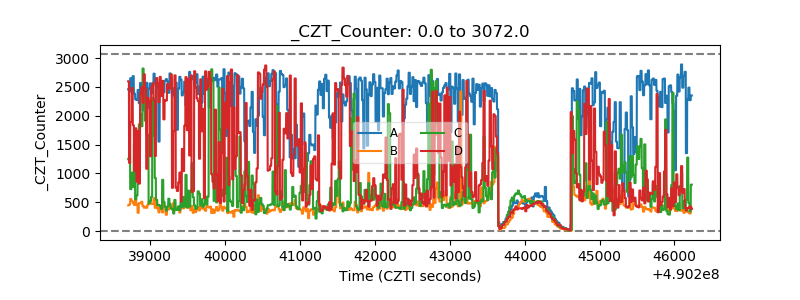 |
| +2.5 Volts monitor |  |
| +5 Volts monitor | 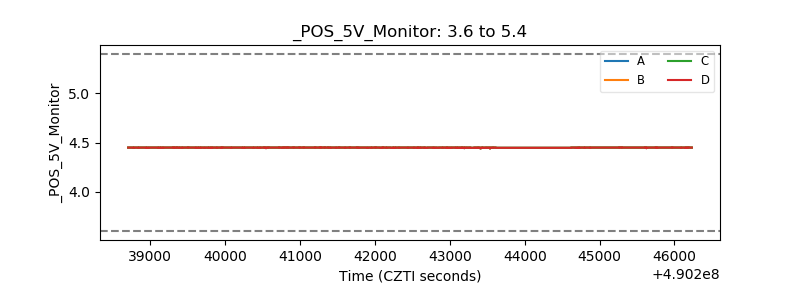 |
| _ROLL_ROT | 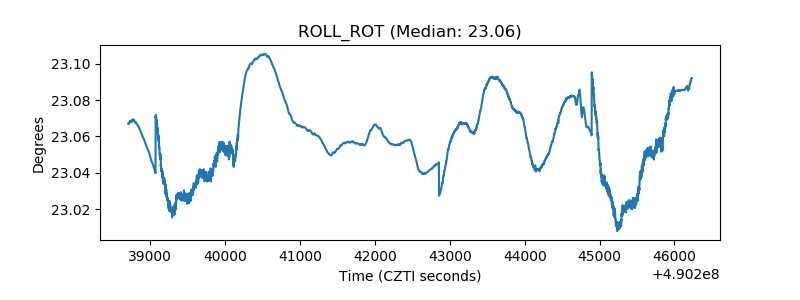 |
| _Roll_DEC | 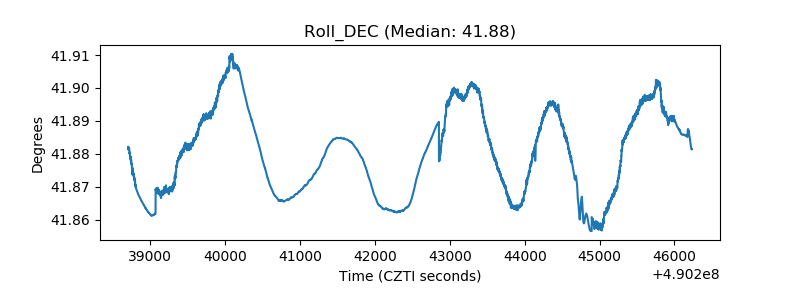 |
| _Roll_RA | 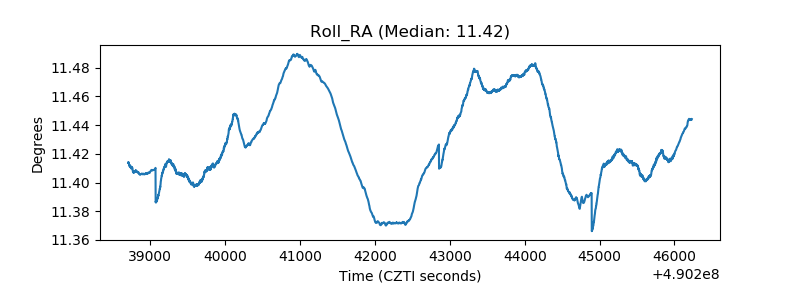 |
| Veto Counter | 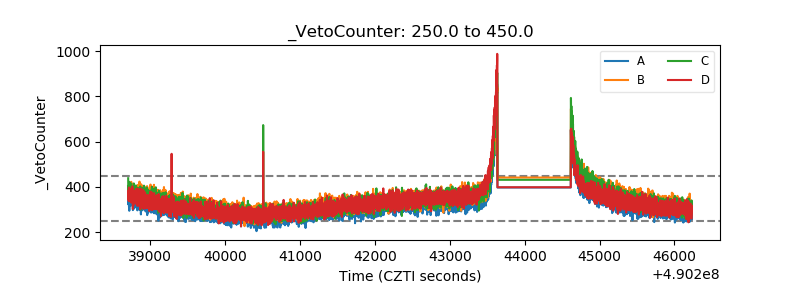 |