| Param | Original file | Final file |
|---|---|---|
| Filename | modeM0/AS1A13_003T01_9000006486_52989cztM0_level2.fits | modeM0/AS1A13_003T01_9000006486_52989cztM0_level2_quad_clean.evt |
| Size (bytes) | 630,342,720 | 57,124,800 |
| Size | 601.1 MB | 54.5 MB |
| Events in quadrant A | 11,431,038 | 49,876 |
| Events in quadrant B | 2,773,739 | 512,571 |
| Events in quadrant C | 4,352,422 | 421,875 |
| Events in quadrant D | 4,391,654 | 397,142 |
| Mode M9 | |||
|---|---|---|---|
| Quadrant | BADHDUFLAG | Total packets | Discarded packets |
| A | 0 | 12 | 1 |
| B | 0 | 11 | 0 |
| C | 0 | 11 | 0 |
| D | 0 | 11 | 0 |
| Mode M0 | |||
|---|---|---|---|
| Quadrant | BADHDUFLAG | Total packets | Discarded packets |
| A | 0 | 44544 | 7432 |
| B | 0 | 13498 | 1609 |
| C | 0 | 18503 | 2038 |
| D | 0 | 18582 | 1915 |
| Mode SS | |||
|---|---|---|---|
| Quadrant | BADHDUFLAG | Total packets | Discarded packets |
| A | 0 | 114 | 10 |
| B | 0 | 114 | 10 |
| C | 0 | 116 | 8 |
| D | 0 | 114 | 10 |
| Quadrant | Total seconds | Saturated seconds | Saturation percentage |
|---|---|---|---|
| A | 4720 | 4266 | 90.381356% |
| B | 5032 | 119 | 2.364865% |
| C | 4998 | 390 | 7.803121% |
| D | 5040 | 473 | 9.384921% |
Noise dominated data is calculated using 1-second bins in cleaned event files. If a bin has >2000 counts, and if more than 50% of those come from <1% of pixels, then it is considered to be noise-dominated and hence unusable.
| Quadrant | # 1 sec bins | Bins with >0 counts | Bins with >2000 counts | High rate bins dominated by noise | Noise dominated (total time) | Noise dominated (detector-on time) | Marked lightcurve |
|---|---|---|---|---|---|---|---|
| A | 6855 | 4892 | 3706 | 3706 | 54.06% | 75.76% |  |
| B | 6856 | 5218 | 50 | 50 | 0.73% | 0.96% | 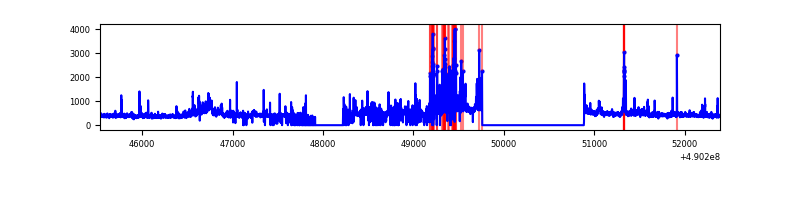 |
| C | 6856 | 5197 | 382 | 382 | 5.57% | 7.35% | 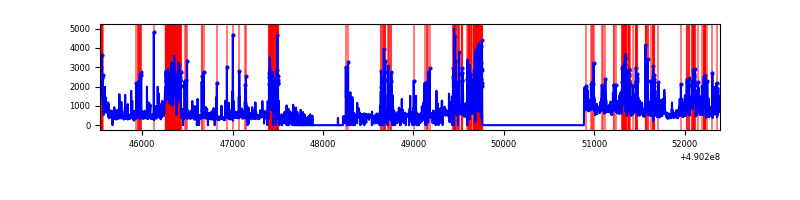 |
| D | 6856 | 5235 | 375 | 375 | 5.47% | 7.16% | 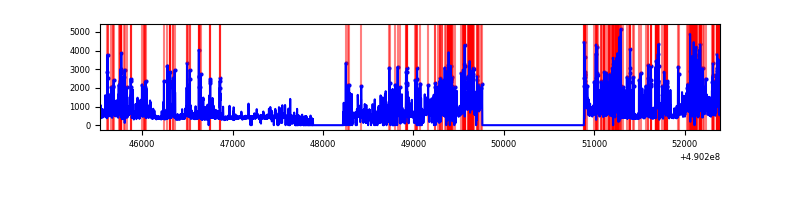 |
Top three noisy pixels from each quadrant. If the there are fewer than three noisy pixels in the level2.evt file, extra rows are filled as -1
| Pixel properties | Quadrant properties | ||||||
|---|---|---|---|---|---|---|---|
| Quadrant | DetID | PixID | Counts | Sigma | Mean | Median | Sigma |
| A | 9 | 191 | 9617128 | 164883.6 | 218 | 212 | 58.3 |
| A | 15 | 190 | 492861 | 8446.55 | 218 | 212 | 58.3 |
| A | 4 | 249 | 362004 | 6202.98 | 218 | 212 | 58.3 |
| B | 10 | 254 | 275653 | 2474.75 | 513 | 496 | 111.2 |
| B | 10 | 63 | 215415 | 1932.97 | 513 | 496 | 111.2 |
| B | 1 | 255 | 55220 | 492.18 | 513 | 496 | 111.2 |
| C | 1 | 241 | 505799 | 3756.67 | 482 | 479 | 134.5 |
| C | 4 | 5 | 500986 | 3720.89 | 482 | 479 | 134.5 |
| C | 9 | 38 | 481625 | 3576.96 | 482 | 479 | 134.5 |
| D | 8 | 176 | 1339691 | 9785.85 | 479 | 458 | 136.9 |
| D | 2 | 62 | 473613 | 3457.37 | 479 | 458 | 136.9 |
| D | 2 | 153 | 253663 | 1850.18 | 479 | 458 | 136.9 |
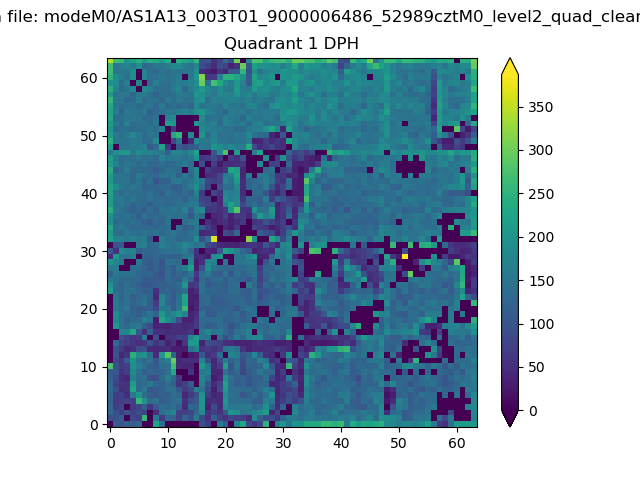
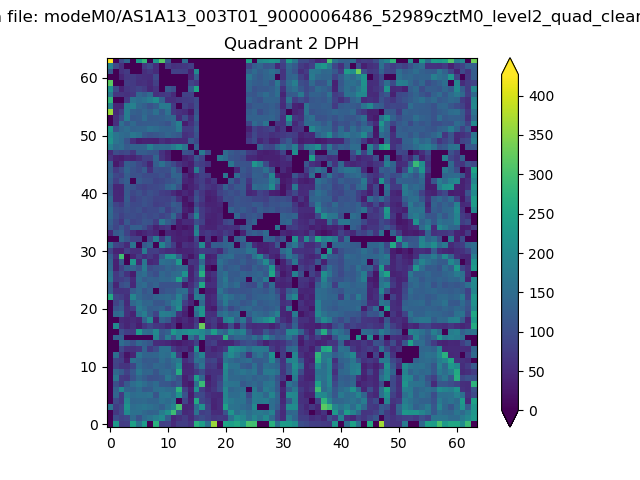
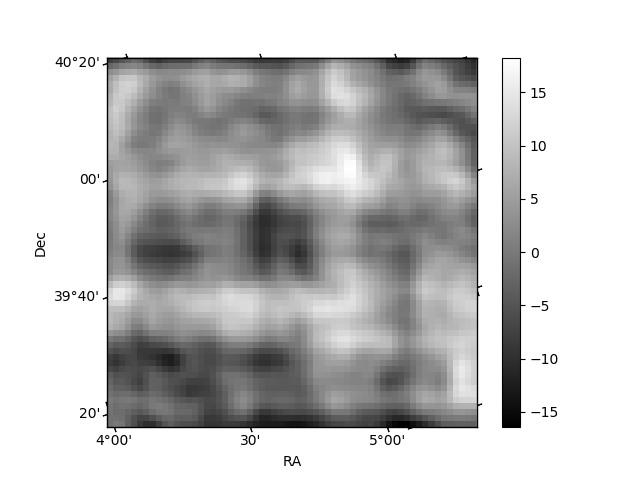
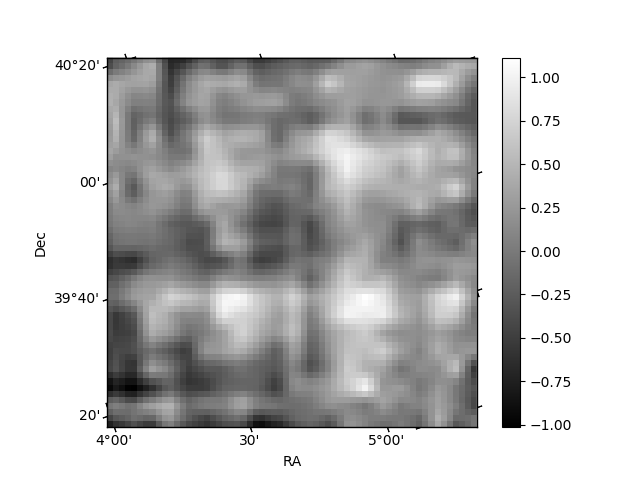
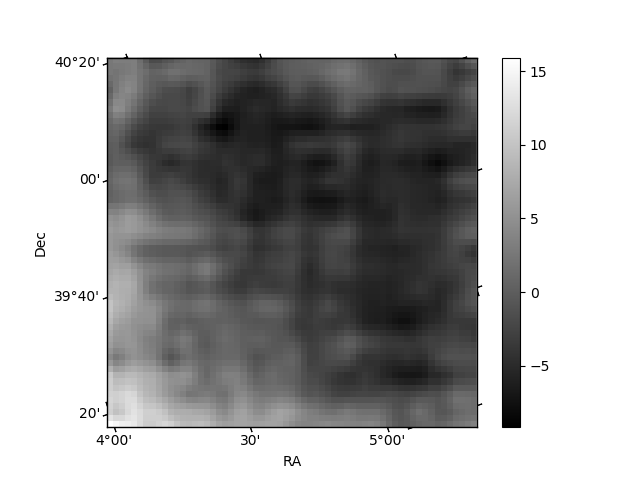
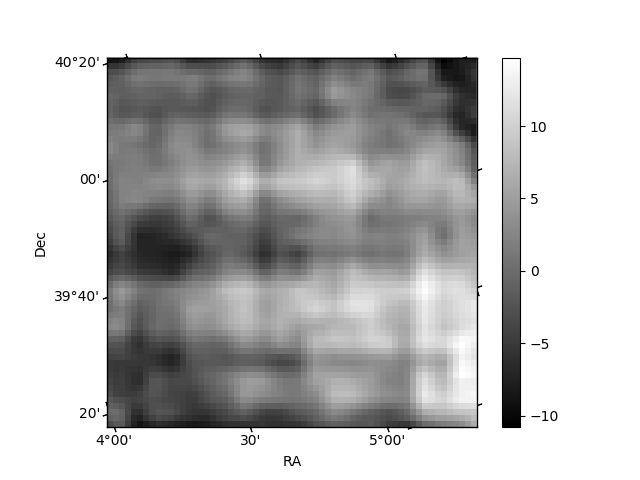
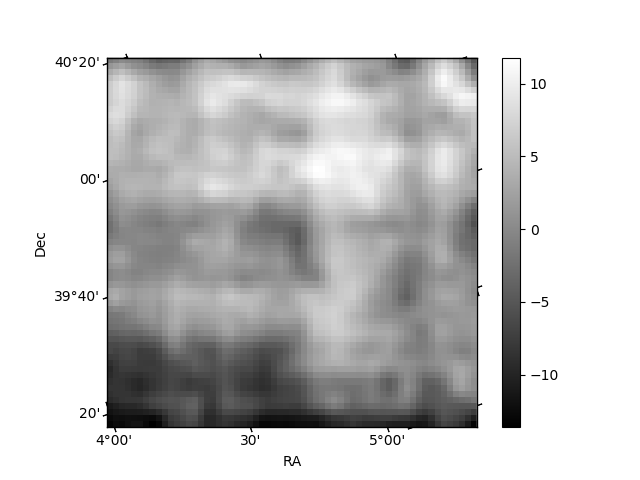
Histogram calculated using DETX and DETY for each event in the final _common_clean file
| Quadrant A | 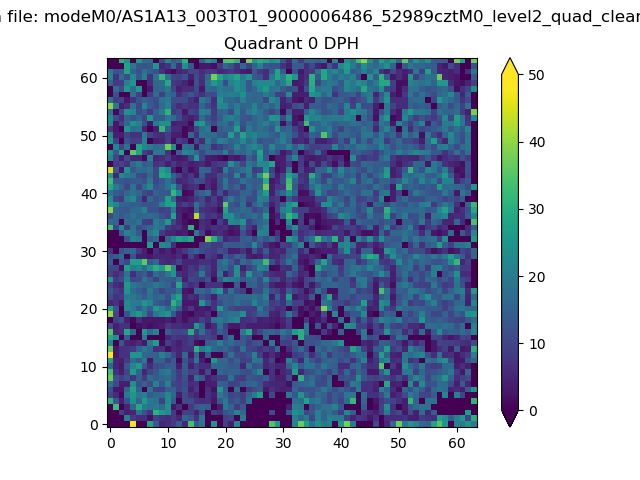 |
 |
Quadrant B |
|---|---|---|---|
| Quadrant D | 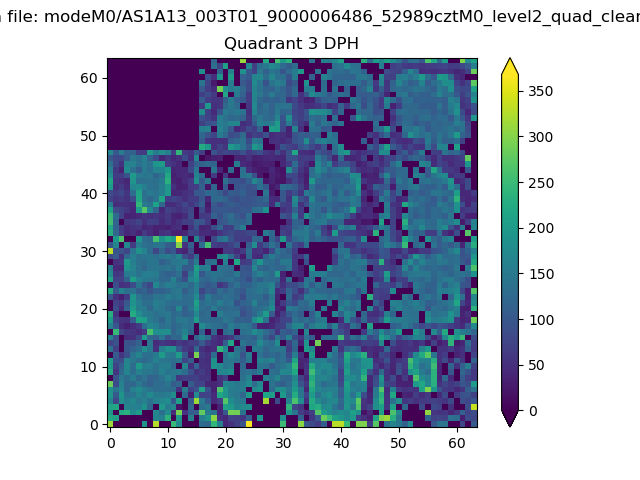 |
 |
Quadrant C |
| Plot type | Count rate plots | Images |
|---|---|---|
| Comparison with Poisson distribution Blue bars denote a histogram of data divided into 1 sec bins. Red curve is a Poisson curve with rate = median count rate of data. |
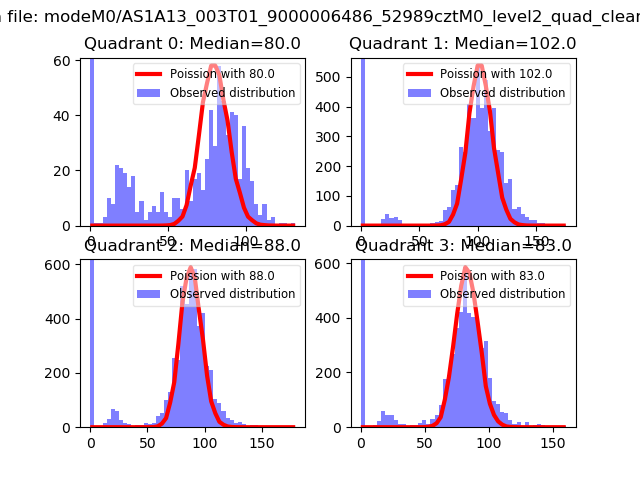 |
 |
| Quadrant-wise count rates Data is divided into 100 sec bins |
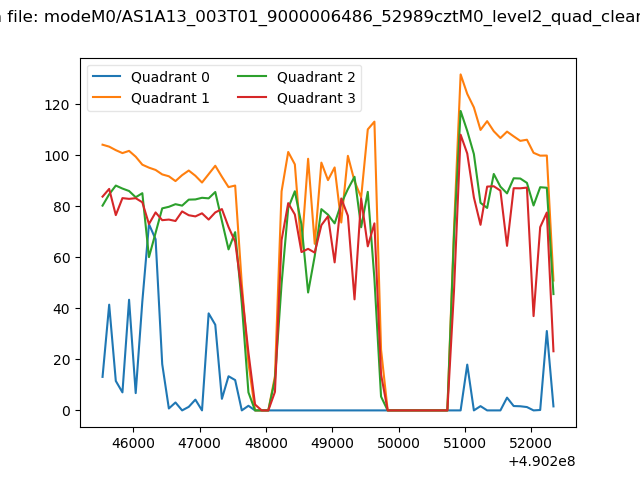 |
|
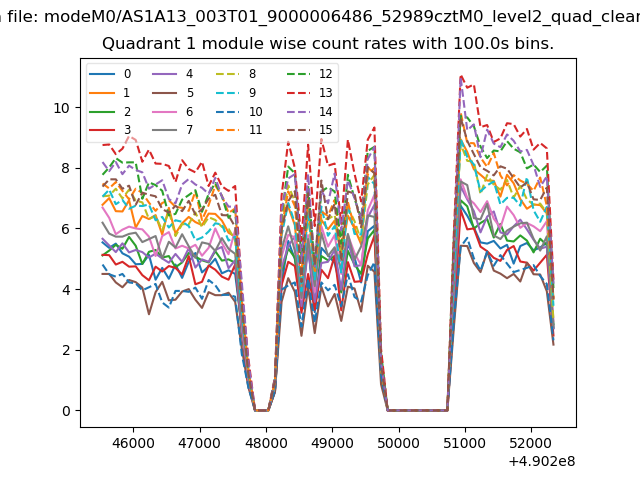
| Module-wise count rates for Quadrant A Data is divided into 100 sec bins |
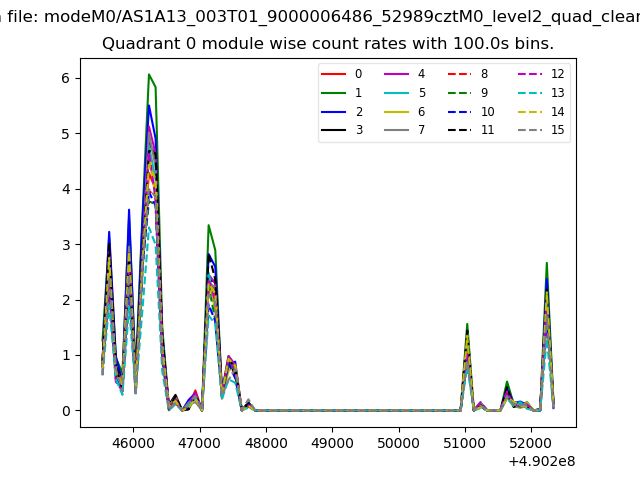 |
 |
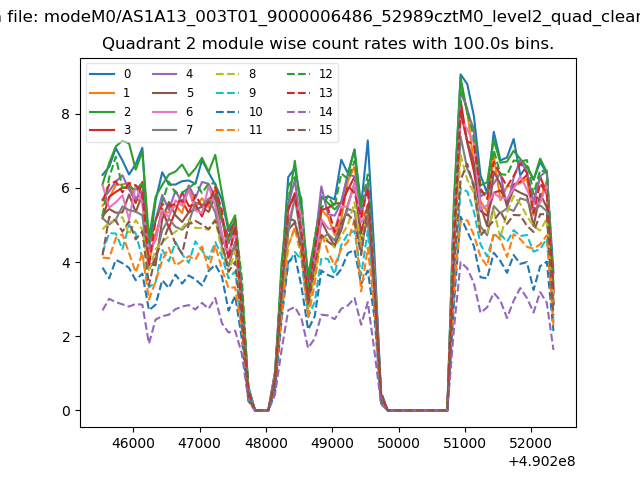
| Module-wise count rates for Quadrant B Data is divided into 100 sec bins |
 |
 |
| Module-wise count rates for Quadrant C Data is divided into 100 sec bins |
 |
 |
| Module-wise count rates for Quadrant D Data is divided into 100 sec bins |
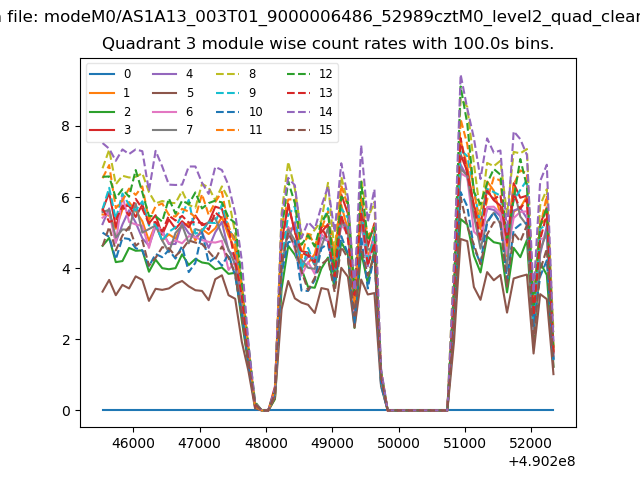 |
 |
| Parameter | Plot |
|---|---|
| CZT HV Monitor | 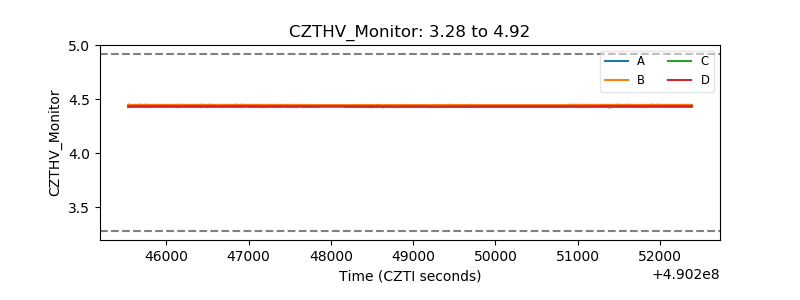 |
| D_VDD | 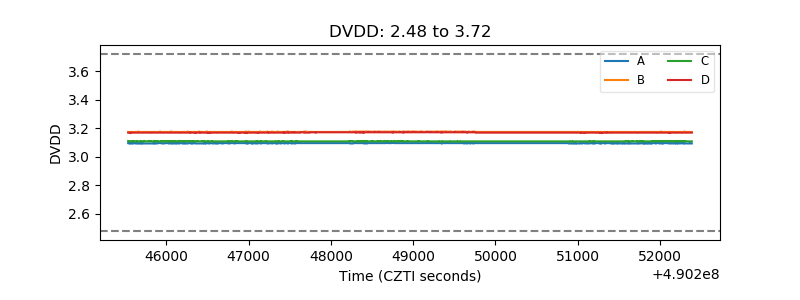 |
| Temperature 1 | 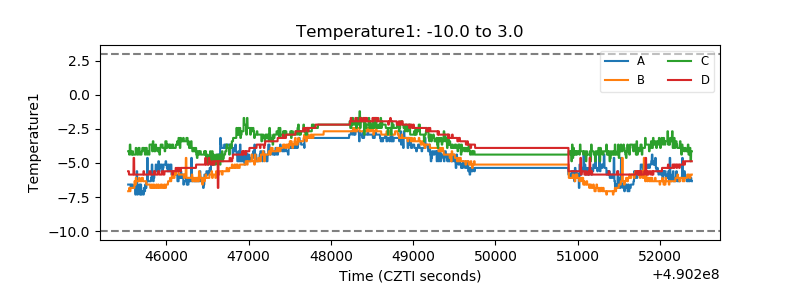 |
| Veto HV Monitor | 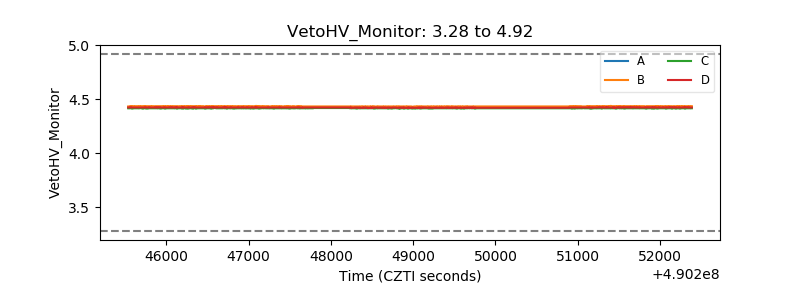 |
| Veto LLD | 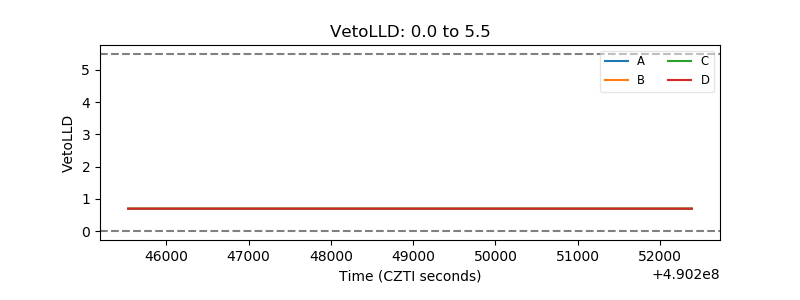 |
| Alpha Counter | 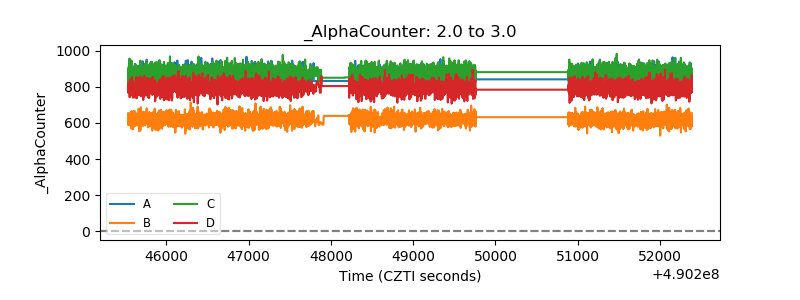 |
| _CPM_Rate |  |
| CZT Counter | 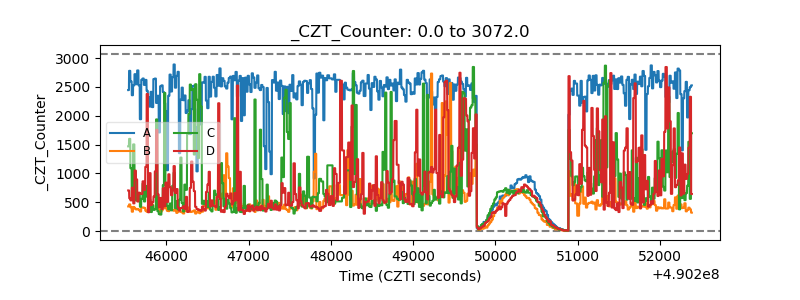 |
| +2.5 Volts monitor |  |
| +5 Volts monitor |  |
| _ROLL_ROT | 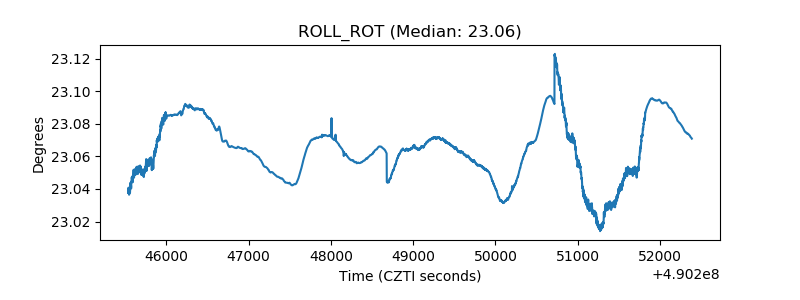 |
| _Roll_DEC | 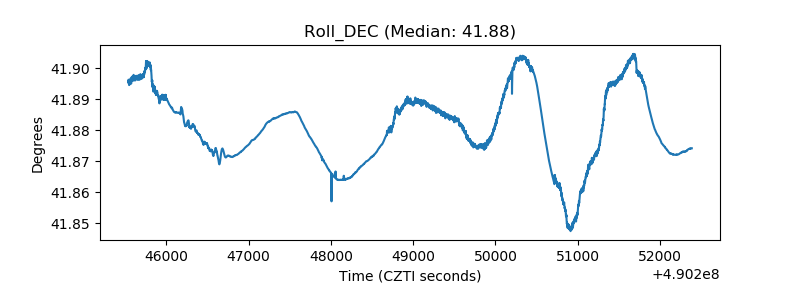 |
| _Roll_RA | 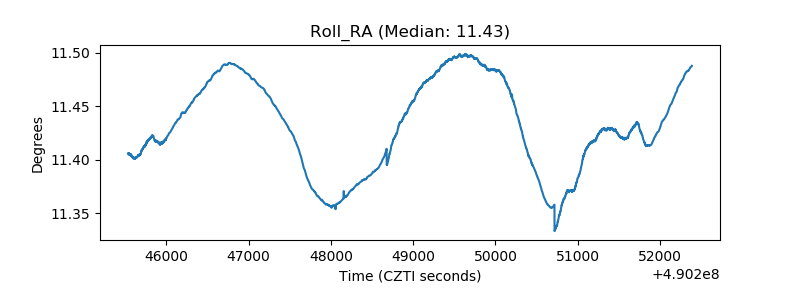 |
| Veto Counter | 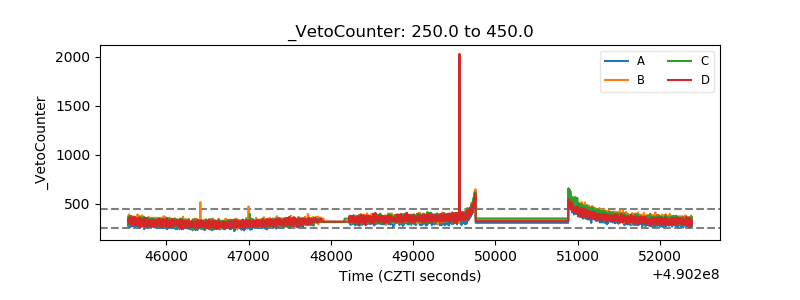 |