| Param | Original file | Final file |
|---|---|---|
| Filename | modeM0/AS1A13_003T01_9000006486_52990cztM0_level2.fits | modeM0/AS1A13_003T01_9000006486_52990cztM0_level2_quad_clean.evt |
| Size (bytes) | 973,393,920 | 62,879,040 |
| Size | 928.3 MB | 60.0 MB |
| Events in quadrant A | 12,209,237 | 247,626 |
| Events in quadrant B | 2,799,700 | 647,075 |
| Events in quadrant C | 8,669,346 | 380,073 |
| Events in quadrant D | 11,884,441 | 204,390 |
| Mode M9 | |||
|---|---|---|---|
| Quadrant | BADHDUFLAG | Total packets | Discarded packets |
| A | 0 | 11 | 0 |
| B | 0 | 11 | 0 |
| C | 0 | 11 | 0 |
| D | 0 | 11 | 0 |
| Mode M0 | |||
|---|---|---|---|
| Quadrant | BADHDUFLAG | Total packets | Discarded packets |
| A | 0 | 40469 | 21 |
| B | 0 | 12760 | 13 |
| C | 0 | 29924 | 29 |
| D | 0 | 39512 | 45 |
| Mode SS | |||
|---|---|---|---|
| Quadrant | BADHDUFLAG | Total packets | Discarded packets |
| A | 0 | 126 | 0 |
| B | 0 | 126 | 0 |
| C | 0 | 126 | 0 |
| D | 0 | 126 | 0 |
| Quadrant | Total seconds | Saturated seconds | Saturation percentage |
|---|---|---|---|
| A | 6070 | 3972 | 65.436573% |
| B | 6066 | 38 | 0.626442% |
| C | 6070 | 2156 | 35.518946% |
| D | 6068 | 4005 | 66.001978% |
Noise dominated data is calculated using 1-second bins in cleaned event files. If a bin has >2000 counts, and if more than 50% of those come from <1% of pixels, then it is considered to be noise-dominated and hence unusable.
| Quadrant | # 1 sec bins | Bins with >0 counts | Bins with >2000 counts | High rate bins dominated by noise | Noise dominated (total time) | Noise dominated (detector-on time) | Marked lightcurve |
|---|---|---|---|---|---|---|---|
| A | 7219 | 6073 | 3234 | 3234 | 44.80% | 53.25% | 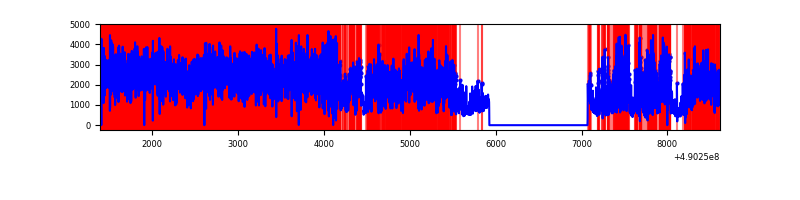 |
| B | 7219 | 6073 | 7 | 7 | 0.10% | 0.12% | 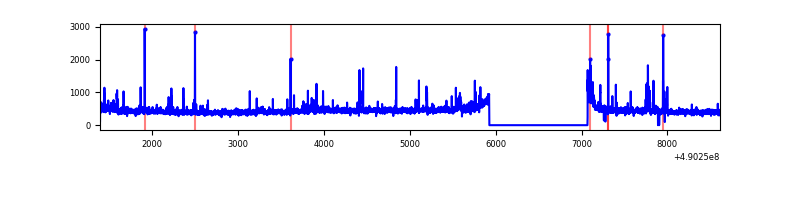 |
| C | 7219 | 6075 | 1771 | 1771 | 24.53% | 29.15% | 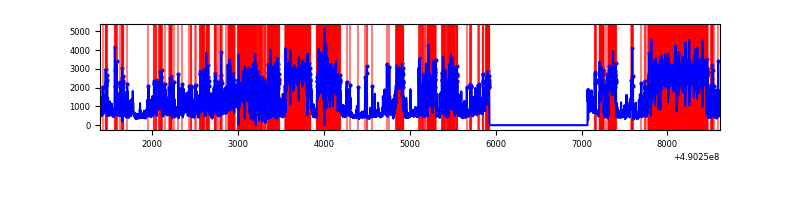 |
| D | 7220 | 6075 | 3241 | 3241 | 44.89% | 53.35% | 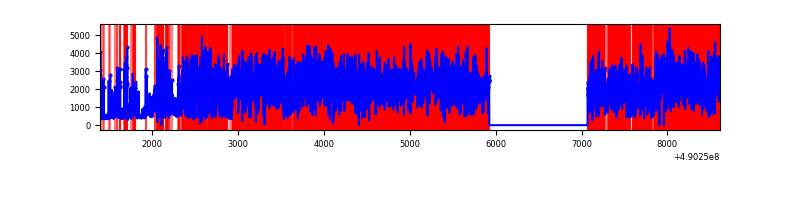 |
Top three noisy pixels from each quadrant. If the there are fewer than three noisy pixels in the level2.evt file, extra rows are filled as -1
| Pixel properties | Quadrant properties | ||||||
|---|---|---|---|---|---|---|---|
| Quadrant | DetID | PixID | Counts | Sigma | Mean | Median | Sigma |
| A | 9 | 191 | 8736244 | 76418.09 | 456 | 445 | 114.3 |
| A | 15 | 190 | 753604 | 6588.4 | 456 | 445 | 114.3 |
| A | 4 | 249 | 603397 | 5274.44 | 456 | 445 | 114.3 |
| B | 1 | 255 | 44091 | 317.04 | 642 | 620 | 137.1 |
| B | 10 | 254 | 35133 | 251.71 | 642 | 620 | 137.1 |
| B | 10 | 247 | 34356 | 246.04 | 642 | 620 | 137.1 |
| C | 1 | 241 | 3741239 | 26762.53 | 503 | 501 | 139.8 |
| C | 9 | 38 | 798140 | 5706.58 | 503 | 501 | 139.8 |
| C | 15 | 206 | 390164 | 2787.78 | 503 | 501 | 139.8 |
| D | 2 | 62 | 7478317 | 64808.78 | 400 | 382 | 115.4 |
| D | 8 | 176 | 1284028 | 11124.93 | 400 | 382 | 115.4 |
| D | 2 | 37 | 544302 | 4713.97 | 400 | 382 | 115.4 |
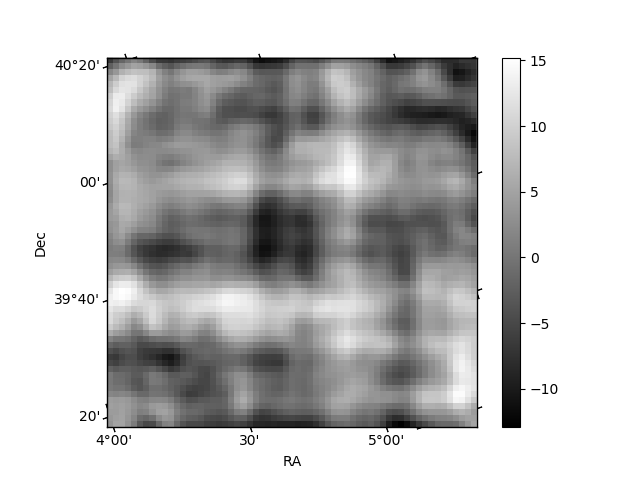
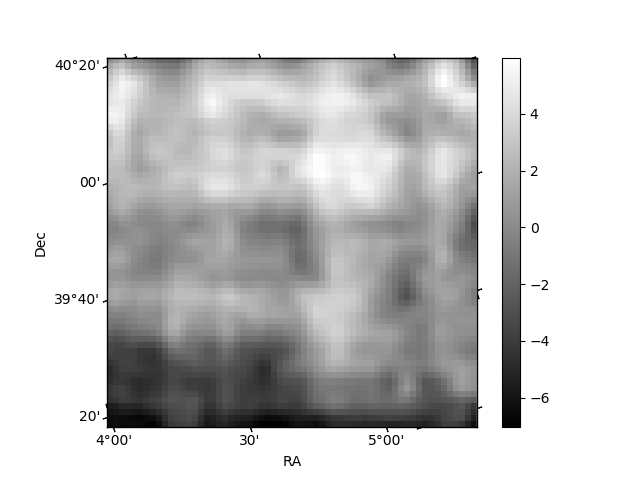
Histogram calculated using DETX and DETY for each event in the final _common_clean file
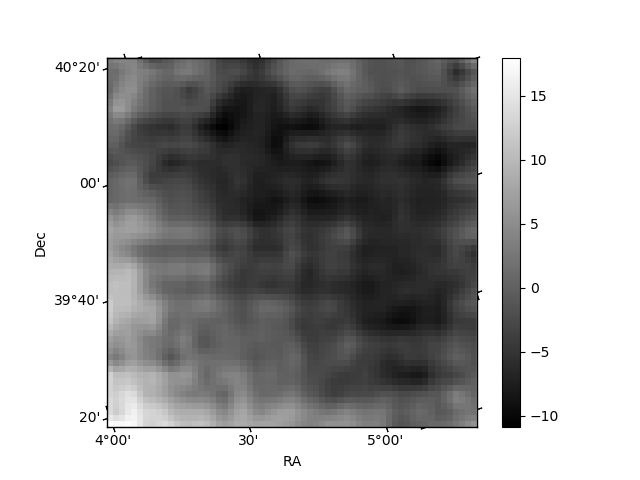
| Quadrant A | 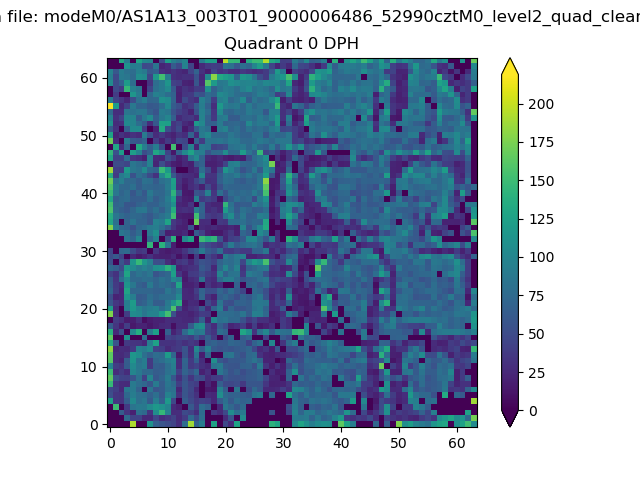 |
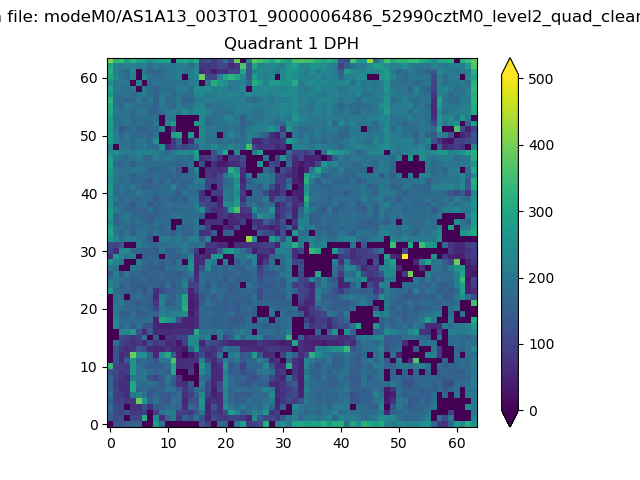 |
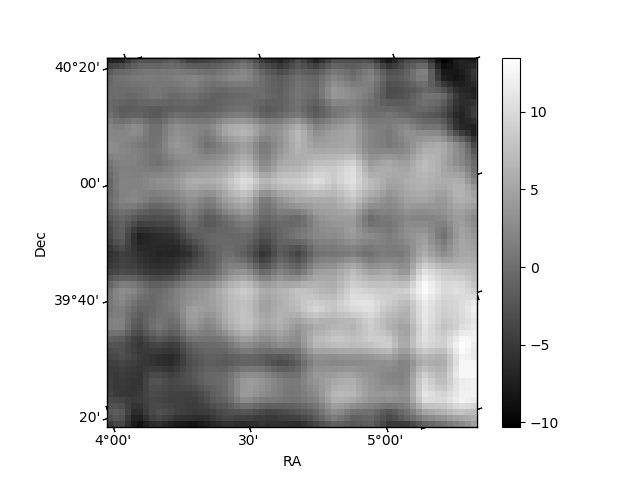
Quadrant B |
|---|---|---|---|
| Quadrant D | 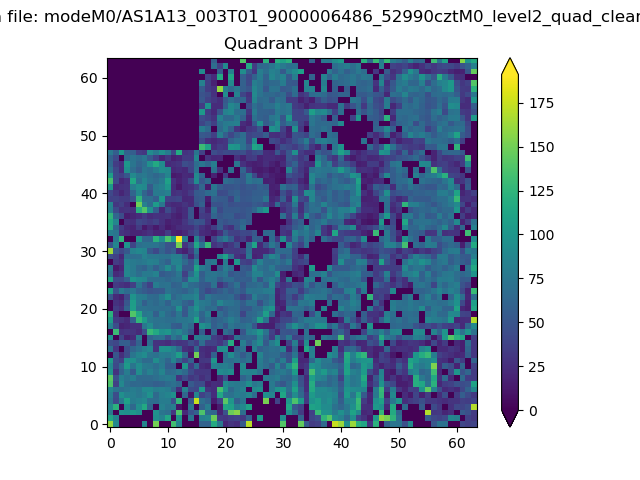 |
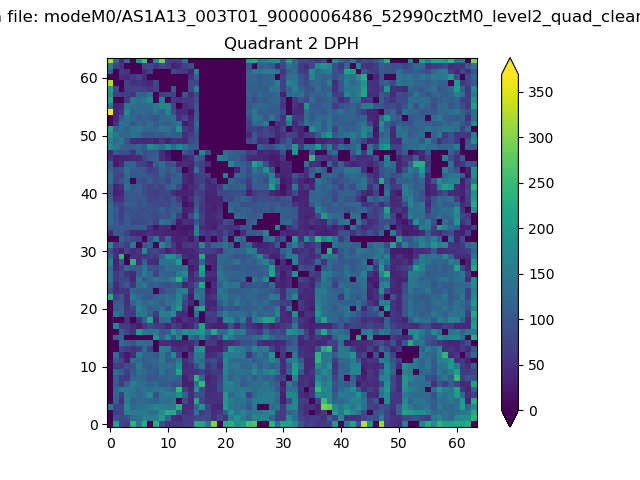 |
Quadrant C |
| Plot type | Count rate plots | Images |
|---|---|---|
| Comparison with Poisson distribution Blue bars denote a histogram of data divided into 1 sec bins. Red curve is a Poisson curve with rate = median count rate of data. |
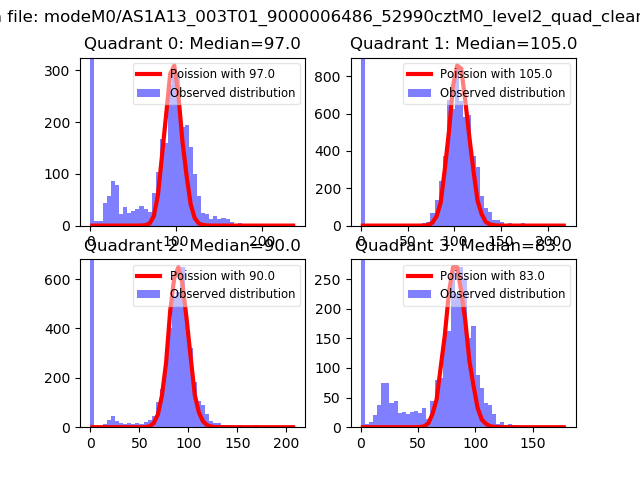 |
 |
| Quadrant-wise count rates Data is divided into 100 sec bins |
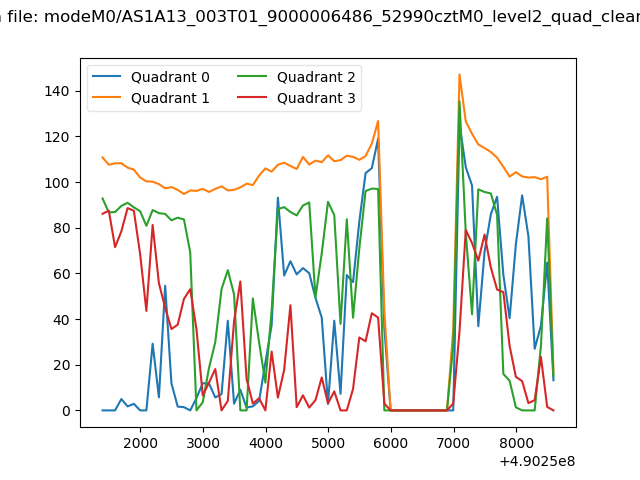 |
|
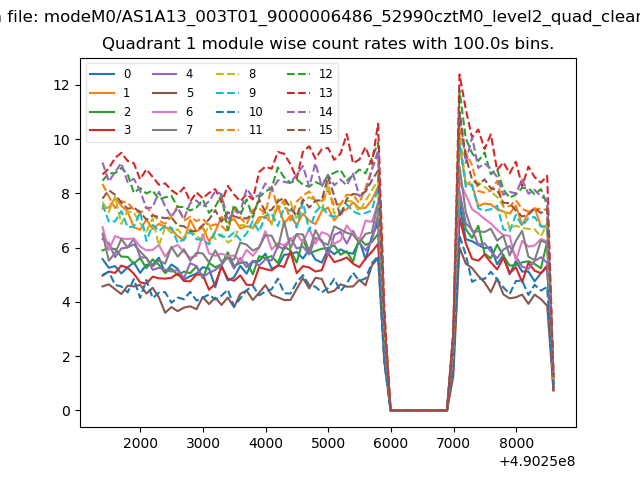
| Module-wise count rates for Quadrant A Data is divided into 100 sec bins |
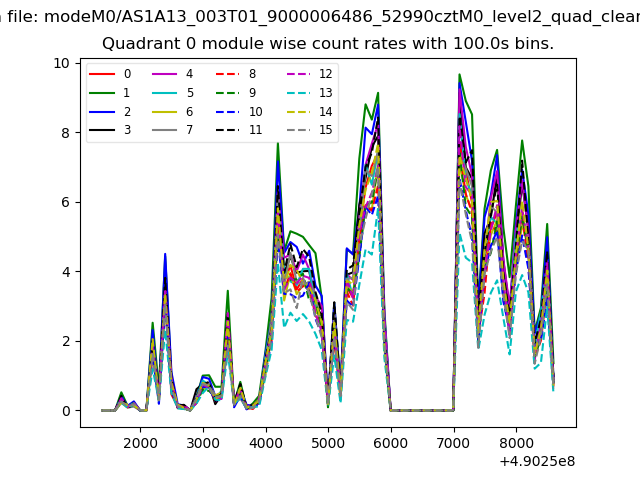 |
 |
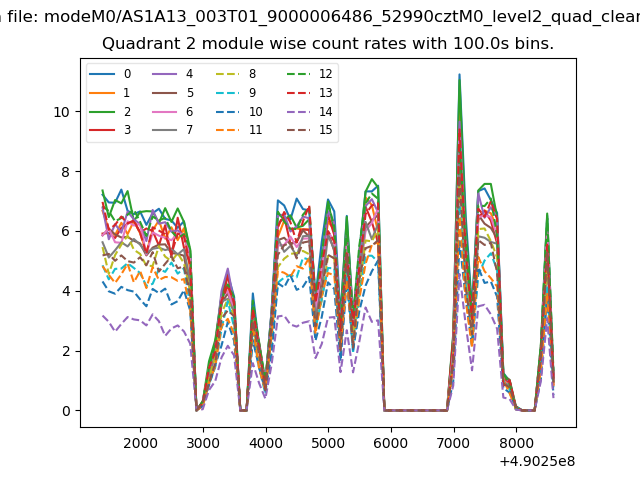
| Module-wise count rates for Quadrant B Data is divided into 100 sec bins |
 |
 |
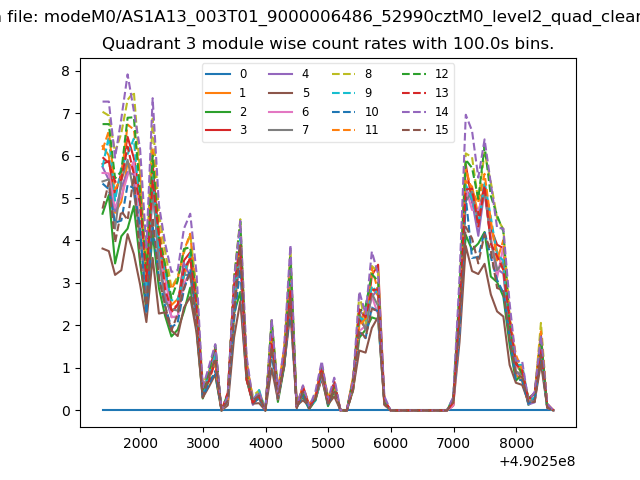
| Module-wise count rates for Quadrant C Data is divided into 100 sec bins |
 |
 |
| Module-wise count rates for Quadrant D Data is divided into 100 sec bins |
 |
 |
| Parameter | Plot |
|---|---|
| CZT HV Monitor | 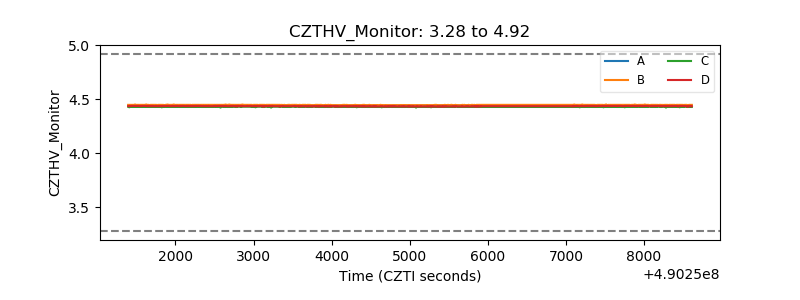 |
| D_VDD | 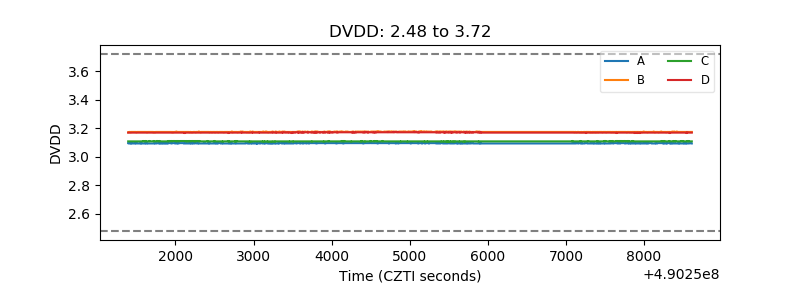 |
| Temperature 1 | 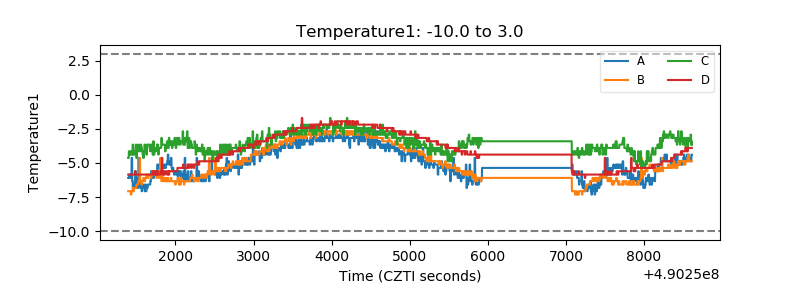 |
| Veto HV Monitor | 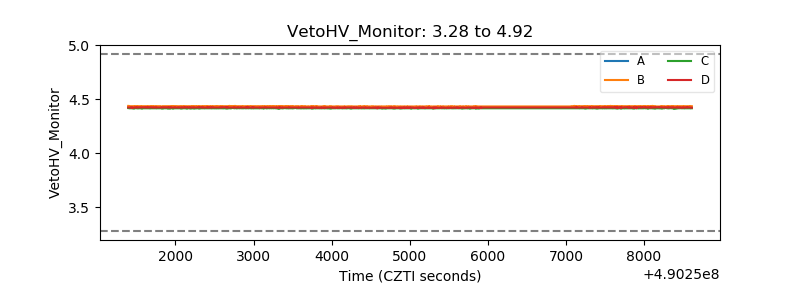 |
| Veto LLD | 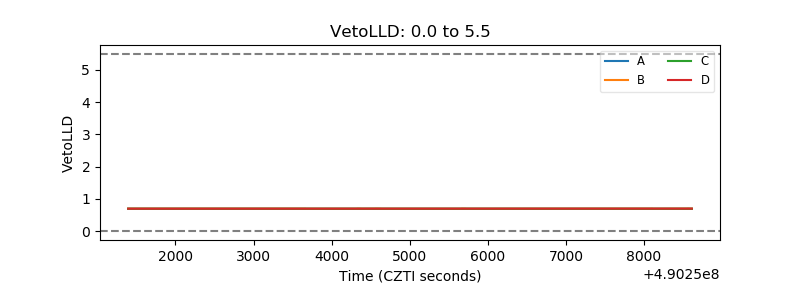 |
| Alpha Counter | 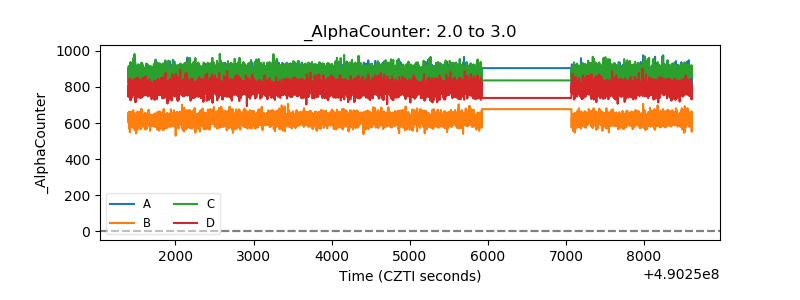 |
| _CPM_Rate | 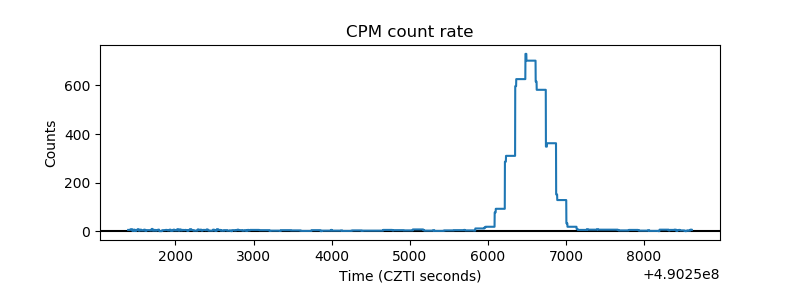 |
| CZT Counter | 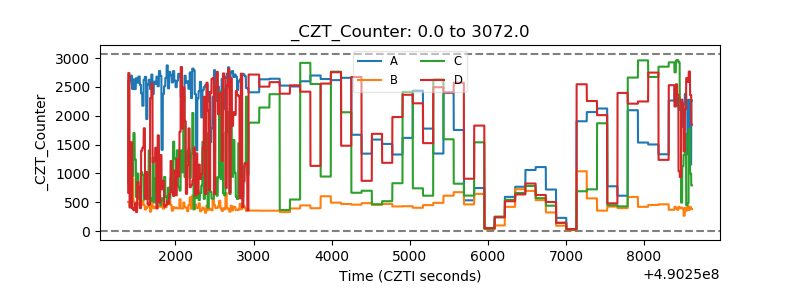 |
| +2.5 Volts monitor | 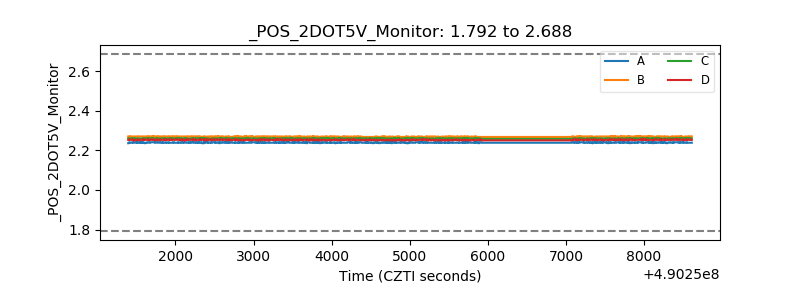 |
| +5 Volts monitor |  |
| _ROLL_ROT | 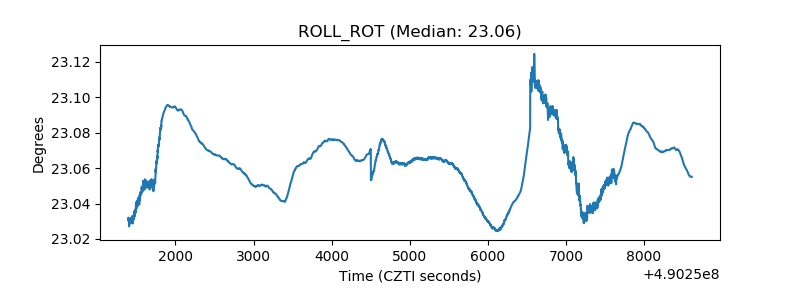 |
| _Roll_DEC | 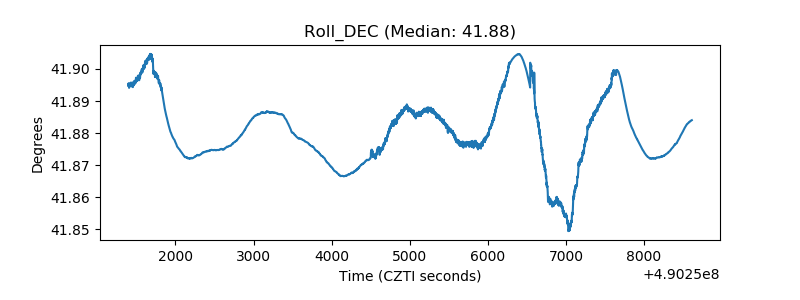 |
| _Roll_RA | 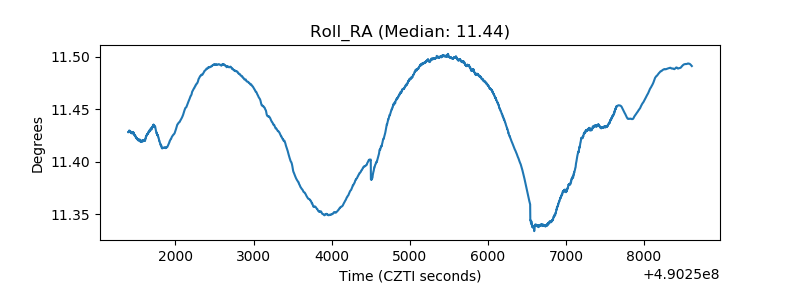 |
| Veto Counter | 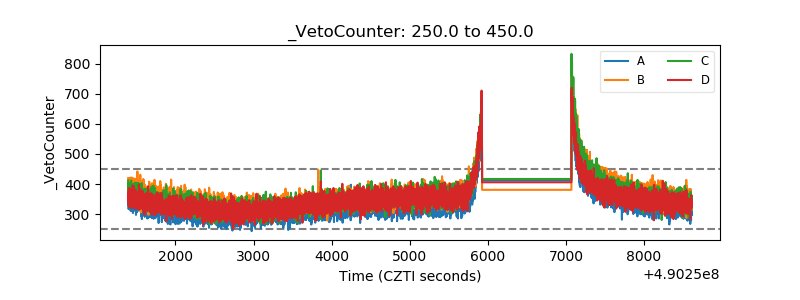 |