| Param | Original file | Final file |
|---|---|---|
| Filename | modeM0/AS1A13_003T01_9000006486_52992cztM0_level2.fits | modeM0/AS1A13_003T01_9000006486_52992cztM0_level2_quad_clean.evt |
| Size (bytes) | 4,573,342,080 | 331,056,000 |
| Size | 4.3 GB | 315.7 MB |
| Events in quadrant A | 68,525,269 | 754,156 |
| Events in quadrant B | 15,233,233 | 3,249,170 |
| Events in quadrant C | 32,170,762 | 2,458,864 |
| Events in quadrant D | 50,977,640 | 1,428,632 |
| Mode M9 | |||
|---|---|---|---|
| Quadrant | BADHDUFLAG | Total packets | Discarded packets |
| A | 0 | 62 | 0 |
| B | 0 | 62 | 0 |
| C | 0 | 62 | 0 |
| D | 0 | 62 | 0 |
| Mode M0 | |||
|---|---|---|---|
| Quadrant | BADHDUFLAG | Total packets | Discarded packets |
| A | 0 | 224518 | 6 |
| B | 0 | 67842 | 6 |
| C | 0 | 117287 | 6 |
| D | 0 | 172848 | 9 |
| Mode SS | |||
|---|---|---|---|
| Quadrant | BADHDUFLAG | Total packets | Discarded packets |
| A | 0 | 634 | 0 |
| B | 0 | 634 | 0 |
| C | 0 | 634 | 0 |
| D | 0 | 634 | 0 |
| Quadrant | Total seconds | Saturated seconds | Saturation percentage |
|---|---|---|---|
| A | 30993 | 24356 | 78.585487% |
| B | 30993 | 501 | 1.616494% |
| C | 30994 | 5104 | 16.467703% |
| D | 30993 | 14680 | 47.365534% |
Noise dominated data is calculated using 1-second bins in cleaned event files. If a bin has >2000 counts, and if more than 50% of those come from <1% of pixels, then it is considered to be noise-dominated and hence unusable.
| Quadrant | # 1 sec bins | Bins with >0 counts | Bins with >2000 counts | High rate bins dominated by noise | Noise dominated (total time) | Noise dominated (detector-on time) | Marked lightcurve |
|---|---|---|---|---|---|---|---|
| A | 37294 | 30995 | 20771 | 20771 | 55.70% | 67.01% | 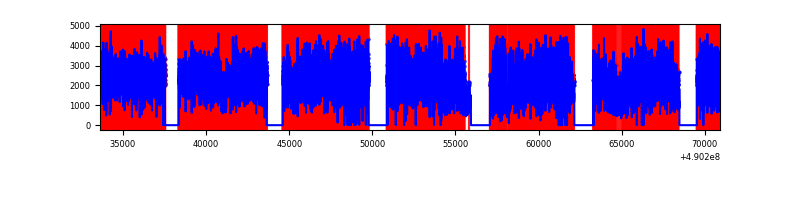 |
| B | 37294 | 30998 | 123 | 123 | 0.33% | 0.40% | 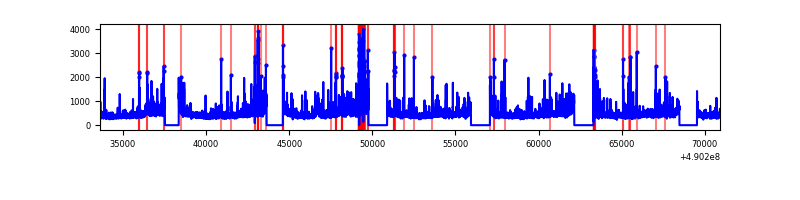 |
| C | 37295 | 31000 | 4644 | 4644 | 12.45% | 14.98% | 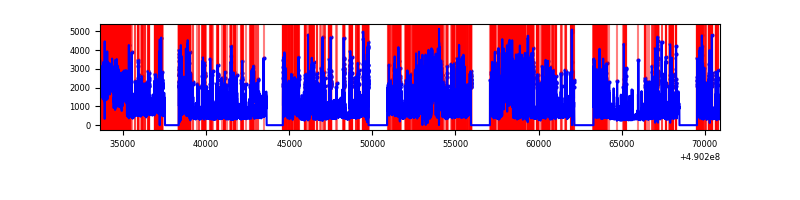 |
| D | 37294 | 30997 | 11854 | 11854 | 31.79% | 38.24% | 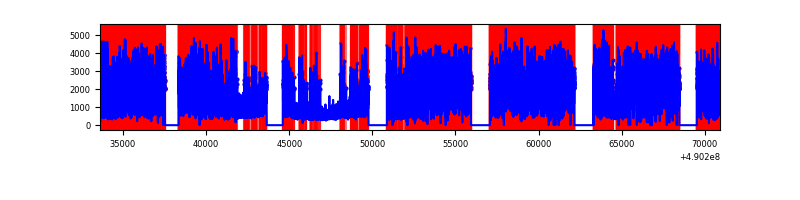 |
Top three noisy pixels from each quadrant. If the there are fewer than three noisy pixels in the level2.evt file, extra rows are filled as -1
| Pixel properties | Quadrant properties | ||||||
|---|---|---|---|---|---|---|---|
| Quadrant | DetID | PixID | Counts | Sigma | Mean | Median | Sigma |
| A | 9 | 191 | 50779721 | 100288.9 | 2006 | 1954 | 506.3 |
| A | 15 | 190 | 5716749 | 11287.04 | 2006 | 1954 | 506.3 |
| A | 4 | 249 | 1748678 | 3449.88 | 2006 | 1954 | 506.3 |
| B | 10 | 254 | 549923 | 782.19 | 3291 | 3178 | 699.0 |
| B | 10 | 63 | 354434 | 502.52 | 3291 | 3178 | 699.0 |
| B | 10 | 247 | 230002 | 324.5 | 3291 | 3178 | 699.0 |
| C | 1 | 241 | 6775487 | 8321.94 | 2971 | 2943 | 813.8 |
| C | 7 | 80 | 3440013 | 4223.39 | 2971 | 2943 | 813.8 |
| C | 9 | 38 | 2600813 | 3192.2 | 2971 | 2943 | 813.8 |
| D | 2 | 62 | 17483504 | 25117.36 | 2427 | 2321 | 696.0 |
| D | 0 | 5 | 11282554 | 16207.69 | 2427 | 2321 | 696.0 |
| D | 8 | 176 | 7616061 | 10939.59 | 2427 | 2321 | 696.0 |
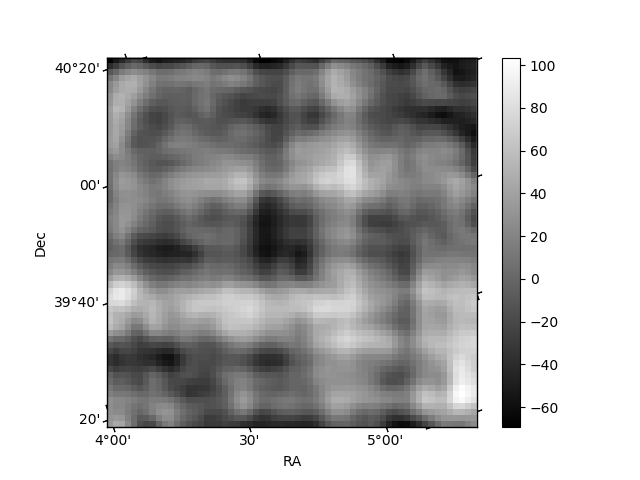
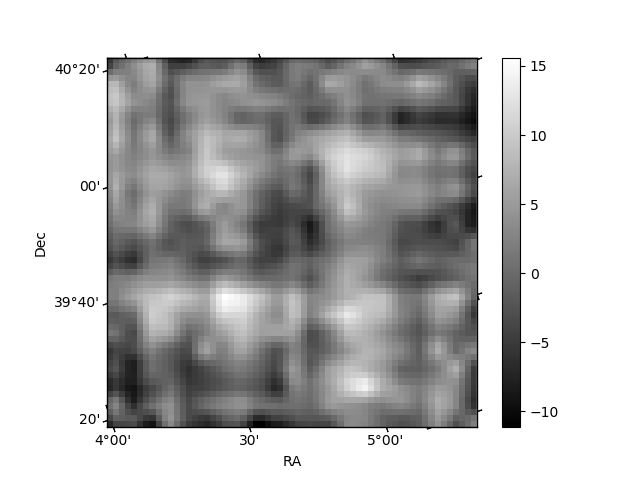
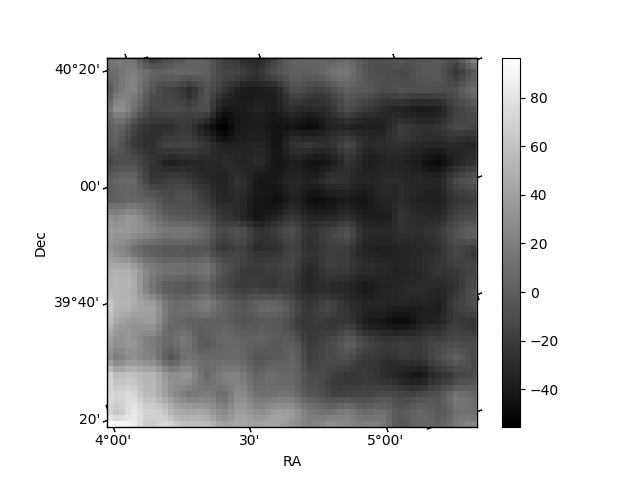
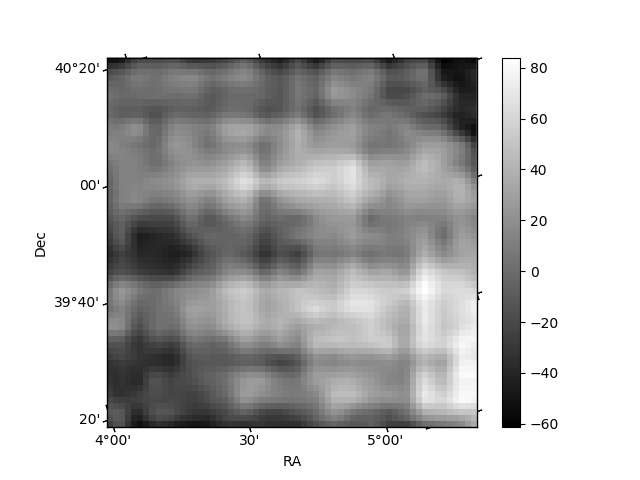
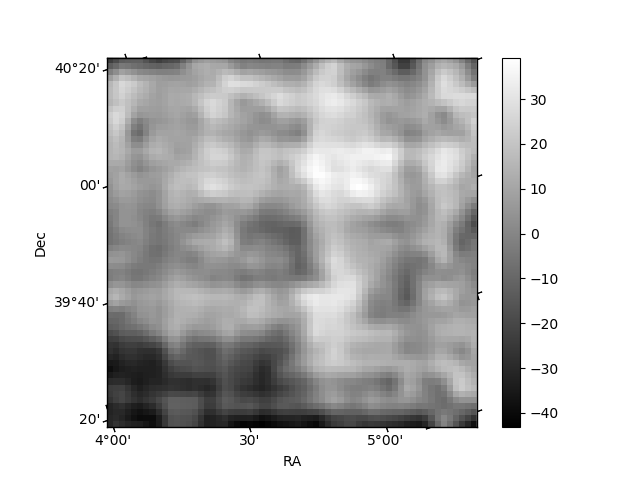
Histogram calculated using DETX and DETY for each event in the final _common_clean file
| Quadrant A | 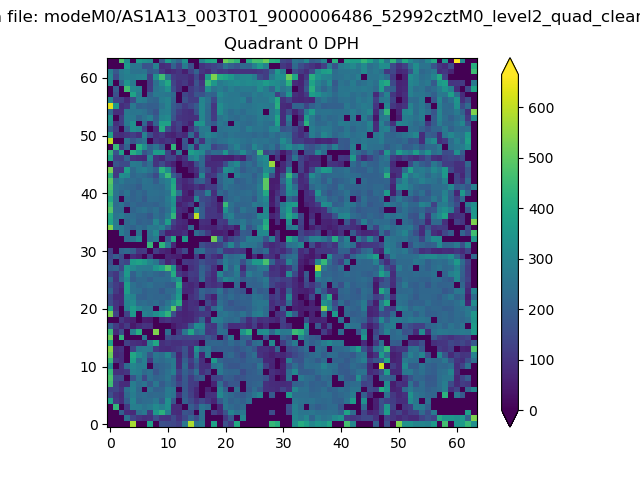 |
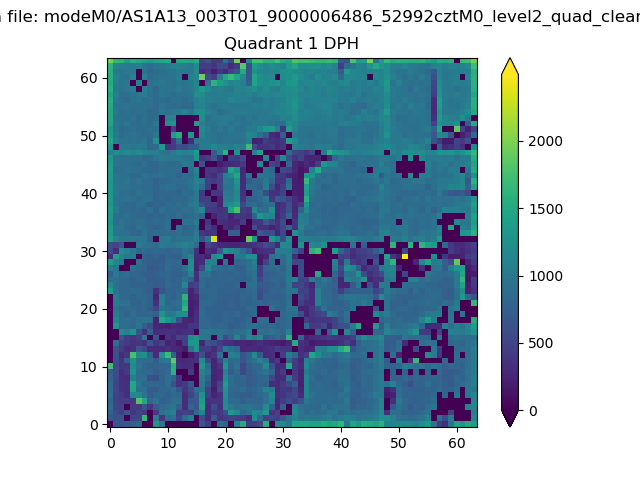 |
Quadrant B |
|---|---|---|---|
| Quadrant D | 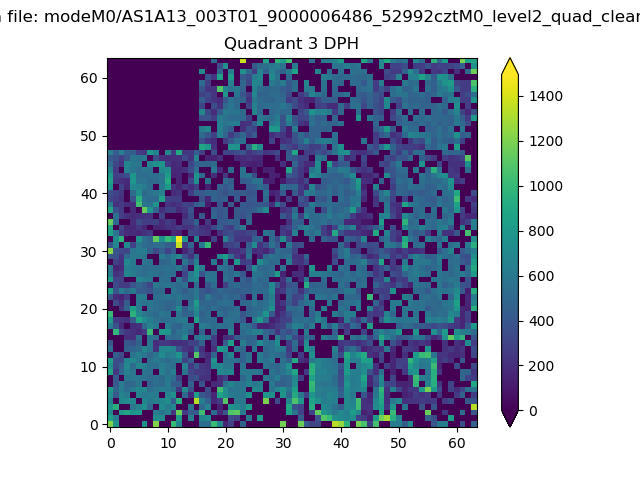 |
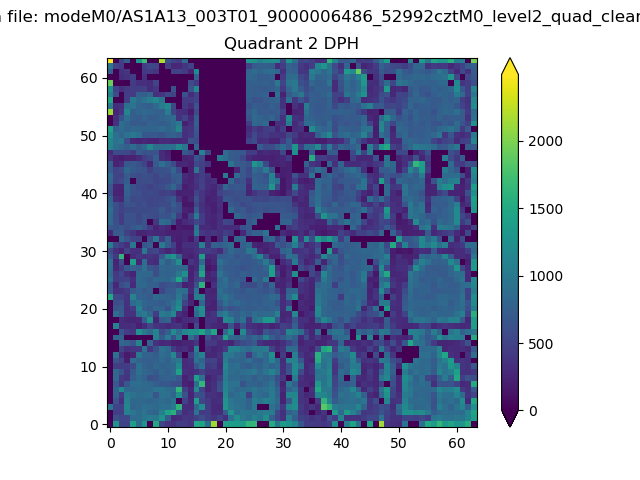 |
Quadrant C |
| Plot type | Count rate plots | Images |
|---|---|---|
| Comparison with Poisson distribution Blue bars denote a histogram of data divided into 1 sec bins. Red curve is a Poisson curve with rate = median count rate of data. |
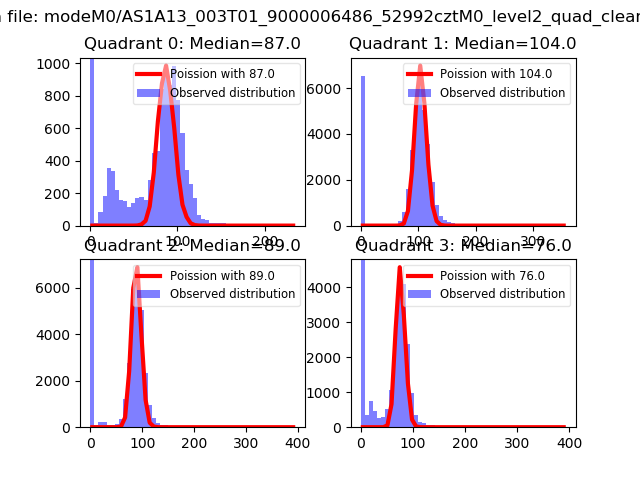 |
 |
| Quadrant-wise count rates Data is divided into 100 sec bins |
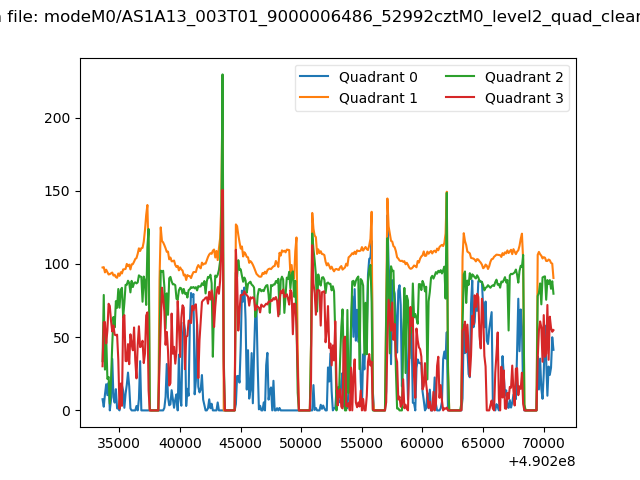 |
|
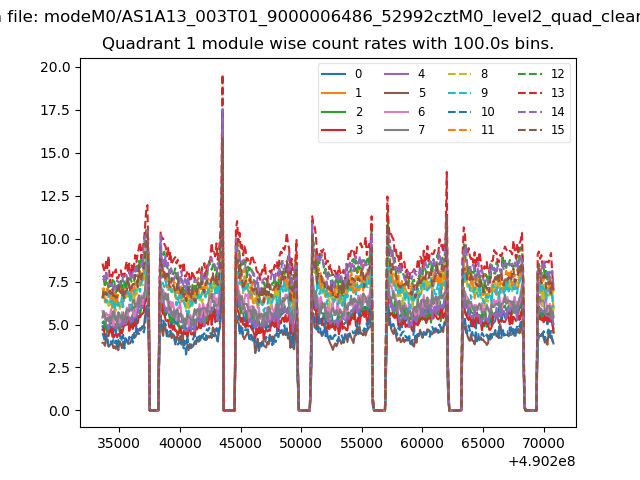
| Module-wise count rates for Quadrant A Data is divided into 100 sec bins |
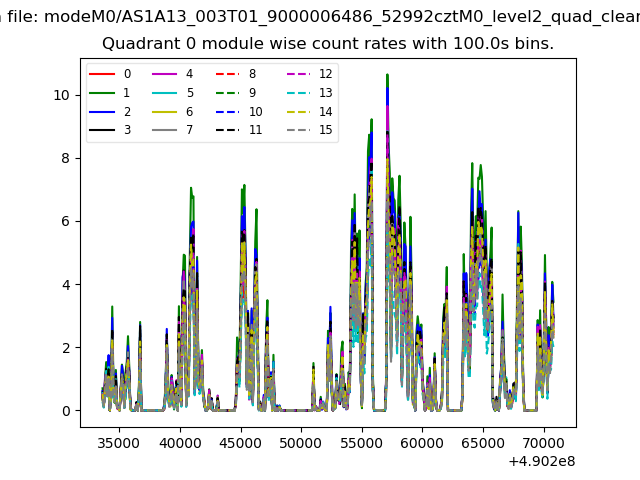 |
 |
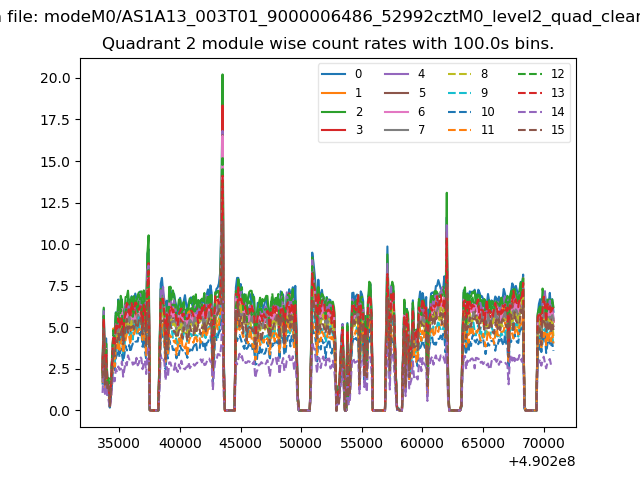
| Module-wise count rates for Quadrant B Data is divided into 100 sec bins |
 |
 |
| Module-wise count rates for Quadrant C Data is divided into 100 sec bins |
 |
 |
| Module-wise count rates for Quadrant D Data is divided into 100 sec bins |
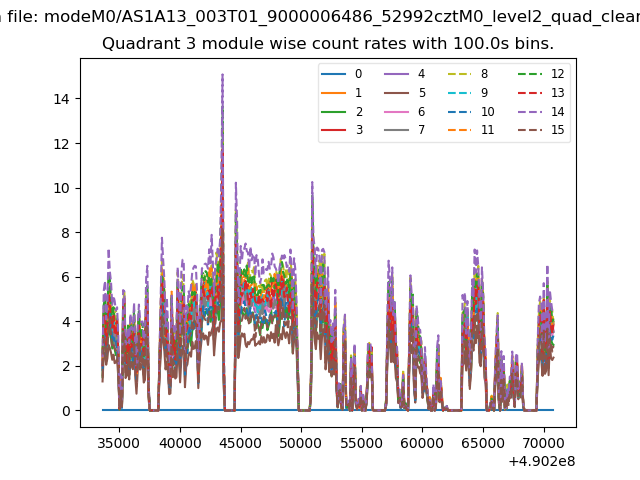 |
 |
| Parameter | Plot |
|---|---|
| CZT HV Monitor | 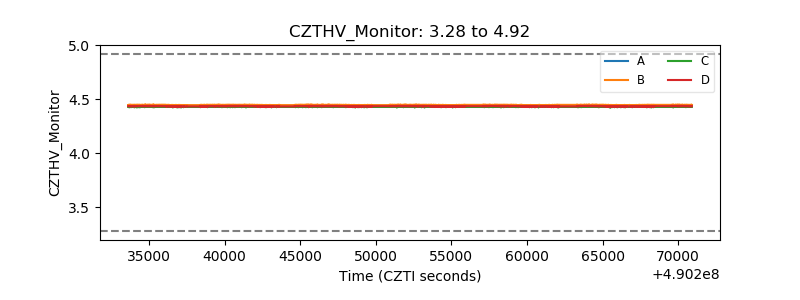 |
| D_VDD | 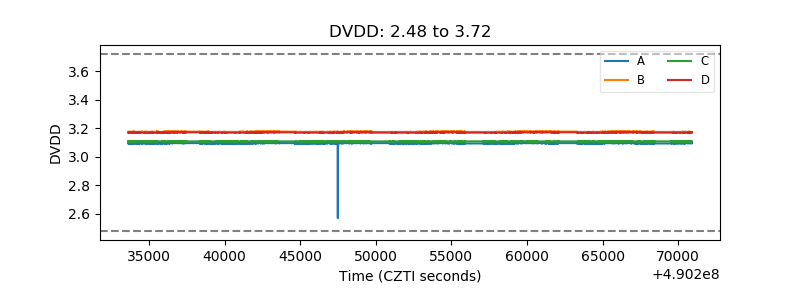 |
| Temperature 1 | 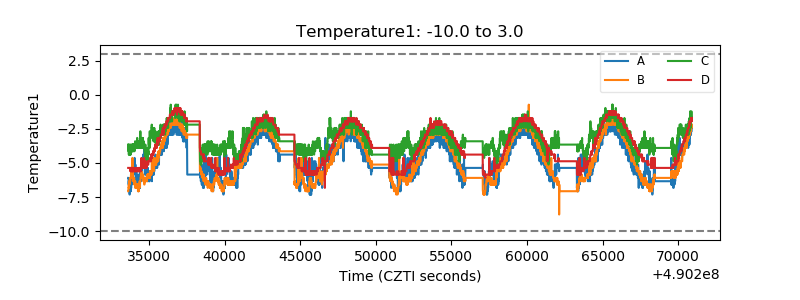 |
| Veto HV Monitor | 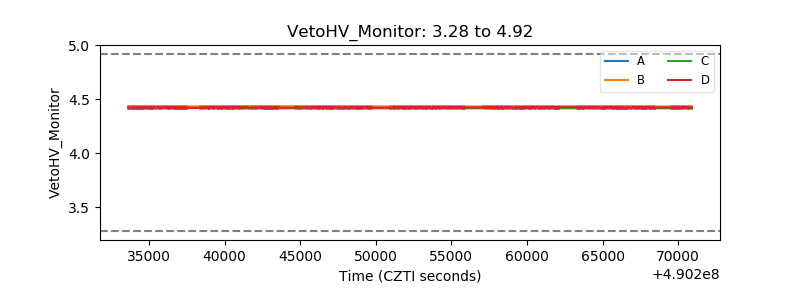 |
| Veto LLD | 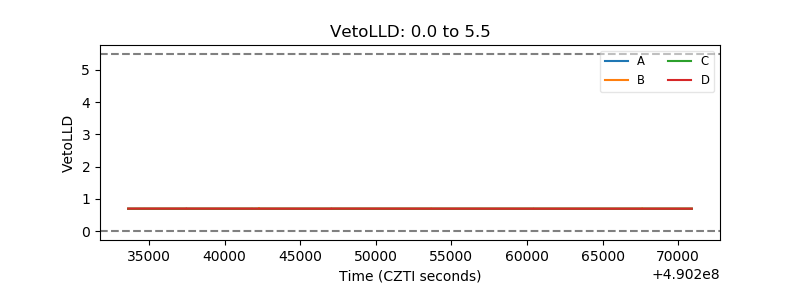 |
| Alpha Counter | 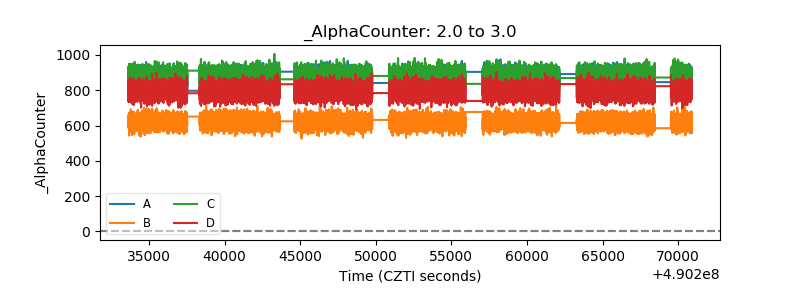 |
| _CPM_Rate | 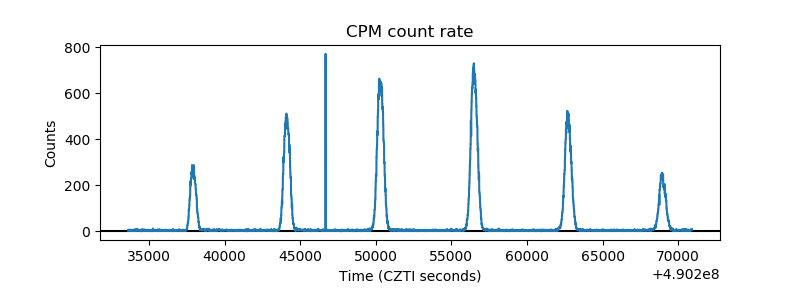 |
| CZT Counter | 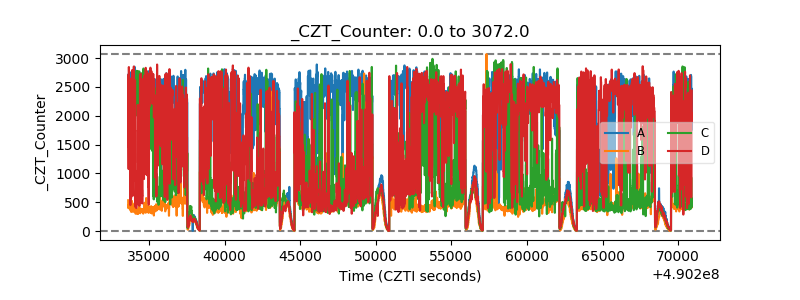 |
| +2.5 Volts monitor |  |
| +5 Volts monitor |  |
| _ROLL_ROT | 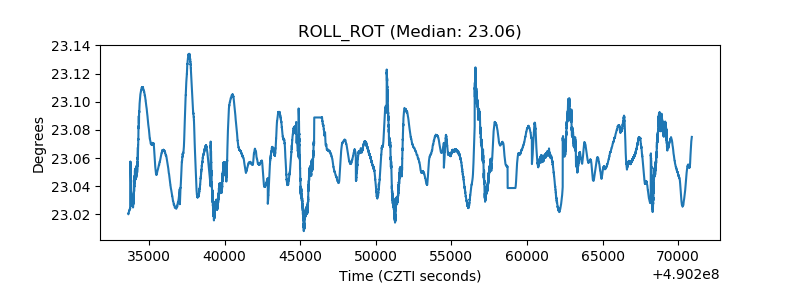 |
| _Roll_DEC | 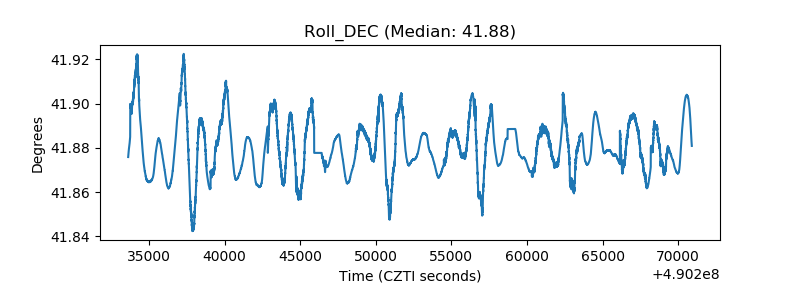 |
| _Roll_RA | 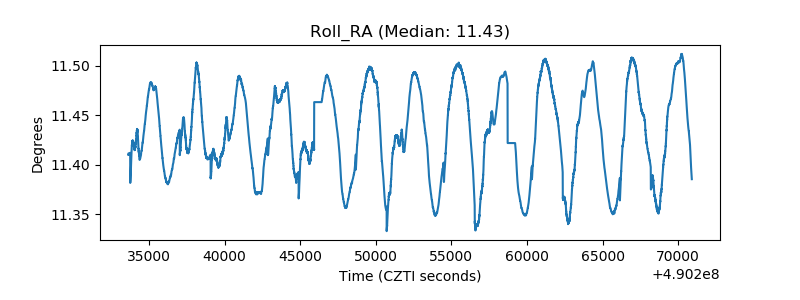 |
| Veto Counter | 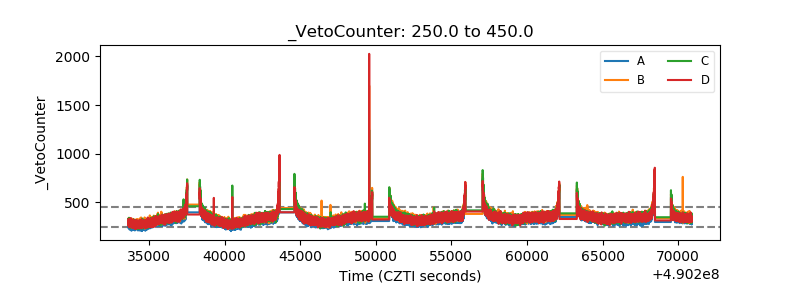 |