| Param | Original file | Final file |
|---|---|---|
| Filename | modeM0/AS1A13_003T01_9000006486_52993cztM0_level2.fits | modeM0/AS1A13_003T01_9000006486_52993cztM0_level2_quad_clean.evt |
| Size (bytes) | 941,371,200 | 69,534,720 |
| Size | 897.8 MB | 66.3 MB |
| Events in quadrant A | 13,364,382 | 226,718 |
| Events in quadrant B | 4,209,709 | 651,441 |
| Events in quadrant C | 4,325,744 | 554,881 |
| Events in quadrant D | 12,451,172 | 224,622 |
| Mode M9 | |||
|---|---|---|---|
| Quadrant | BADHDUFLAG | Total packets | Discarded packets |
| A | 0 | 8 | 0 |
| B | 0 | 8 | 0 |
| C | 0 | 8 | 0 |
| D | 0 | 8 | 0 |
| Mode M0 | |||
|---|---|---|---|
| Quadrant | BADHDUFLAG | Total packets | Discarded packets |
| A | 0 | 44102 | 1 |
| B | 0 | 16999 | 1 |
| C | 0 | 17332 | 1 |
| D | 0 | 41376 | 3 |
| Mode SS | |||
|---|---|---|---|
| Quadrant | BADHDUFLAG | Total packets | Discarded packets |
| A | 0 | 132 | 0 |
| B | 0 | 132 | 0 |
| C | 0 | 132 | 0 |
| D | 0 | 132 | 0 |
| Quadrant | Total seconds | Saturated seconds | Saturation percentage |
|---|---|---|---|
| A | 6404 | 4409 | 68.847595% |
| B | 6404 | 219 | 3.419738% |
| C | 6404 | 337 | 5.262336% |
| D | 6404 | 4137 | 64.600250% |
Noise dominated data is calculated using 1-second bins in cleaned event files. If a bin has >2000 counts, and if more than 50% of those come from <1% of pixels, then it is considered to be noise-dominated and hence unusable.
| Quadrant | # 1 sec bins | Bins with >0 counts | Bins with >2000 counts | High rate bins dominated by noise | Noise dominated (total time) | Noise dominated (detector-on time) | Marked lightcurve |
|---|---|---|---|---|---|---|---|
| A | 7284 | 6404 | 3651 | 3651 | 50.12% | 57.01% | 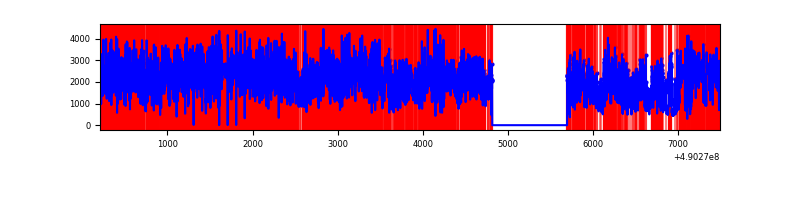 |
| B | 7283 | 6404 | 50 | 50 | 0.69% | 0.78% | 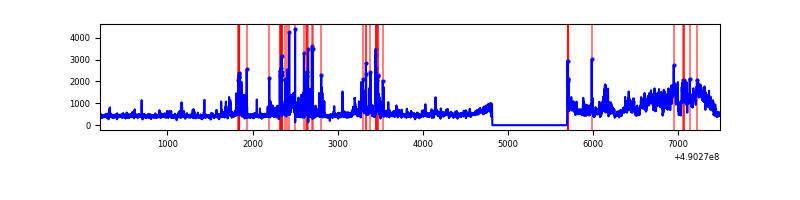 |
| C | 7283 | 6404 | 198 | 198 | 2.72% | 3.09% | 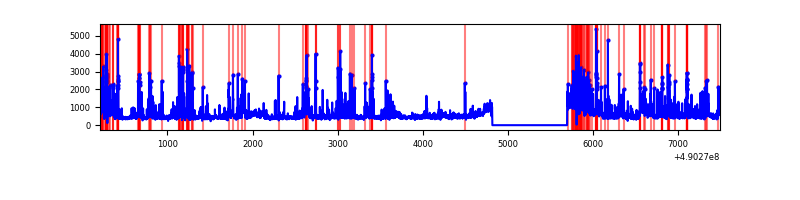 |
| D | 7284 | 6404 | 3160 | 3160 | 43.38% | 49.34% |  |
Top three noisy pixels from each quadrant. If the there are fewer than three noisy pixels in the level2.evt file, extra rows are filled as -1
| Pixel properties | Quadrant properties | ||||||
|---|---|---|---|---|---|---|---|
| Quadrant | DetID | PixID | Counts | Sigma | Mean | Median | Sigma |
| A | 9 | 191 | 7265440 | 59889.8 | 478 | 465 | 121.3 |
| A | 7 | 206 | 2772325 | 22850.2 | 478 | 465 | 121.3 |
| A | 15 | 190 | 1196855 | 9862.6 | 478 | 465 | 121.3 |
| B | 10 | 254 | 976323 | 6610.79 | 683 | 660 | 147.6 |
| B | 5 | 185 | 107501 | 723.92 | 683 | 660 | 147.6 |
| B | 10 | 63 | 88913 | 597.98 | 683 | 660 | 147.6 |
| C | 12 | 254 | 634178 | 3528.09 | 659 | 653 | 179.6 |
| C | 9 | 38 | 249002 | 1383.05 | 659 | 653 | 179.6 |
| C | 1 | 241 | 173263 | 961.26 | 659 | 653 | 179.6 |
| D | 2 | 62 | 5830172 | 44023.2 | 460 | 437 | 132.4 |
| D | 0 | 5 | 1544269 | 11658.24 | 460 | 437 | 132.4 |
| D | 12 | 17 | 1441012 | 10878.49 | 460 | 437 | 132.4 |
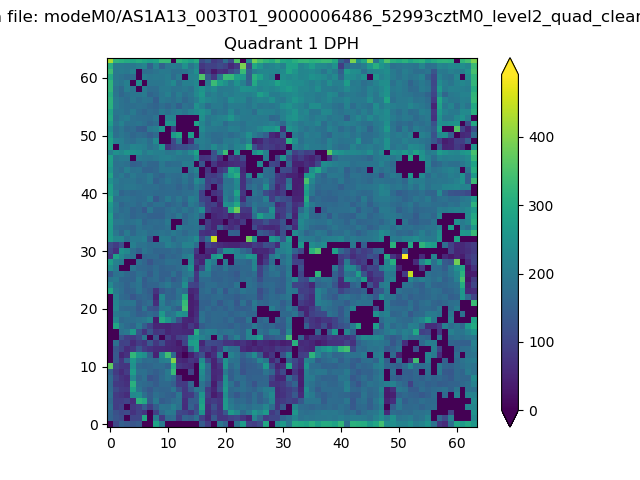
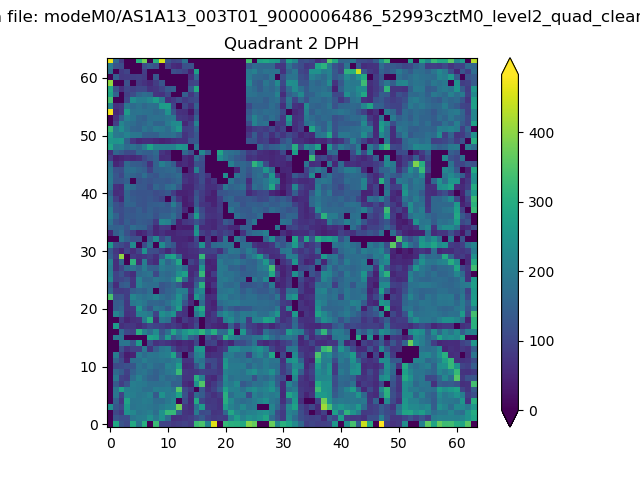
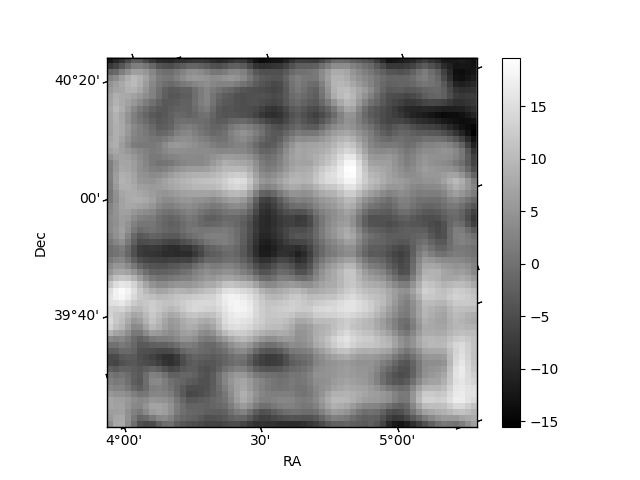
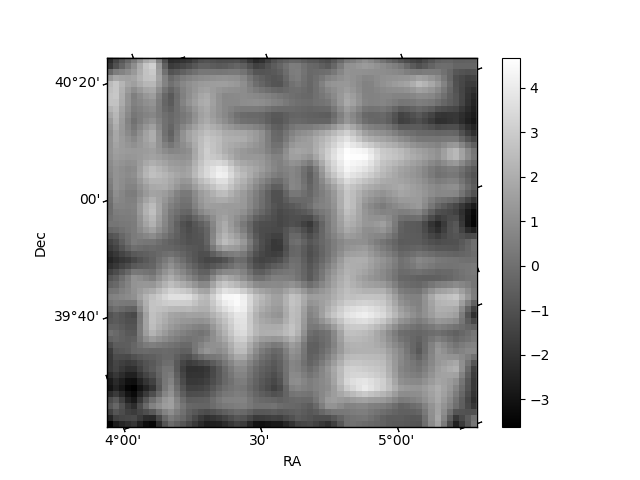
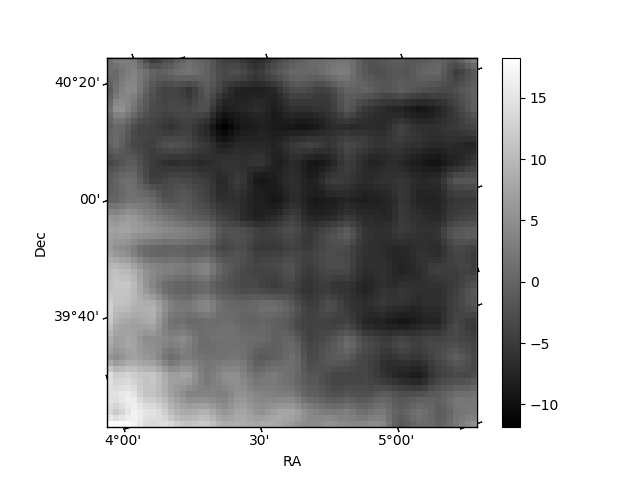
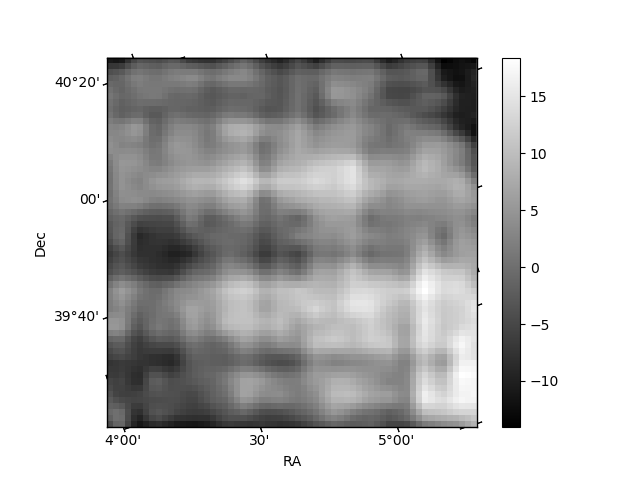
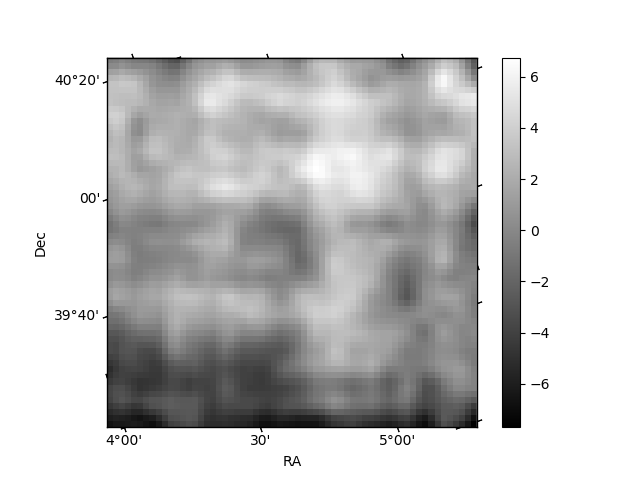
Histogram calculated using DETX and DETY for each event in the final _common_clean file
| Quadrant A | 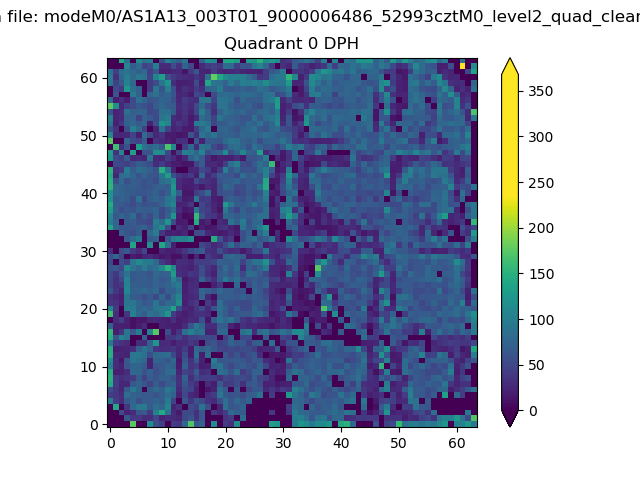 |
 |
Quadrant B |
|---|---|---|---|
| Quadrant D | 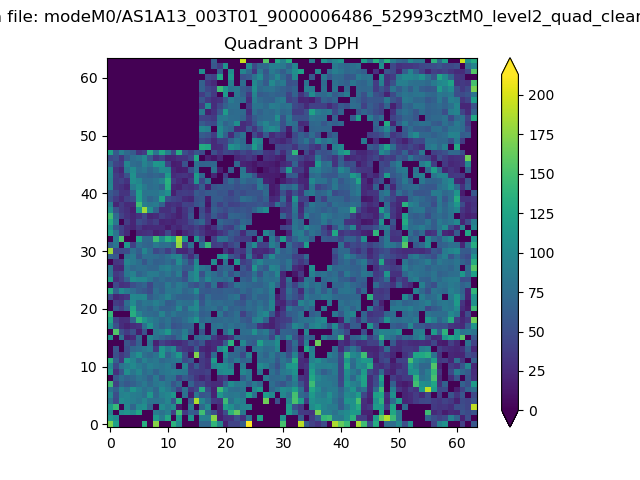 |
 |
Quadrant C |
| Plot type | Count rate plots | Images |
|---|---|---|
| Comparison with Poisson distribution Blue bars denote a histogram of data divided into 1 sec bins. Red curve is a Poisson curve with rate = median count rate of data. |
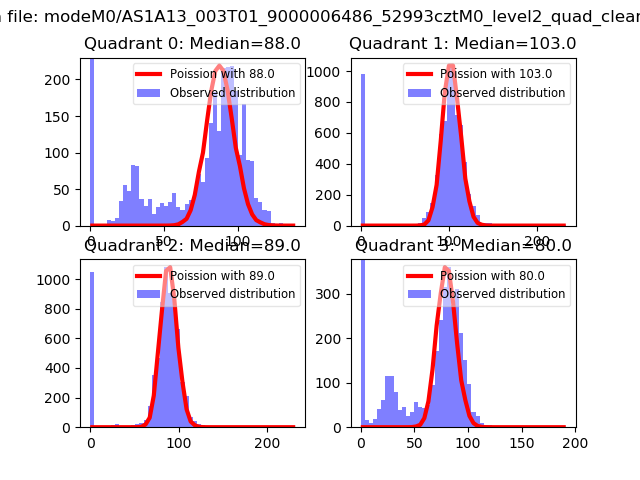 |
 |
| Quadrant-wise count rates Data is divided into 100 sec bins |
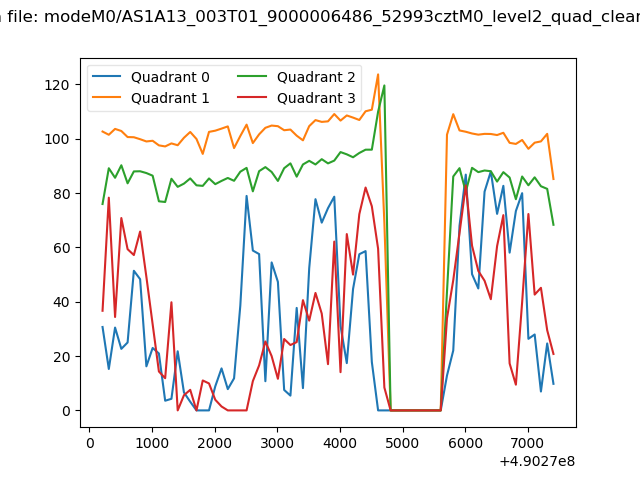 |
|
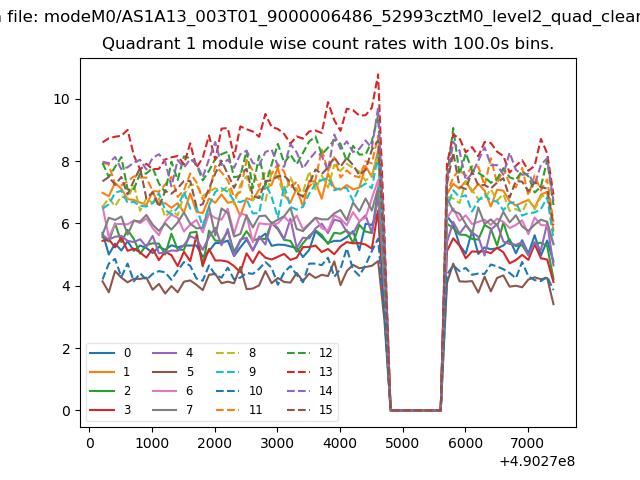
| Module-wise count rates for Quadrant A Data is divided into 100 sec bins |
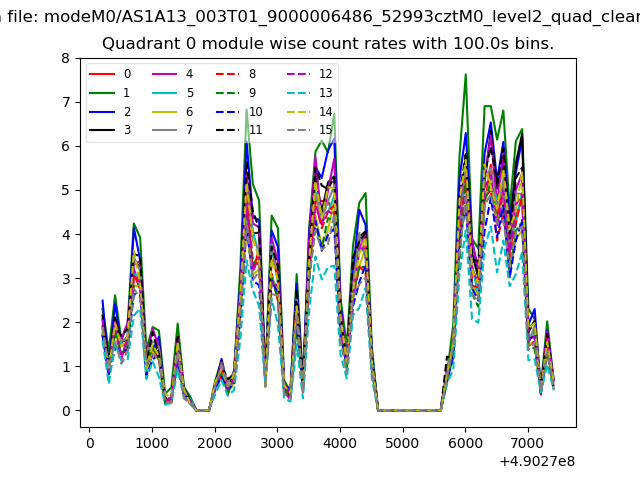 |
 |
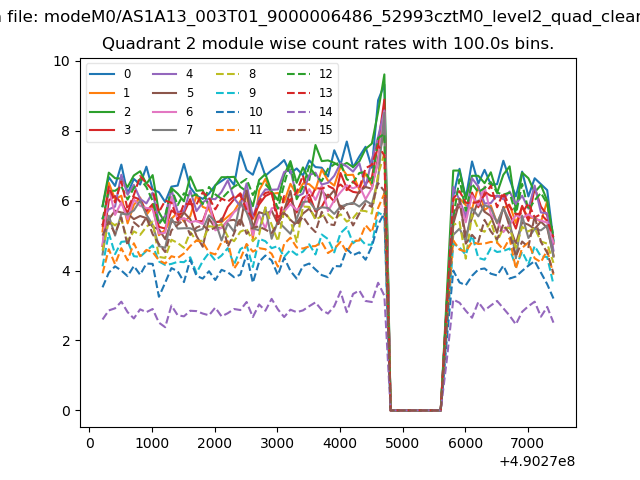
| Module-wise count rates for Quadrant B Data is divided into 100 sec bins |
 |
 |
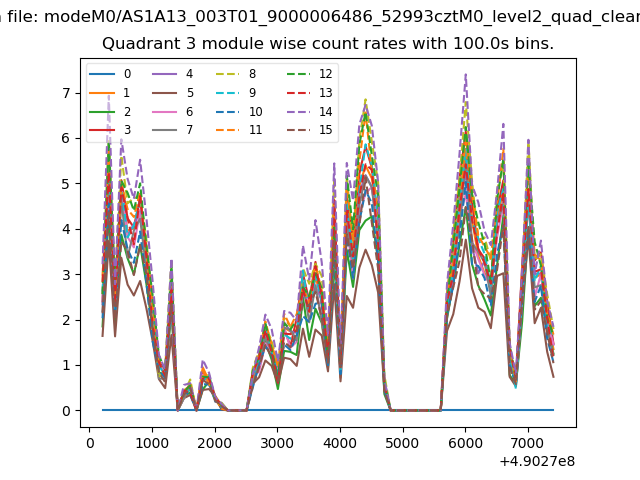
| Module-wise count rates for Quadrant C Data is divided into 100 sec bins |
 |
 |
| Module-wise count rates for Quadrant D Data is divided into 100 sec bins |
 |
 |
| Parameter | Plot |
|---|---|
| CZT HV Monitor | 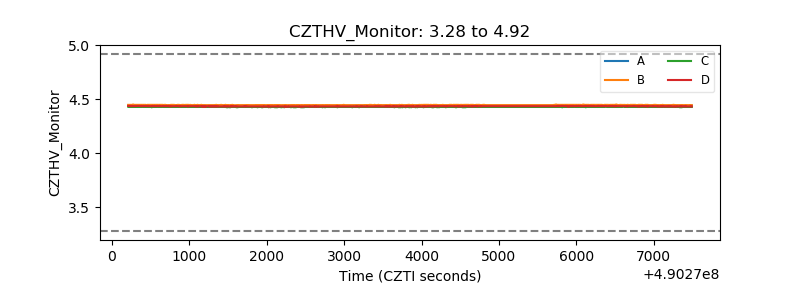 |
| D_VDD | 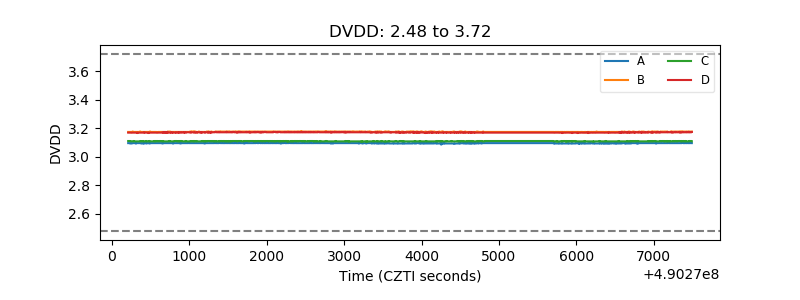 |
| Temperature 1 | 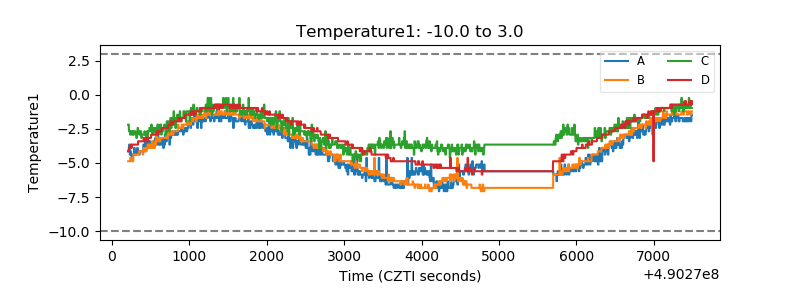 |
| Veto HV Monitor | 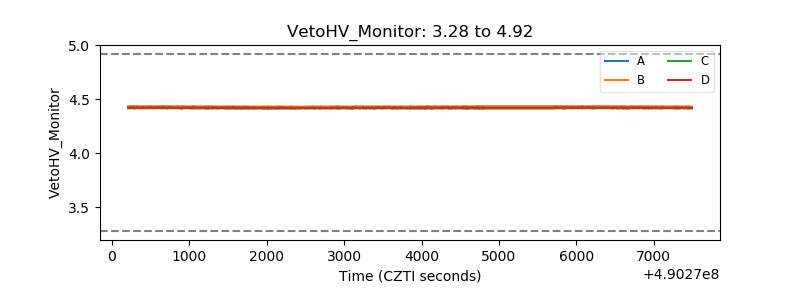 |
| Veto LLD | 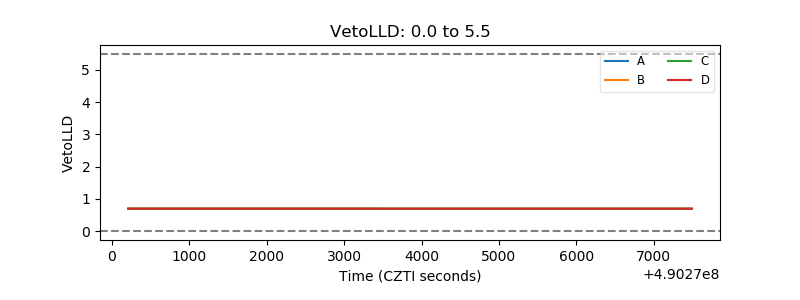 |
| Alpha Counter | 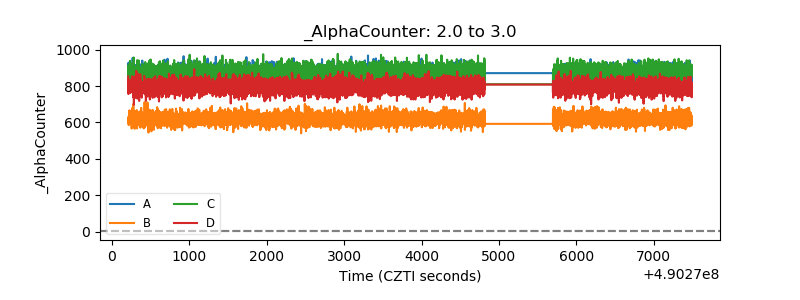 |
| _CPM_Rate | 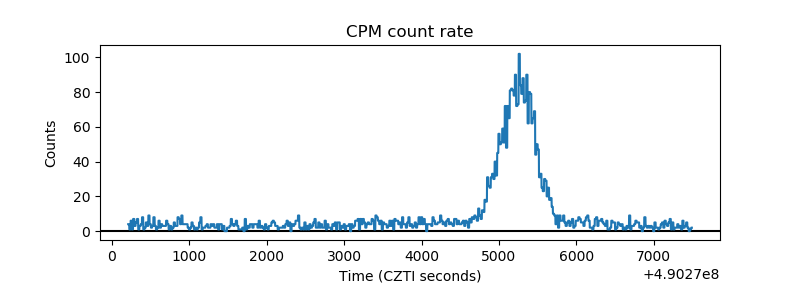 |
| CZT Counter | 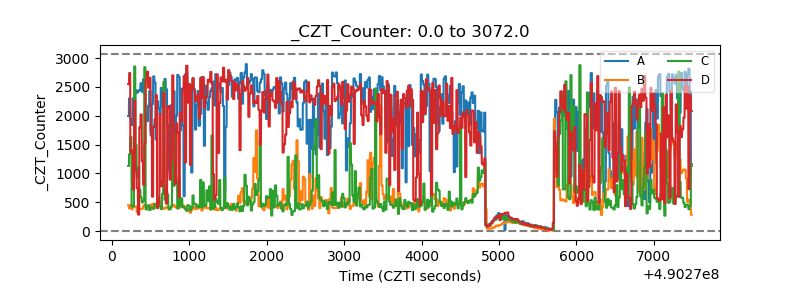 |
| +2.5 Volts monitor |  |
| +5 Volts monitor | 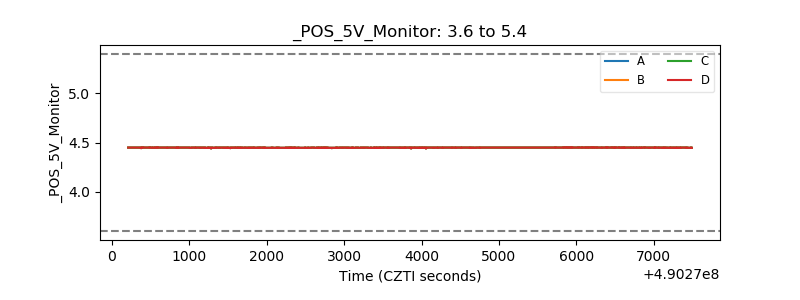 |
| _ROLL_ROT | 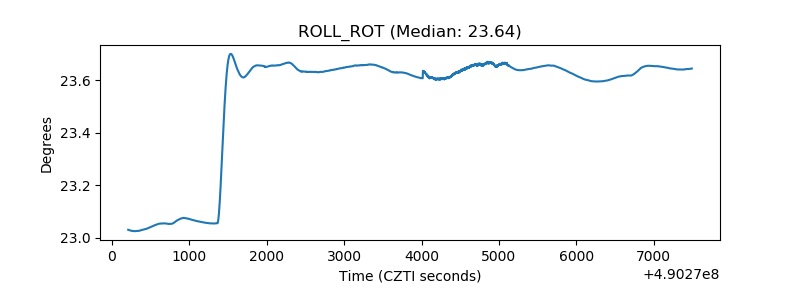 |
| _Roll_DEC | 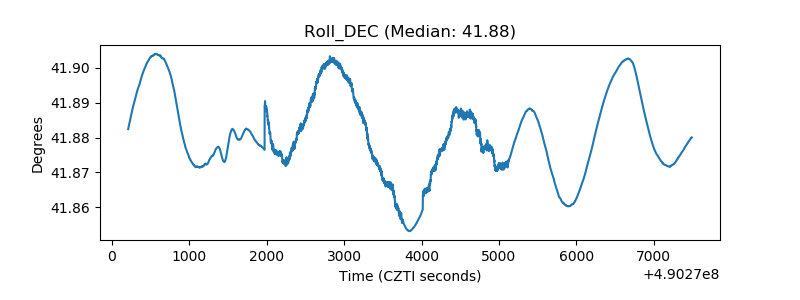 |
| _Roll_RA | 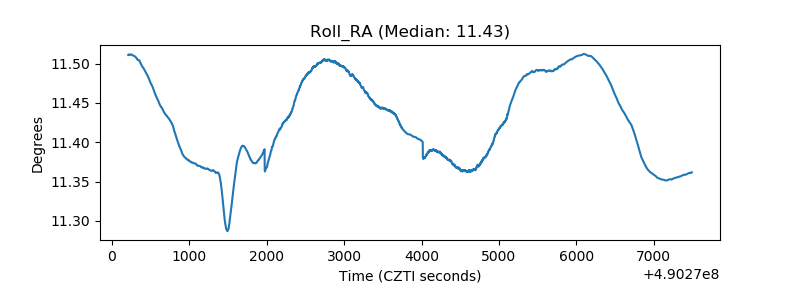 |
| Veto Counter | 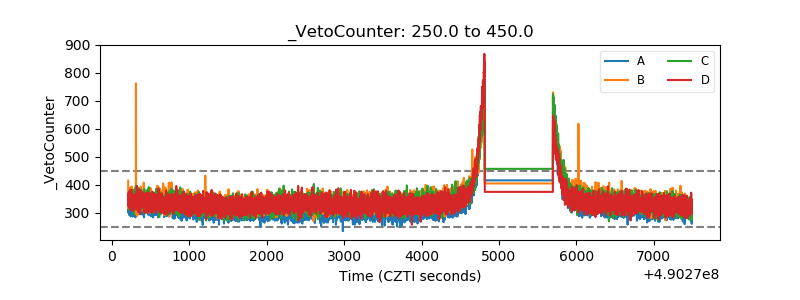 |