| Param | Original file | Final file |
|---|---|---|
| Filename | modeM0/AS1A13_003T01_9000006486_52994cztM0_level2.fits | modeM0/AS1A13_003T01_9000006486_52994cztM0_level2_quad_clean.evt |
| Size (bytes) | 994,832,640 | 83,445,120 |
| Size | 948.7 MB | 79.6 MB |
| Events in quadrant A | 15,628,892 | 208,884 |
| Events in quadrant B | 5,508,646 | 727,512 |
| Events in quadrant C | 5,994,582 | 602,139 |
| Events in quadrant D | 9,130,893 | 481,332 |
| Mode M9 | |||
|---|---|---|---|
| Quadrant | BADHDUFLAG | Total packets | Discarded packets |
| A | 0 | 5 | 0 |
| B | 0 | 5 | 0 |
| C | 0 | 5 | 0 |
| D | 0 | 5 | 0 |
| Mode M0 | |||
|---|---|---|---|
| Quadrant | BADHDUFLAG | Total packets | Discarded packets |
| A | 0 | 51378 | 1 |
| B | 0 | 21557 | 1 |
| C | 0 | 22928 | 1 |
| D | 0 | 32175 | 1 |
| Mode SS | |||
|---|---|---|---|
| Quadrant | BADHDUFLAG | Total packets | Discarded packets |
| A | 0 | 146 | 0 |
| B | 0 | 146 | 0 |
| C | 0 | 146 | 0 |
| D | 0 | 146 | 0 |
| Quadrant | Total seconds | Saturated seconds | Saturation percentage |
|---|---|---|---|
| A | 7274 | 5425 | 74.580698% |
| B | 7274 | 431 | 5.925213% |
| C | 7274 | 746 | 10.255705% |
| D | 7275 | 2028 | 27.876289% |
Noise dominated data is calculated using 1-second bins in cleaned event files. If a bin has >2000 counts, and if more than 50% of those come from <1% of pixels, then it is considered to be noise-dominated and hence unusable.
| Quadrant | # 1 sec bins | Bins with >0 counts | Bins with >2000 counts | High rate bins dominated by noise | Noise dominated (total time) | Noise dominated (detector-on time) | Marked lightcurve |
|---|---|---|---|---|---|---|---|
| A | 7723 | 7273 | 4369 | 4369 | 56.57% | 60.07% | 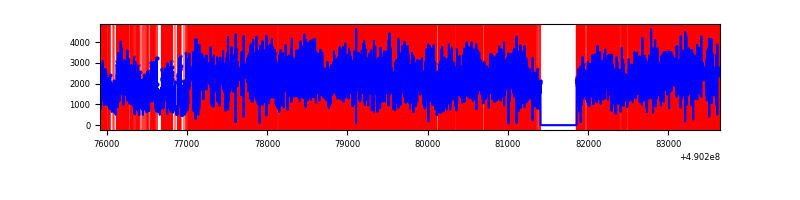 |
| B | 7723 | 7274 | 104 | 104 | 1.35% | 1.43% | 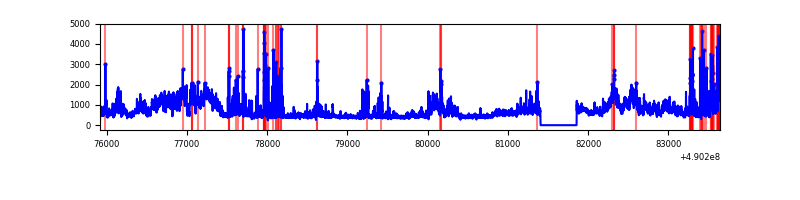 |
| C | 7724 | 7274 | 442 | 442 | 5.72% | 6.08% | 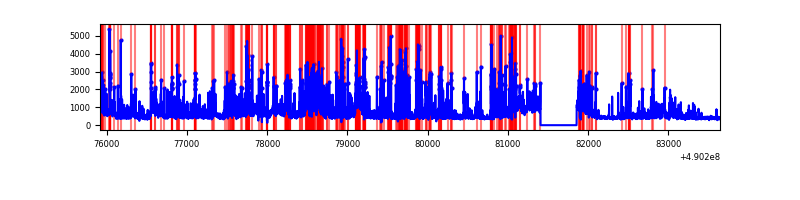 |
| D | 7725 | 7276 | 1407 | 1407 | 18.21% | 19.34% | 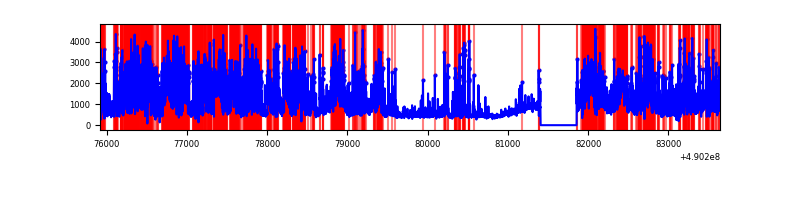 |
Top three noisy pixels from each quadrant. If the there are fewer than three noisy pixels in the level2.evt file, extra rows are filled as -1
| Pixel properties | Quadrant properties | ||||||
|---|---|---|---|---|---|---|---|
| Quadrant | DetID | PixID | Counts | Sigma | Mean | Median | Sigma |
| A | 9 | 191 | 11177627 | 86926.41 | 513 | 500 | 128.6 |
| A | 15 | 190 | 1157191 | 8995.78 | 513 | 500 | 128.6 |
| A | 7 | 206 | 1015375 | 7892.86 | 513 | 500 | 128.6 |
| B | 10 | 254 | 1620800 | 9603.89 | 780 | 752 | 168.7 |
| B | 10 | 63 | 303985 | 1797.61 | 780 | 752 | 168.7 |
| B | 10 | 247 | 96150 | 565.53 | 780 | 752 | 168.7 |
| C | 7 | 80 | 799460 | 3936.65 | 745 | 737 | 202.9 |
| C | 9 | 38 | 781172 | 3846.51 | 745 | 737 | 202.9 |
| C | 12 | 254 | 478342 | 2353.96 | 745 | 737 | 202.9 |
| D | 2 | 62 | 2629116 | 13411.38 | 700 | 668 | 196.0 |
| D | 8 | 176 | 1260609 | 6428.71 | 700 | 668 | 196.0 |
| D | 2 | 37 | 862146 | 4395.6 | 700 | 668 | 196.0 |
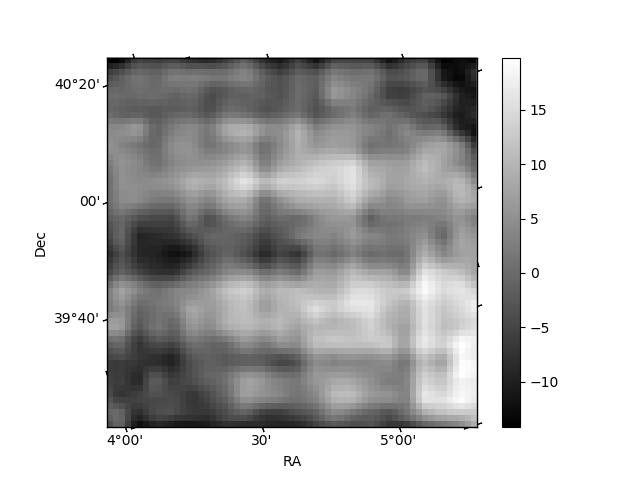
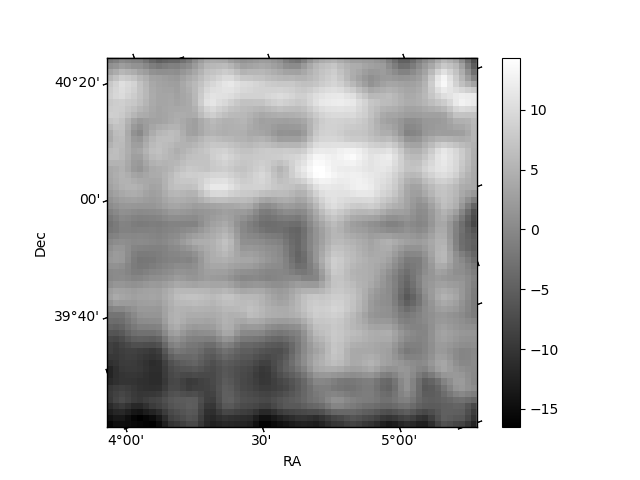
Histogram calculated using DETX and DETY for each event in the final _common_clean file
| Quadrant A | 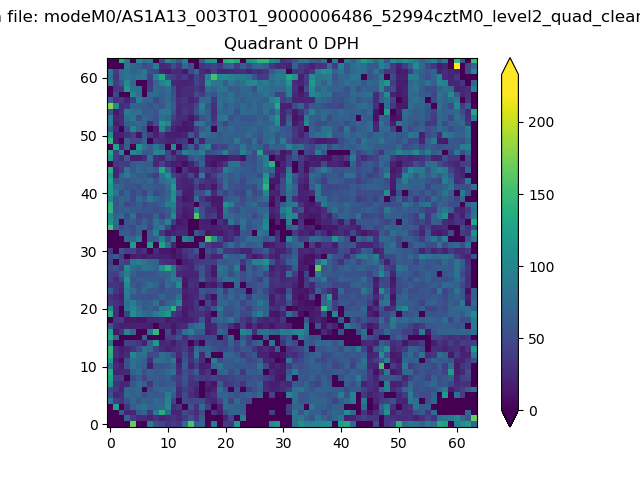 |
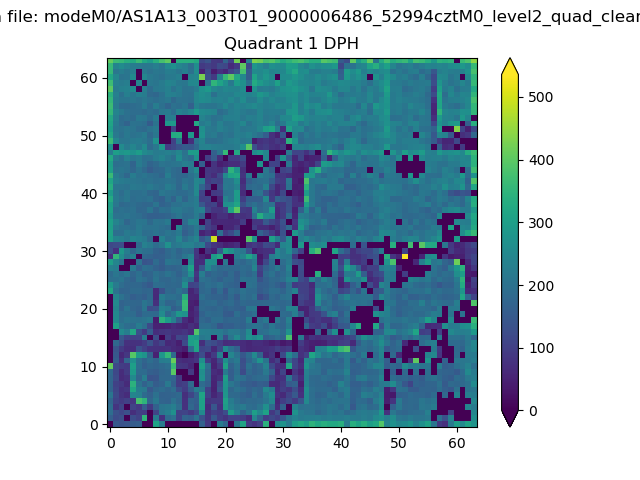 |
Quadrant B |
|---|---|---|---|
| Quadrant D | 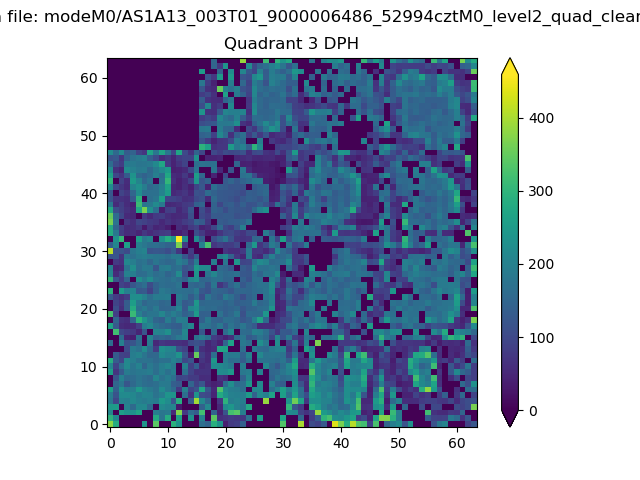 |
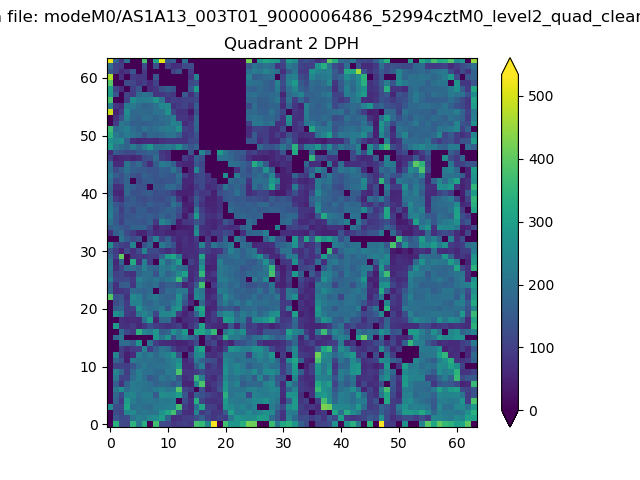 |
Quadrant C |
| Plot type | Count rate plots | Images |
|---|---|---|
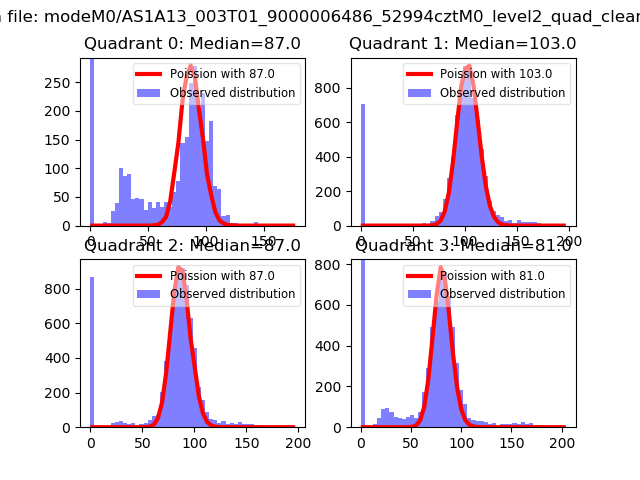
| Comparison with Poisson distribution Blue bars denote a histogram of data divided into 1 sec bins. Red curve is a Poisson curve with rate = median count rate of data. |
 |
 |
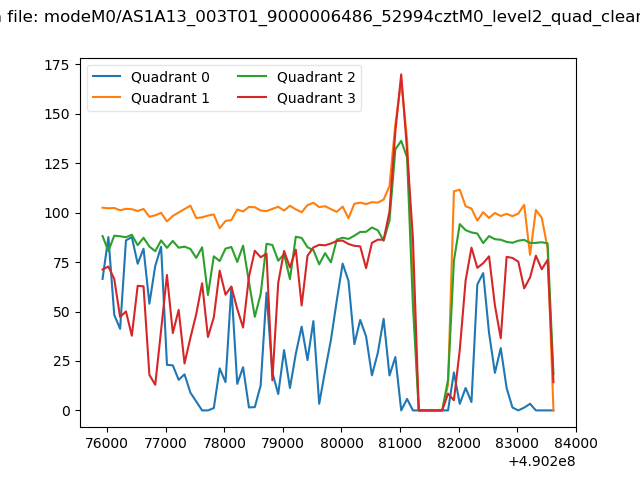
| Quadrant-wise count rates Data is divided into 100 sec bins |
 |
|
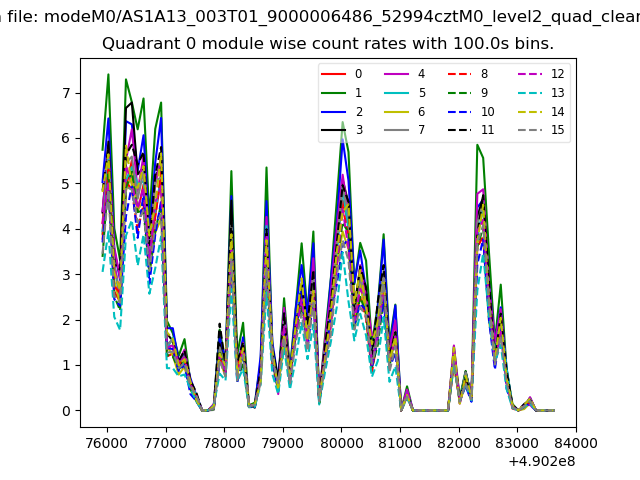
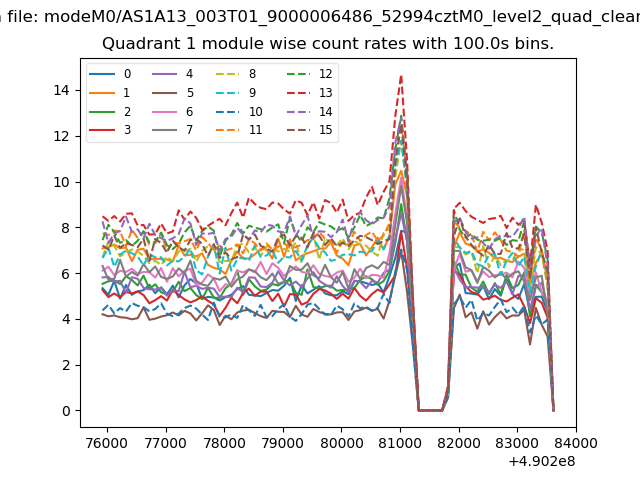
| Module-wise count rates for Quadrant A Data is divided into 100 sec bins |
 |
 |
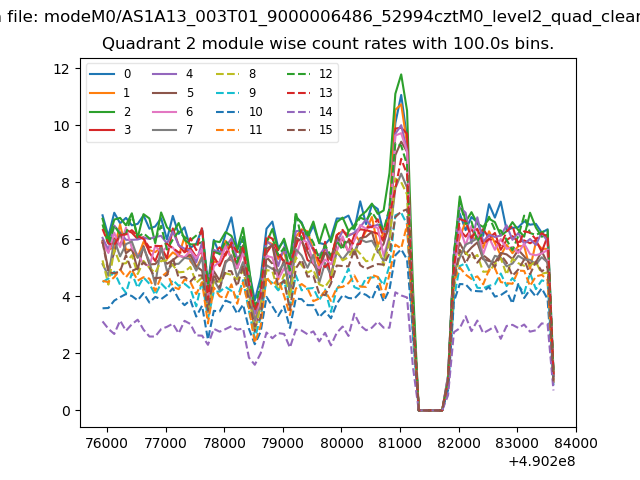
| Module-wise count rates for Quadrant B Data is divided into 100 sec bins |
 |
 |
| Module-wise count rates for Quadrant C Data is divided into 100 sec bins |
 |
 |
| Module-wise count rates for Quadrant D Data is divided into 100 sec bins |
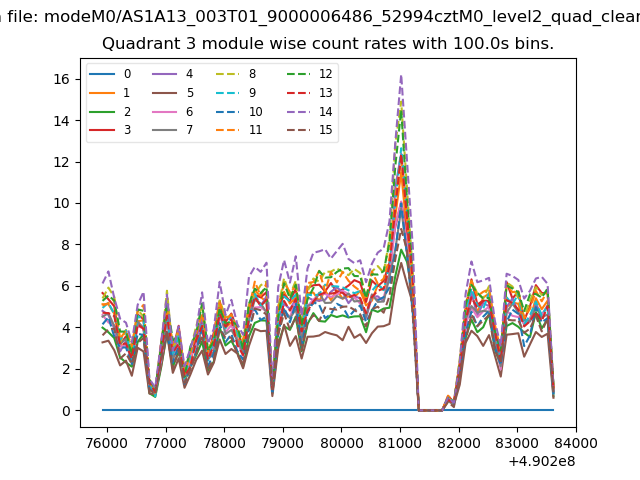 |
 |
| Parameter | Plot |
|---|---|
| CZT HV Monitor | 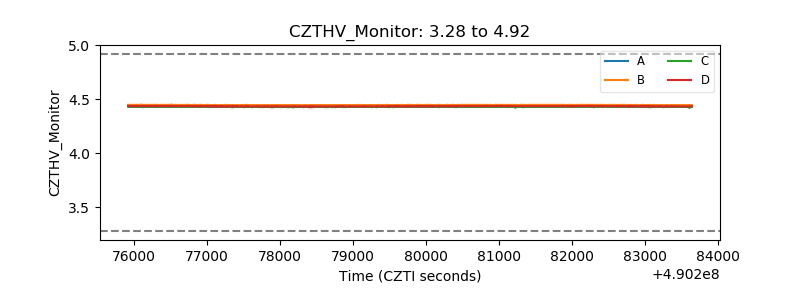 |
| D_VDD | 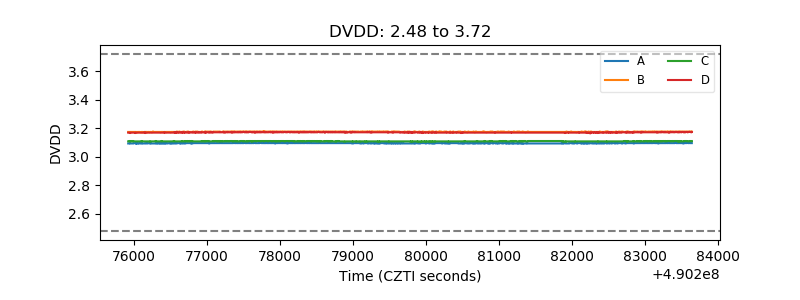 |
| Temperature 1 | 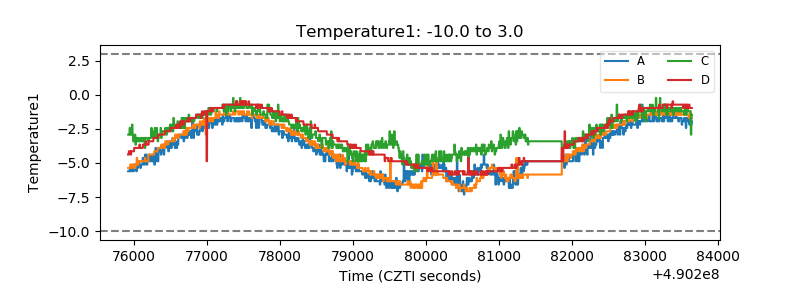 |
| Veto HV Monitor | 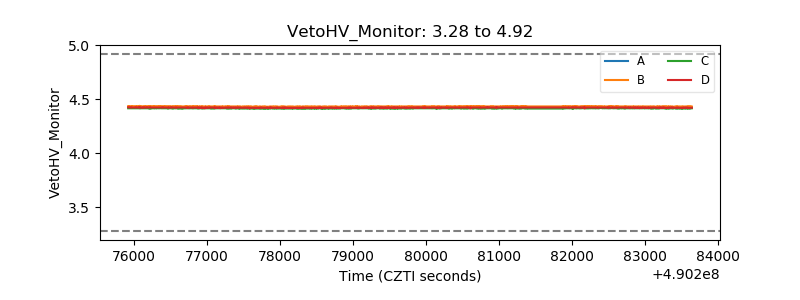 |
| Veto LLD | 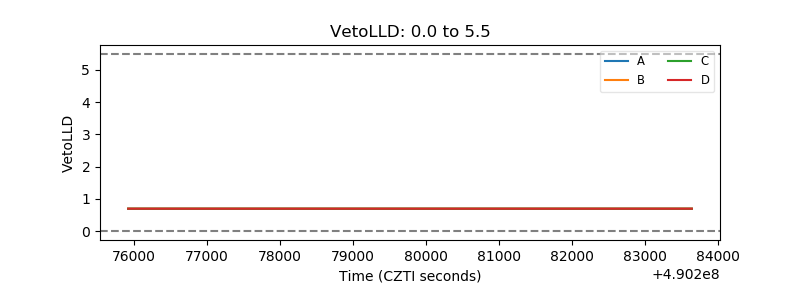 |
| Alpha Counter | 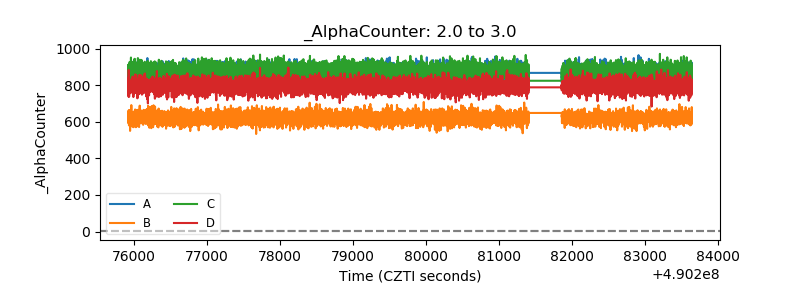 |
| _CPM_Rate | 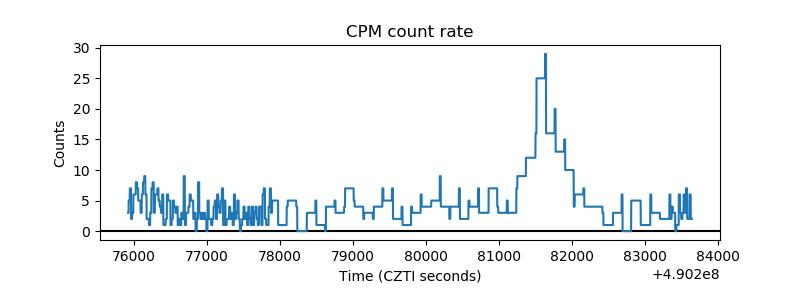 |
| CZT Counter | 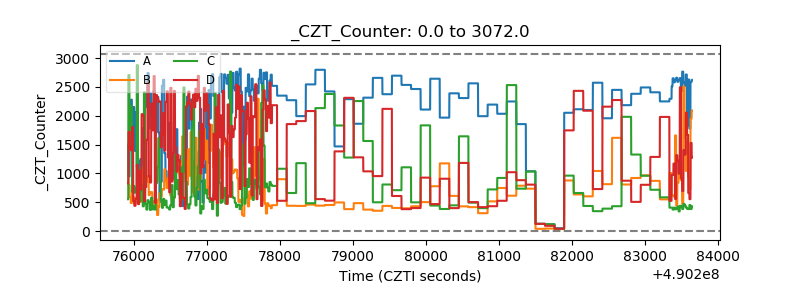 |
| +2.5 Volts monitor |  |
| +5 Volts monitor | 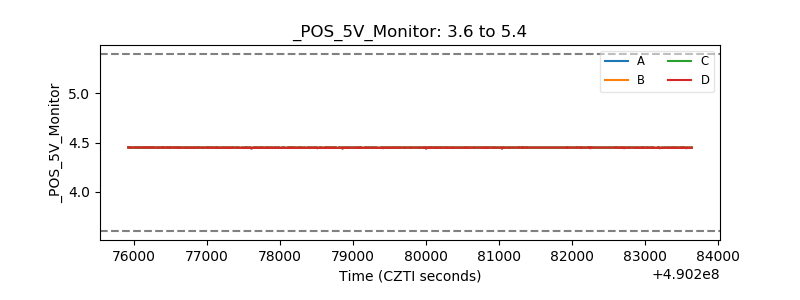 |
| _ROLL_ROT | 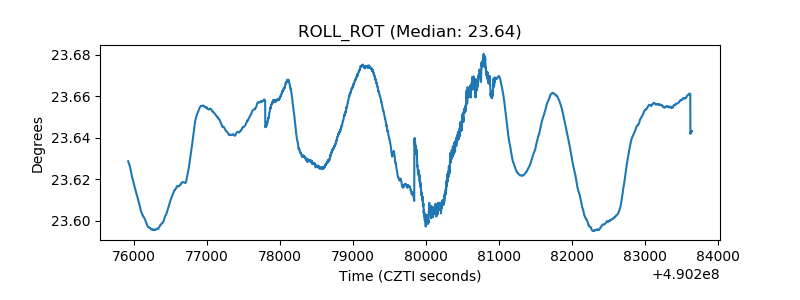 |
| _Roll_DEC | 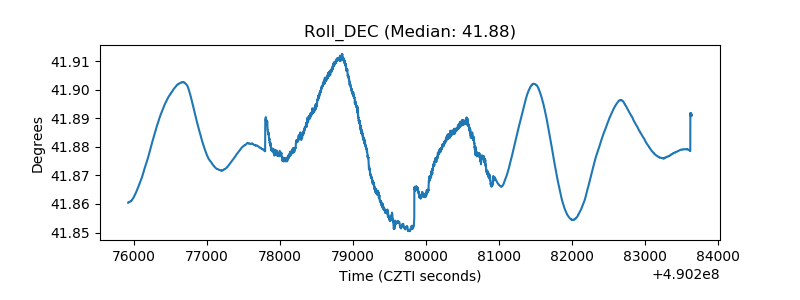 |
| _Roll_RA | 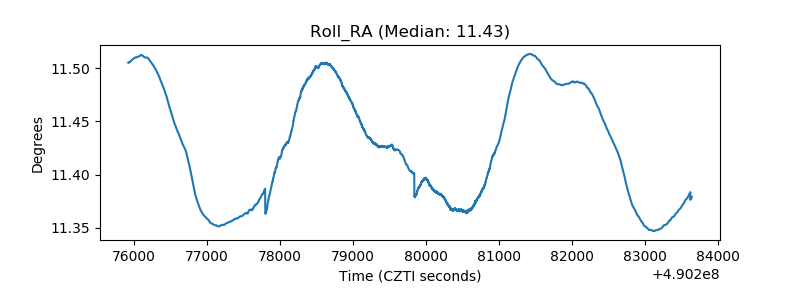 |
| Veto Counter | 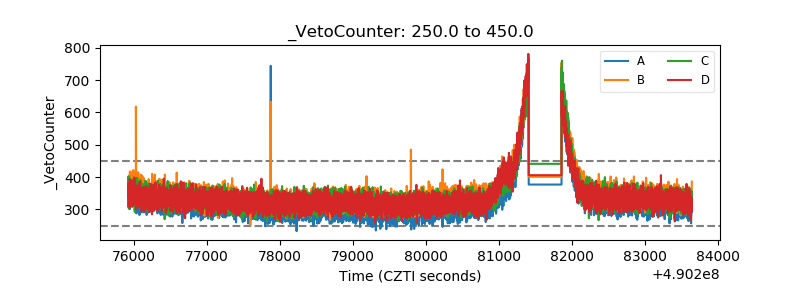 |