| Param | Original file | Final file |
|---|---|---|
| Filename | modeM0/AS1A13_003T01_9000006486_52995cztM0_level2.fits | modeM0/AS1A13_003T01_9000006486_52995cztM0_level2_quad_clean.evt |
| Size (bytes) | 1,068,471,360 | 82,851,840 |
| Size | 1019.0 MB | 79.0 MB |
| Events in quadrant A | 17,101,684 | 120,741 |
| Events in quadrant B | 5,308,021 | 749,272 |
| Events in quadrant C | 5,764,246 | 645,547 |
| Events in quadrant D | 10,803,146 | 475,748 |
| Mode M0 | |||
|---|---|---|---|
| Quadrant | BADHDUFLAG | Total packets | Discarded packets |
| A | 0 | 55901 | 2 |
| B | 0 | 21016 | 0 |
| C | 0 | 22348 | 0 |
| D | 0 | 37278 | 0 |
| Mode SS | |||
|---|---|---|---|
| Quadrant | BADHDUFLAG | Total packets | Discarded packets |
| A | 0 | 148 | 0 |
| B | 0 | 148 | 0 |
| C | 0 | 148 | 0 |
| D | 0 | 148 | 0 |
| Quadrant | Total seconds | Saturated seconds | Saturation percentage |
|---|---|---|---|
| A | 7427 | 6394 | 86.091289% |
| B | 7427 | 540 | 7.270769% |
| C | 7428 | 562 | 7.565967% |
| D | 7428 | 2522 | 33.952612% |
Noise dominated data is calculated using 1-second bins in cleaned event files. If a bin has >2000 counts, and if more than 50% of those come from <1% of pixels, then it is considered to be noise-dominated and hence unusable.
| Quadrant | # 1 sec bins | Bins with >0 counts | Bins with >2000 counts | High rate bins dominated by noise | Noise dominated (total time) | Noise dominated (detector-on time) | Marked lightcurve |
|---|---|---|---|---|---|---|---|
| A | 7427 | 7427 | 5153 | 5153 | 69.38% | 69.38% | 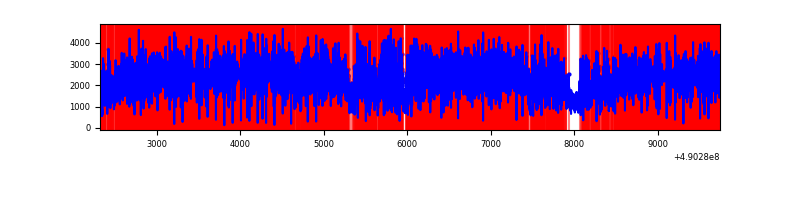 |
| B | 7427 | 7427 | 281 | 281 | 3.78% | 3.78% | 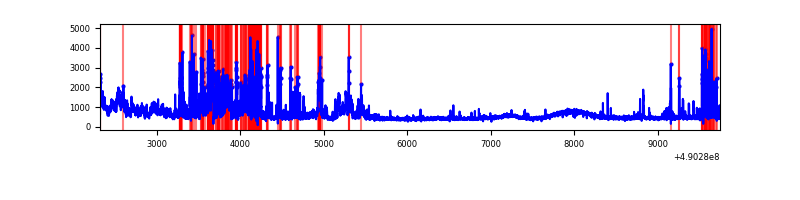 |
| C | 7428 | 7428 | 417 | 417 | 5.61% | 5.61% | 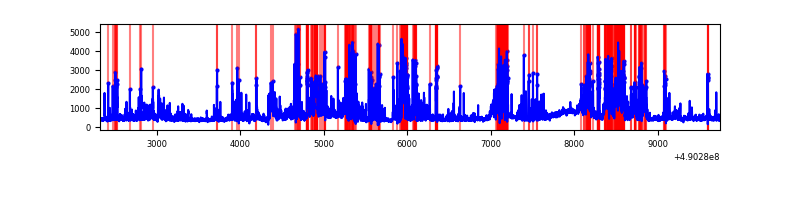 |
| D | 7428 | 7428 | 1873 | 1873 | 25.22% | 25.22% | 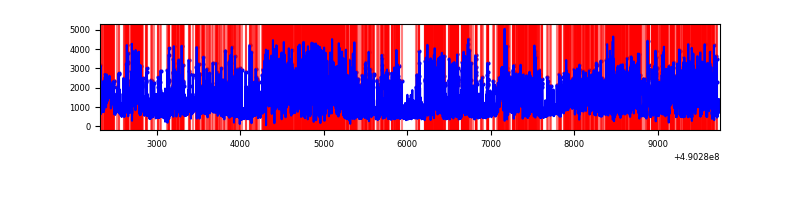 |
Top three noisy pixels from each quadrant. If the there are fewer than three noisy pixels in the level2.evt file, extra rows are filled as -1
| Pixel properties | Quadrant properties | ||||||
|---|---|---|---|---|---|---|---|
| Quadrant | DetID | PixID | Counts | Sigma | Mean | Median | Sigma |
| A | 9 | 191 | 13241371 | 117041.9 | 452 | 440 | 113.1 |
| A | 15 | 190 | 1112969 | 9834.09 | 452 | 440 | 113.1 |
| A | 7 | 206 | 632723 | 5589.0 | 452 | 440 | 113.1 |
| B | 10 | 254 | 631434 | 3598.71 | 802 | 772 | 175.2 |
| B | 10 | 63 | 580261 | 3306.7 | 802 | 772 | 175.2 |
| B | 5 | 172 | 402457 | 2292.11 | 802 | 772 | 175.2 |
| C | 12 | 254 | 1454887 | 6891.77 | 778 | 768 | 211.0 |
| C | 7 | 80 | 401072 | 1897.23 | 778 | 768 | 211.0 |
| C | 1 | 241 | 335406 | 1586.01 | 778 | 768 | 211.0 |
| D | 2 | 62 | 5349736 | 26586.91 | 697 | 663 | 201.2 |
| D | 8 | 176 | 949809 | 4717.61 | 697 | 663 | 201.2 |
| D | 0 | 5 | 280664 | 1391.71 | 697 | 663 | 201.2 |
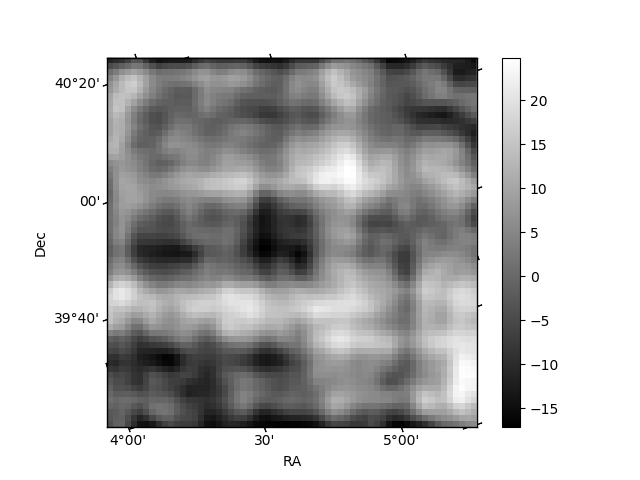
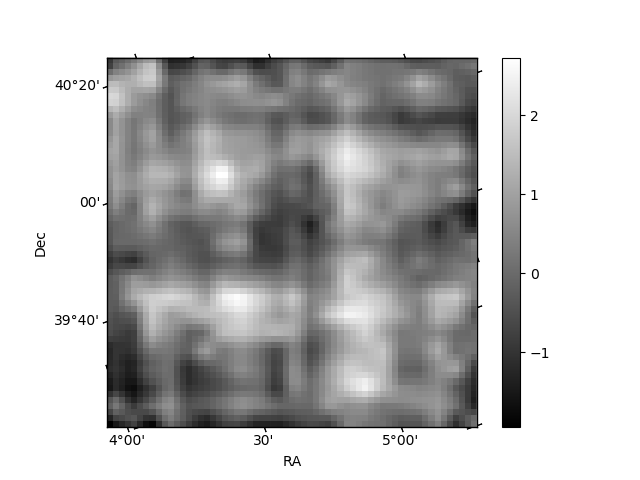
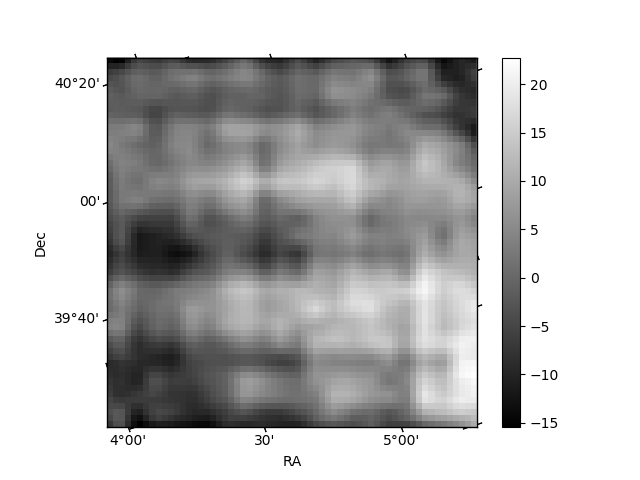
Histogram calculated using DETX and DETY for each event in the final _common_clean file
| Quadrant A | 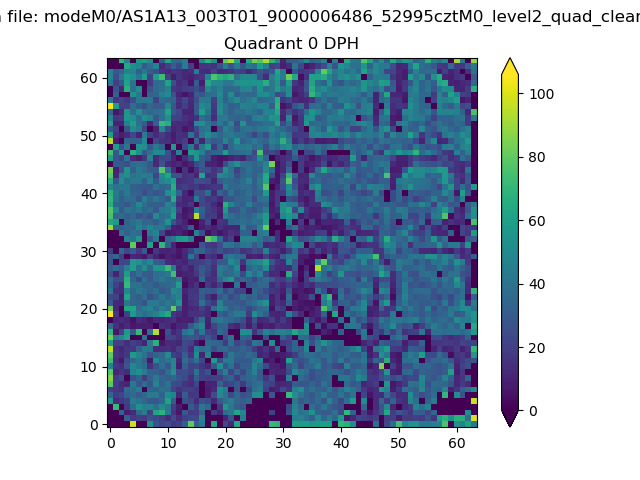 |
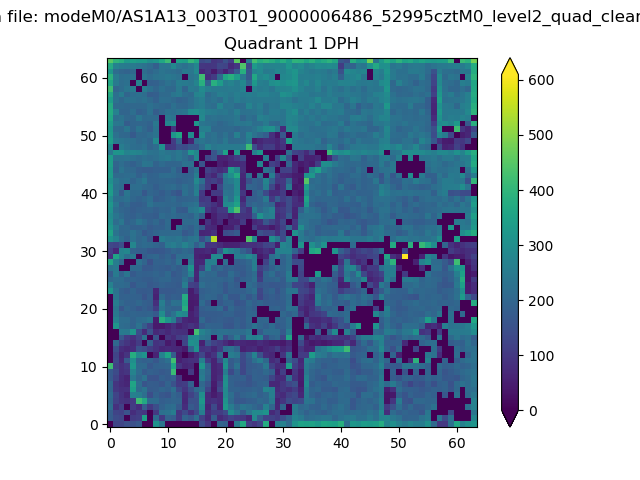 |
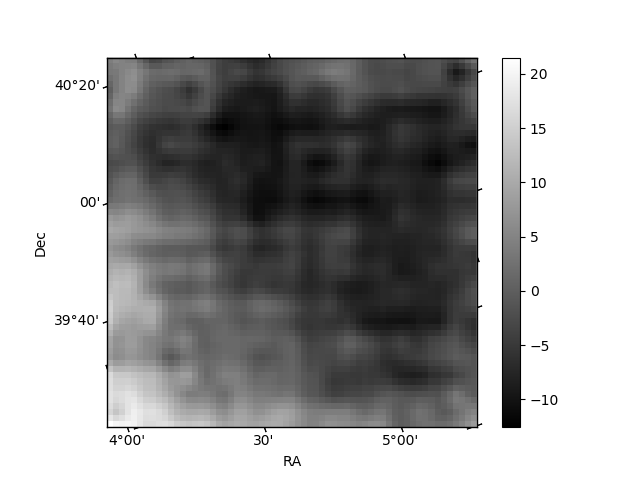
Quadrant B |
|---|---|---|---|
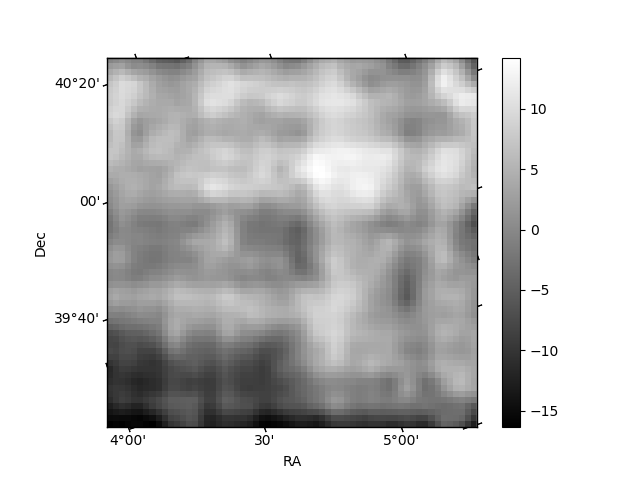
| Quadrant D | 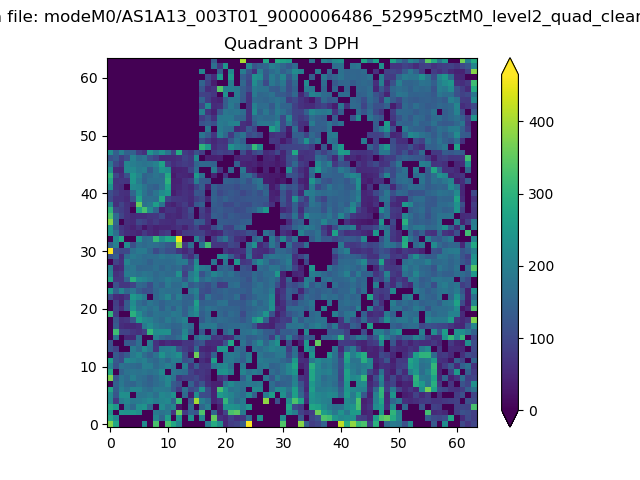 |
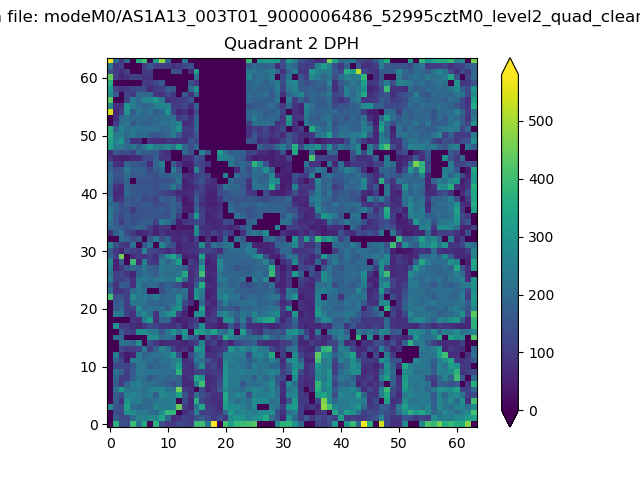 |
Quadrant C |
| Plot type | Count rate plots | Images |
|---|---|---|
| Comparison with Poisson distribution Blue bars denote a histogram of data divided into 1 sec bins. Red curve is a Poisson curve with rate = median count rate of data. |
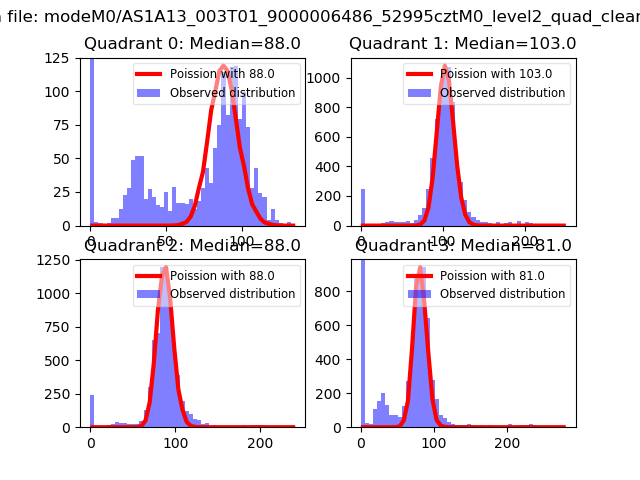 |
 |
| Quadrant-wise count rates Data is divided into 100 sec bins |
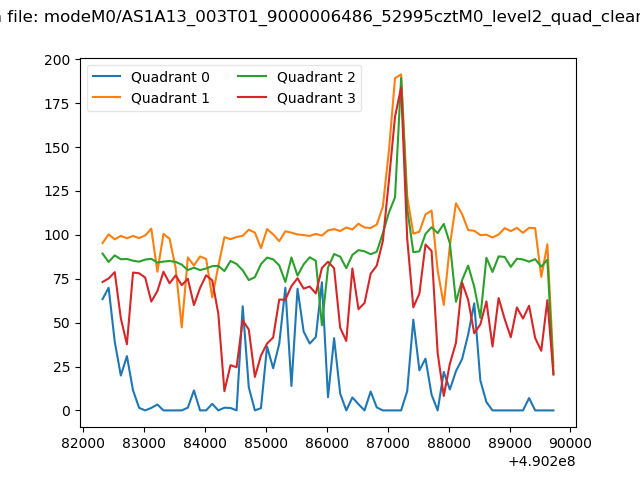 |
|
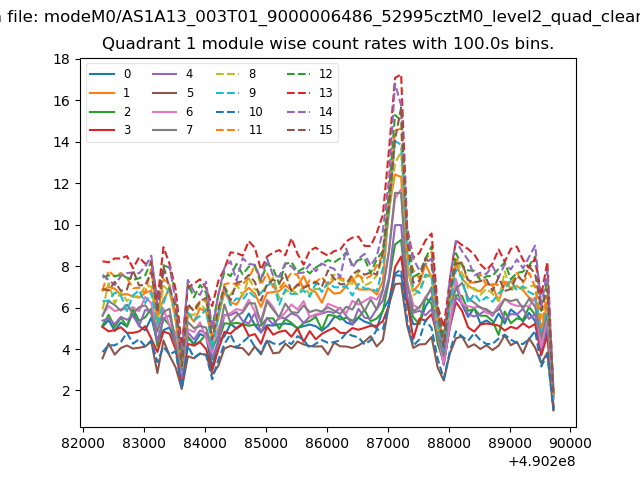
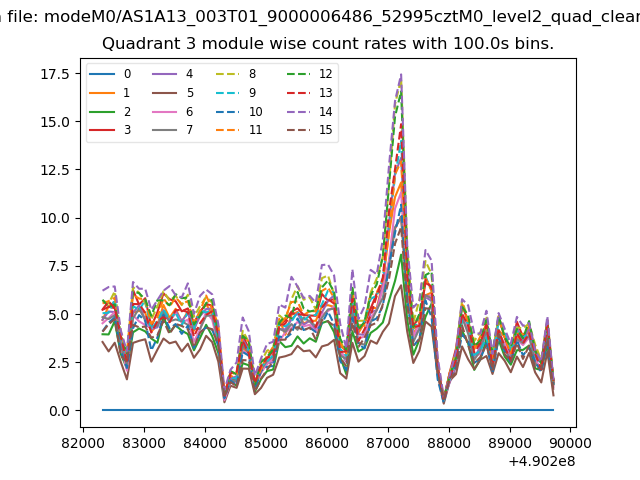
| Module-wise count rates for Quadrant A Data is divided into 100 sec bins |
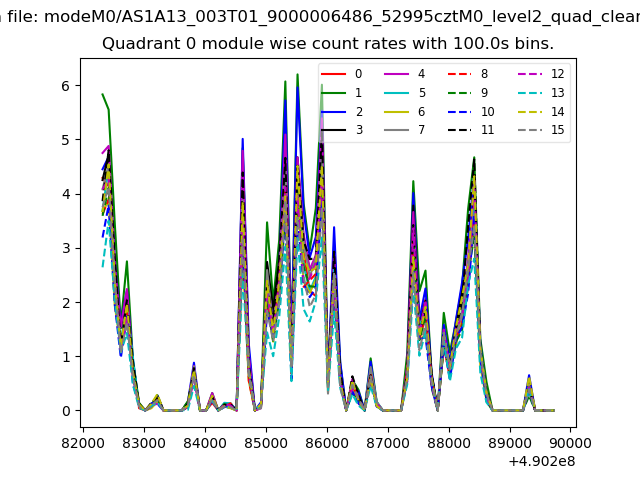 |
 |
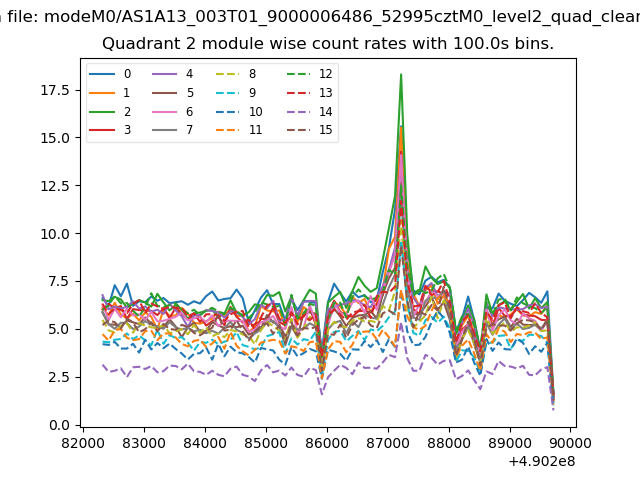
| Module-wise count rates for Quadrant B Data is divided into 100 sec bins |
 |
 |
| Module-wise count rates for Quadrant C Data is divided into 100 sec bins |
 |
 |
| Module-wise count rates for Quadrant D Data is divided into 100 sec bins |
 |
 |
| Parameter | Plot |
|---|---|
| CZT HV Monitor | 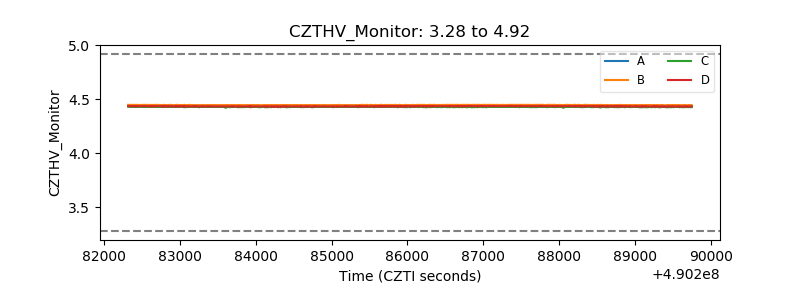 |
| D_VDD | 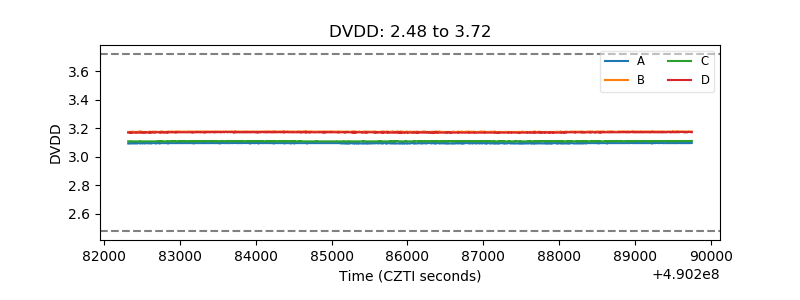 |
| Temperature 1 | 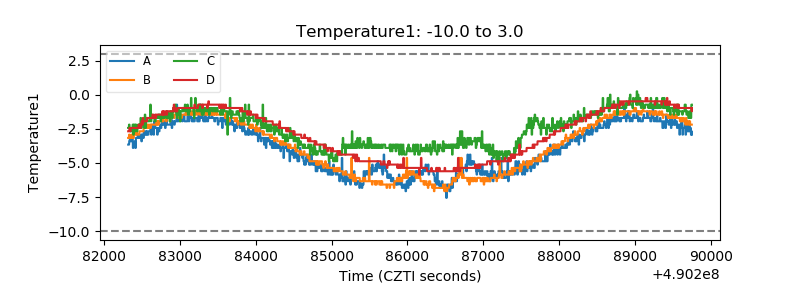 |
| Veto HV Monitor | 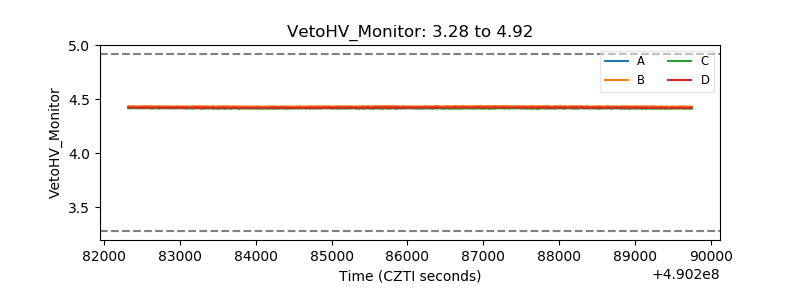 |
| Veto LLD | 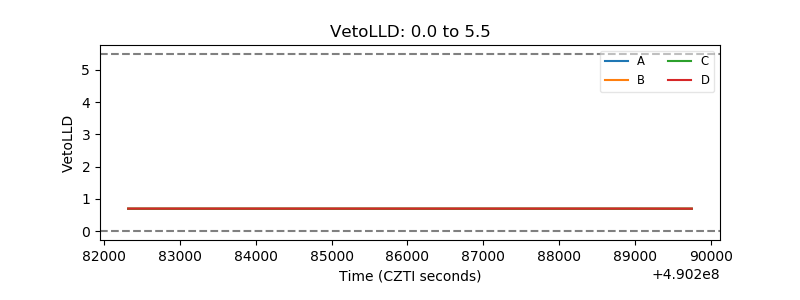 |
| Alpha Counter | 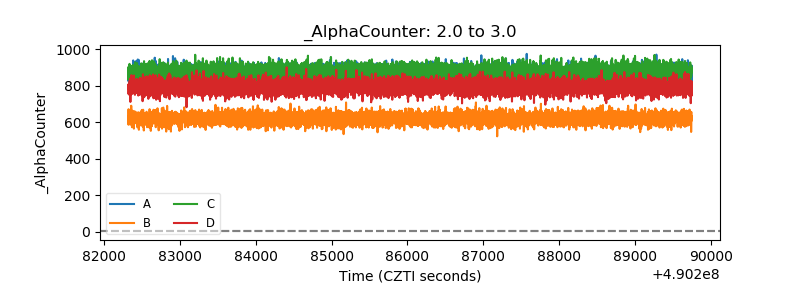 |
| _CPM_Rate | 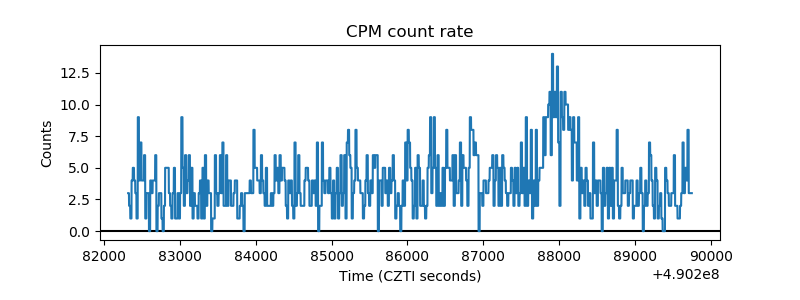 |
| CZT Counter | 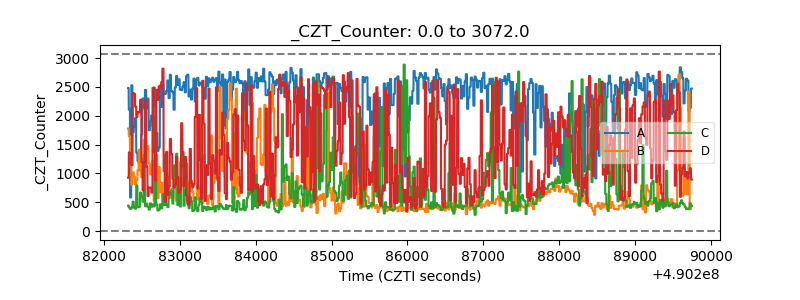 |
| +2.5 Volts monitor |  |
| +5 Volts monitor | 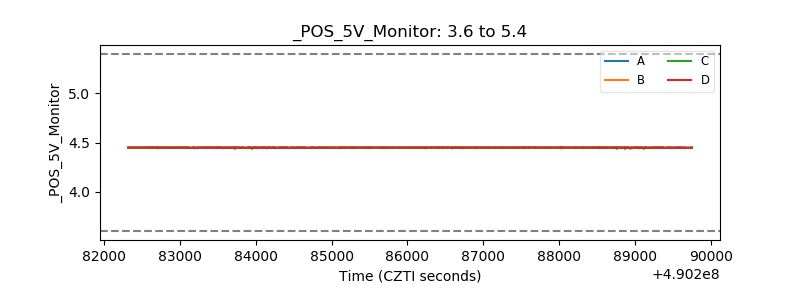 |
| _ROLL_ROT | 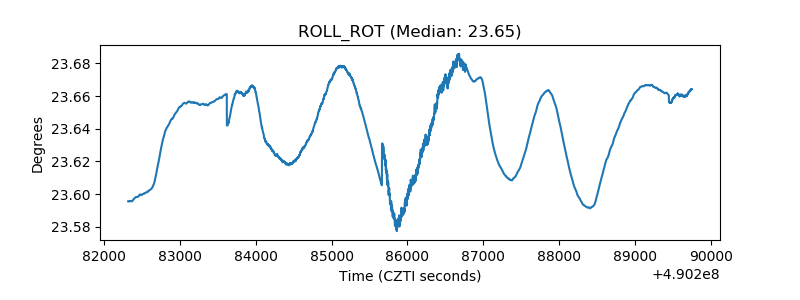 |
| _Roll_DEC | 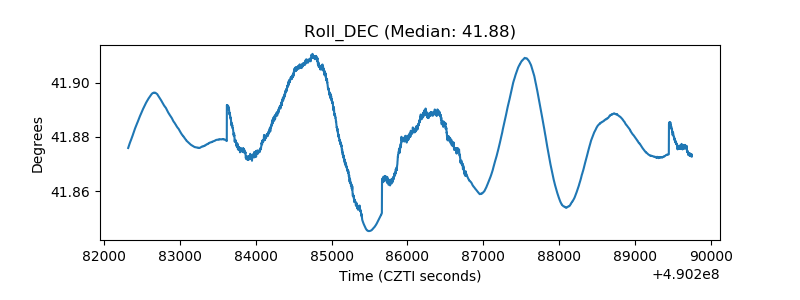 |
| _Roll_RA | 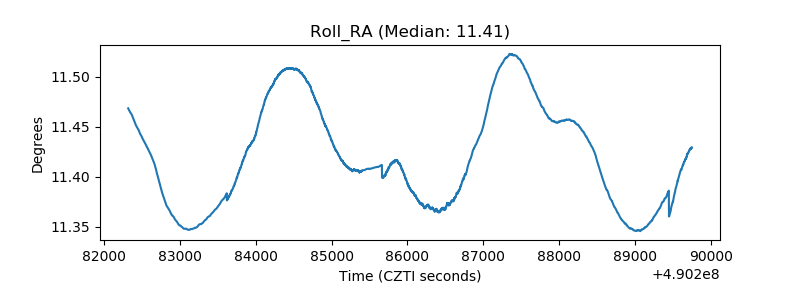 |
| Veto Counter | 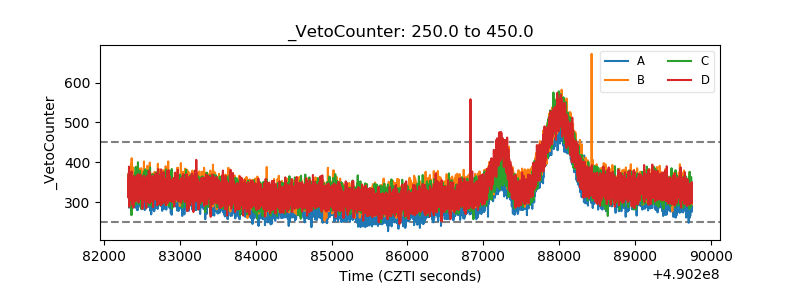 |