| Param | Original file | Final file |
|---|---|---|
| Filename | modeM0/AS1A13_003T01_9000006486_52996cztM0_level2.fits | modeM0/AS1A13_003T01_9000006486_52996cztM0_level2_quad_clean.evt |
| Size (bytes) | 1,076,244,480 | 86,132,160 |
| Size | 1.0 GB | 82.1 MB |
| Events in quadrant A | 16,020,632 | 256,720 |
| Events in quadrant B | 4,292,892 | 777,086 |
| Events in quadrant C | 7,584,875 | 578,212 |
| Events in quadrant D | 11,348,835 | 462,355 |
| Mode M0 | |||
|---|---|---|---|
| Quadrant | BADHDUFLAG | Total packets | Discarded packets |
| A | 0 | 52875 | 2 |
| B | 0 | 18035 | 0 |
| C | 0 | 27921 | 0 |
| D | 0 | 38999 | 0 |
| Mode SS | |||
|---|---|---|---|
| Quadrant | BADHDUFLAG | Total packets | Discarded packets |
| A | 0 | 154 | 0 |
| B | 0 | 154 | 0 |
| C | 0 | 154 | 0 |
| D | 0 | 154 | 0 |
| Quadrant | Total seconds | Saturated seconds | Saturation percentage |
|---|---|---|---|
| A | 7659 | 5345 | 69.787178% |
| B | 7660 | 186 | 2.428198% |
| C | 7660 | 1309 | 17.088773% |
| D | 7660 | 2676 | 34.934726% |
Noise dominated data is calculated using 1-second bins in cleaned event files. If a bin has >2000 counts, and if more than 50% of those come from <1% of pixels, then it is considered to be noise-dominated and hence unusable.
| Quadrant | # 1 sec bins | Bins with >0 counts | Bins with >2000 counts | High rate bins dominated by noise | Noise dominated (total time) | Noise dominated (detector-on time) | Marked lightcurve |
|---|---|---|---|---|---|---|---|
| A | 7659 | 7659 | 4606 | 4606 | 60.14% | 60.14% | 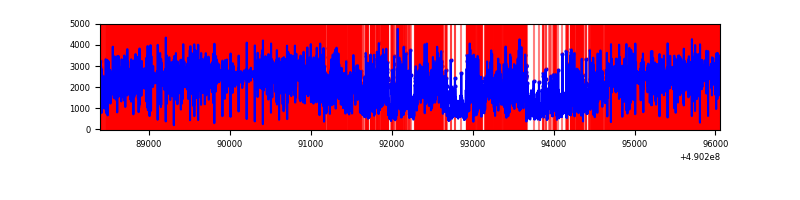 |
| B | 7660 | 7660 | 93 | 93 | 1.21% | 1.21% | 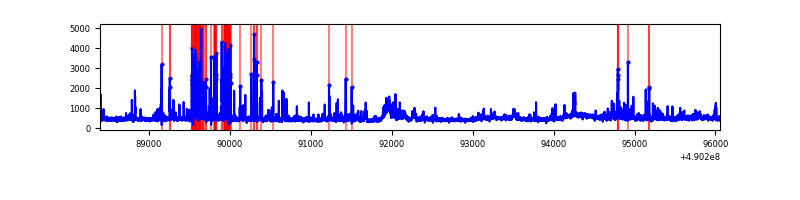 |
| C | 7660 | 7660 | 1121 | 1121 | 14.63% | 14.63% | 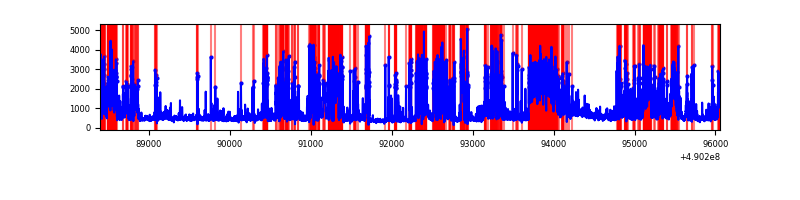 |
| D | 7660 | 7660 | 2079 | 2079 | 27.14% | 27.14% | 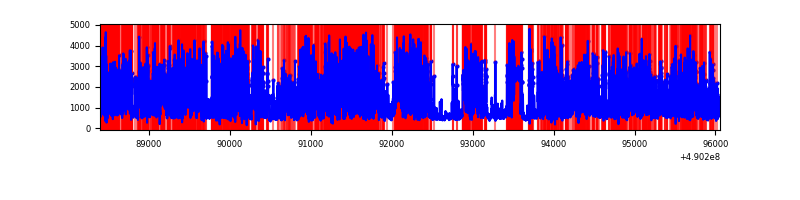 |
Top three noisy pixels from each quadrant. If the there are fewer than three noisy pixels in the level2.evt file, extra rows are filled as -1
| Pixel properties | Quadrant properties | ||||||
|---|---|---|---|---|---|---|---|
| Quadrant | DetID | PixID | Counts | Sigma | Mean | Median | Sigma |
| A | 9 | 191 | 10417421 | 82168.57 | 505 | 493 | 126.8 |
| A | 15 | 190 | 1642454 | 12951.76 | 505 | 493 | 126.8 |
| A | 7 | 206 | 1168323 | 9211.82 | 505 | 493 | 126.8 |
| B | 10 | 63 | 380771 | 2156.78 | 815 | 785 | 176.2 |
| B | 10 | 254 | 252121 | 1426.57 | 815 | 785 | 176.2 |
| B | 10 | 247 | 104002 | 585.85 | 815 | 785 | 176.2 |
| C | 12 | 254 | 2436674 | 12153.76 | 737 | 729 | 200.4 |
| C | 15 | 148 | 823722 | 4106.19 | 737 | 729 | 200.4 |
| C | 15 | 149 | 285878 | 1422.71 | 737 | 729 | 200.4 |
| D | 2 | 62 | 7073479 | 35730.72 | 689 | 658 | 197.9 |
| D | 8 | 176 | 171240 | 861.75 | 689 | 658 | 197.9 |
| D | 11 | 176 | 148121 | 744.96 | 689 | 658 | 197.9 |
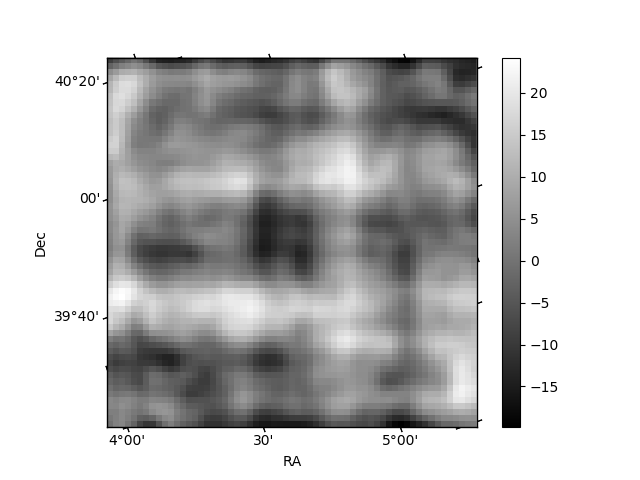
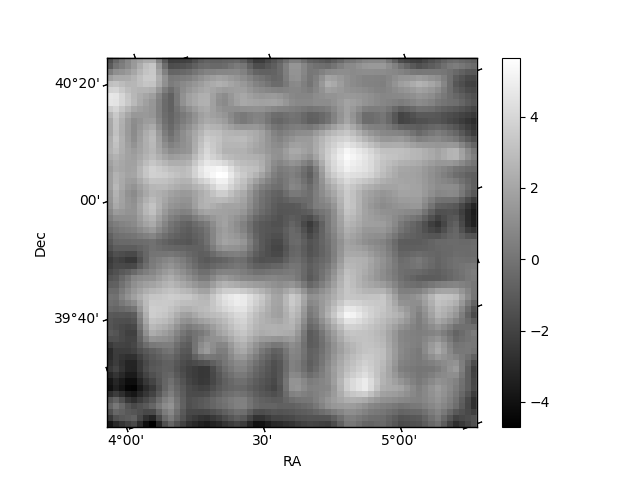
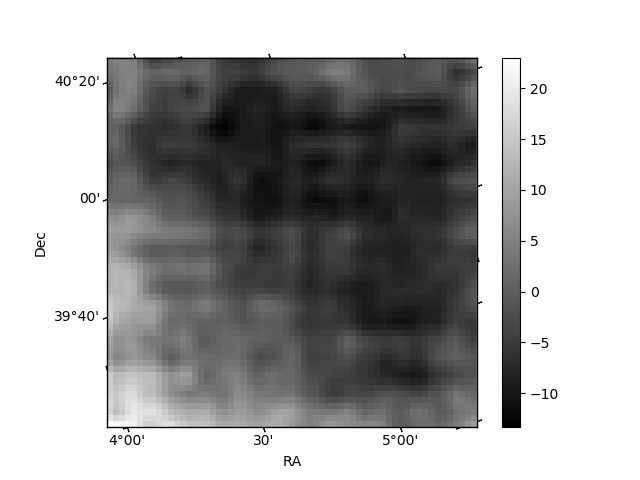
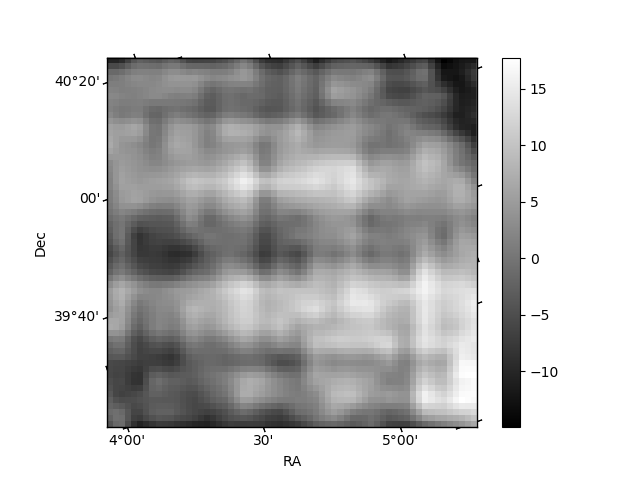
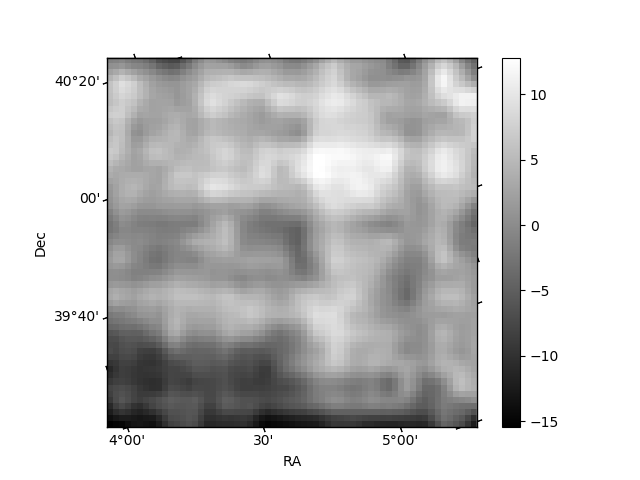
Histogram calculated using DETX and DETY for each event in the final _common_clean file
| Quadrant A | 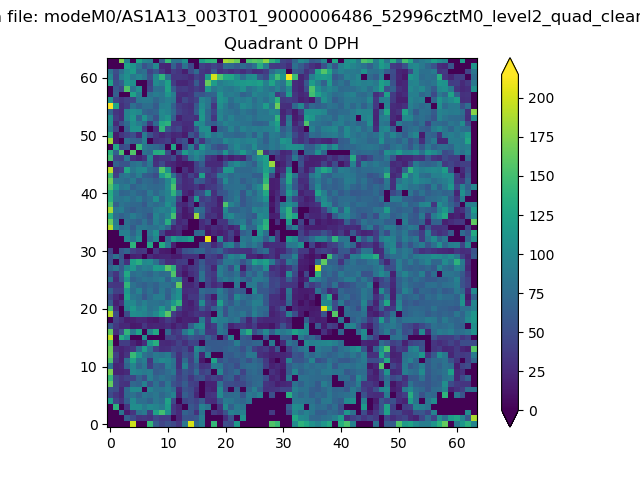 |
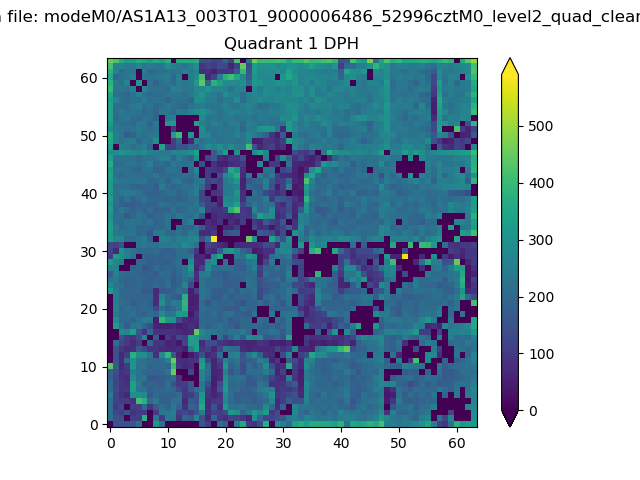 |
Quadrant B |
|---|---|---|---|
| Quadrant D | 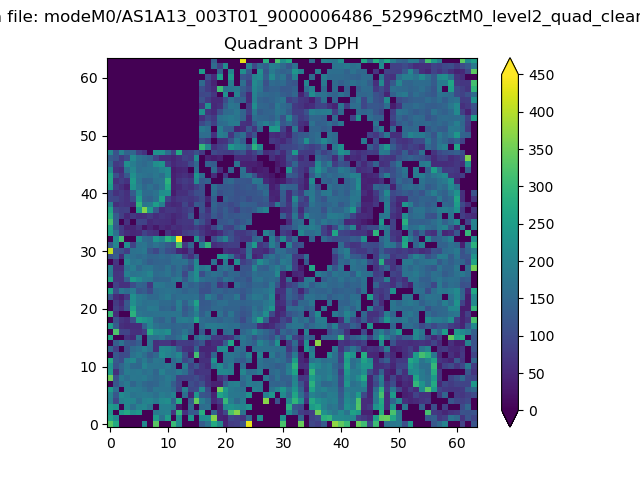 |
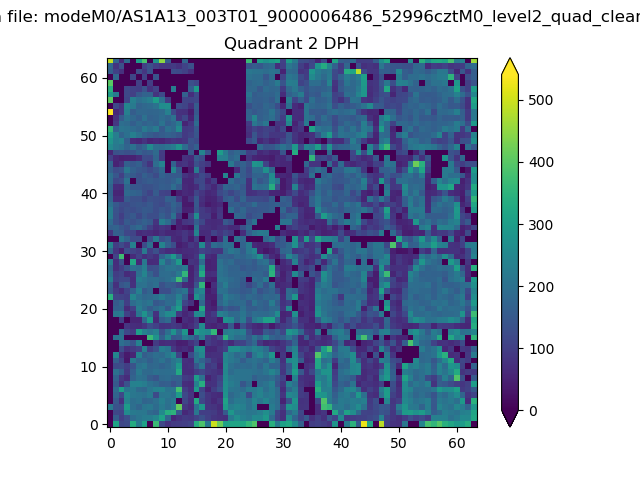 |
Quadrant C |
| Plot type | Count rate plots | Images |
|---|---|---|
| Comparison with Poisson distribution Blue bars denote a histogram of data divided into 1 sec bins. Red curve is a Poisson curve with rate = median count rate of data. |
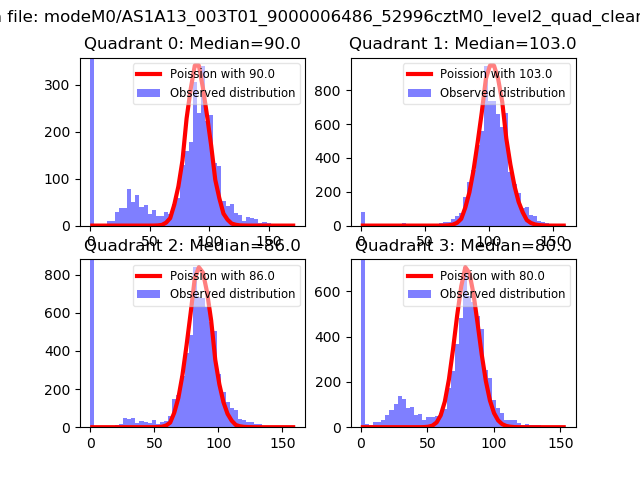 |
 |
| Quadrant-wise count rates Data is divided into 100 sec bins |
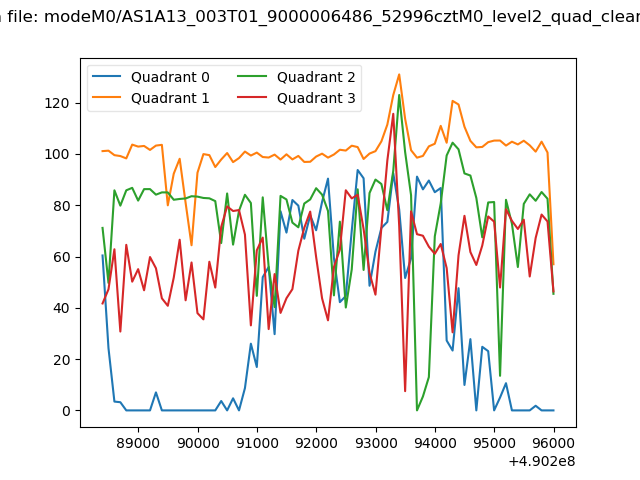 |
|
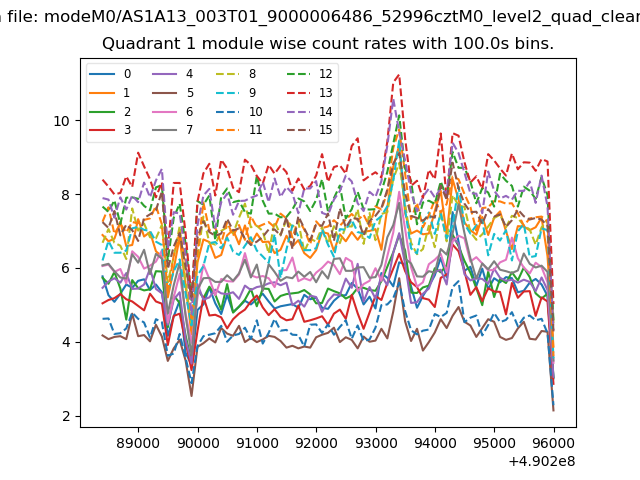
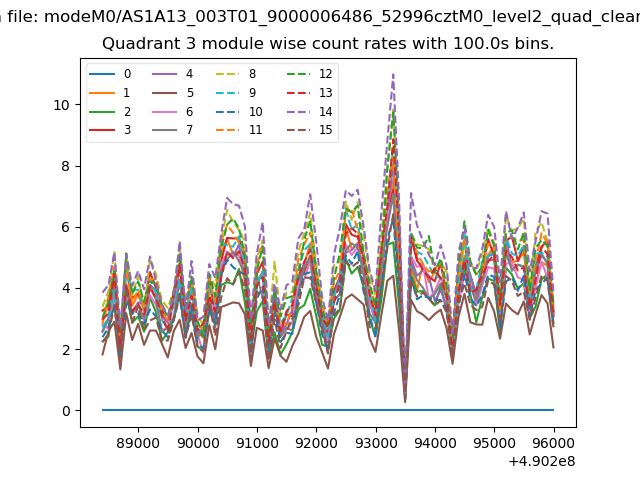
| Module-wise count rates for Quadrant A Data is divided into 100 sec bins |
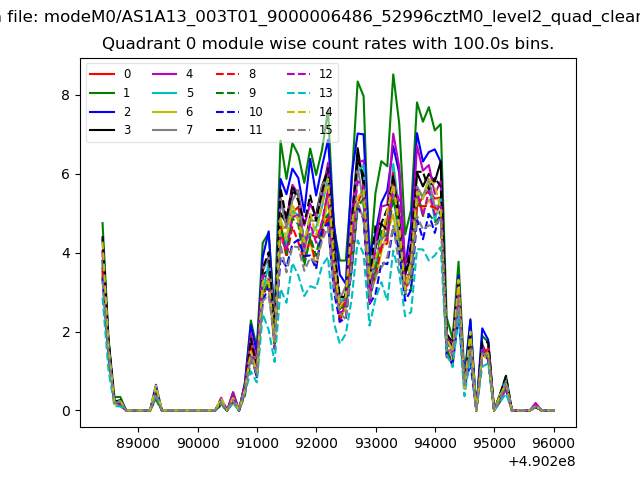 |
 |
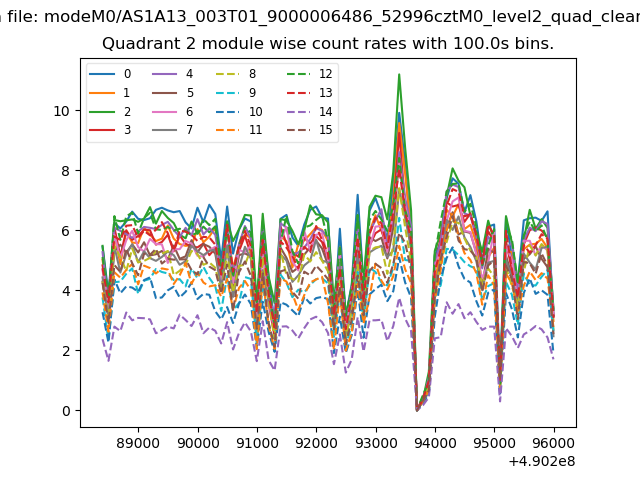
| Module-wise count rates for Quadrant B Data is divided into 100 sec bins |
 |
 |
| Module-wise count rates for Quadrant C Data is divided into 100 sec bins |
 |
 |
| Module-wise count rates for Quadrant D Data is divided into 100 sec bins |
 |
 |
| Parameter | Plot |
|---|---|
| CZT HV Monitor | 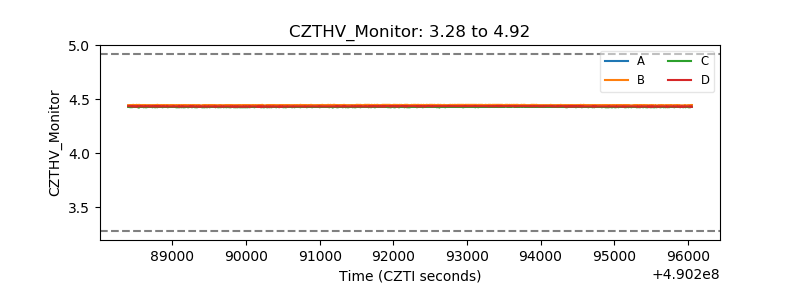 |
| D_VDD | 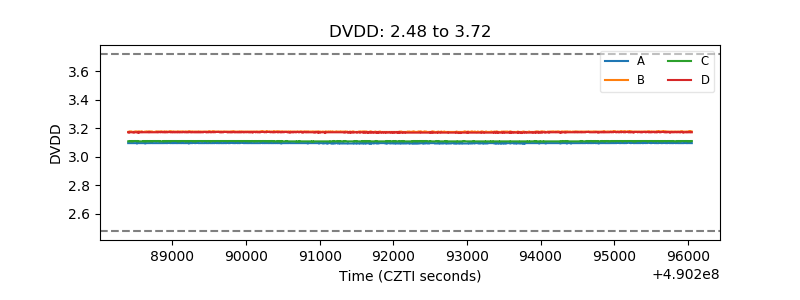 |
| Temperature 1 | 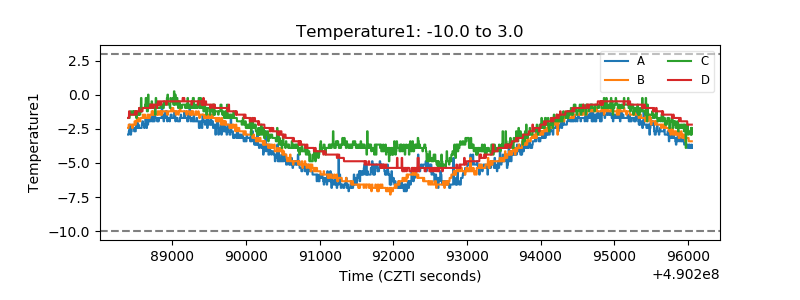 |
| Veto HV Monitor | 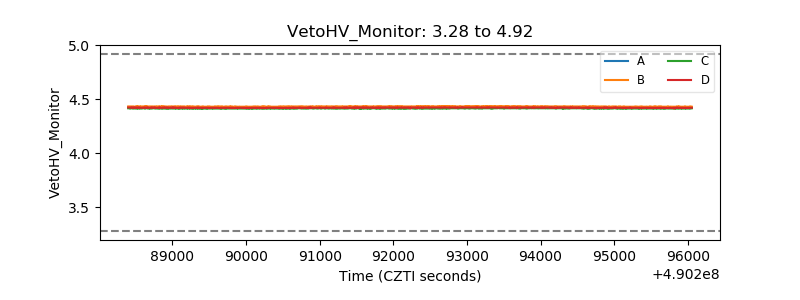 |
| Veto LLD | 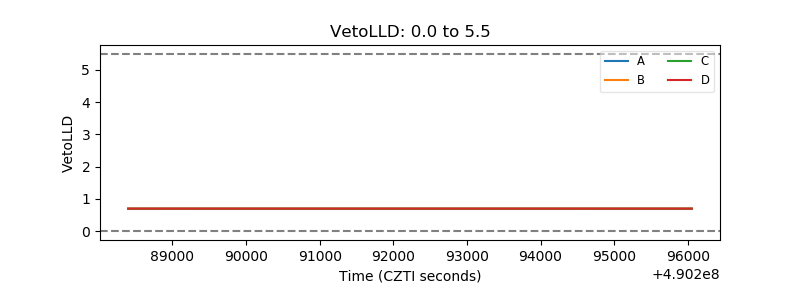 |
| Alpha Counter | 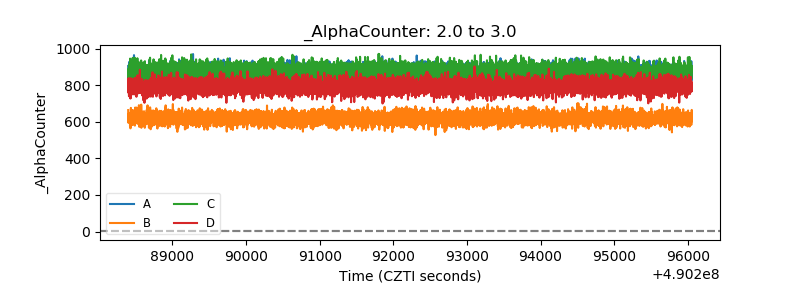 |
| _CPM_Rate | 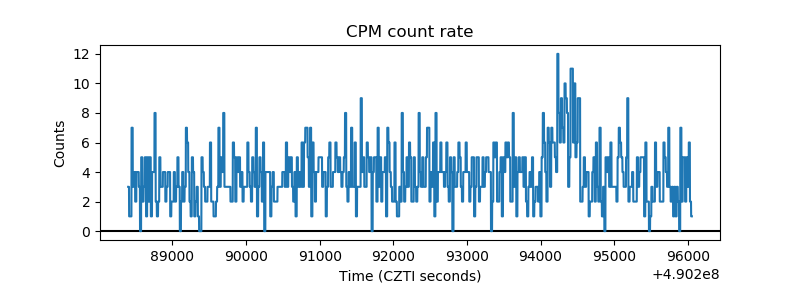 |
| CZT Counter | 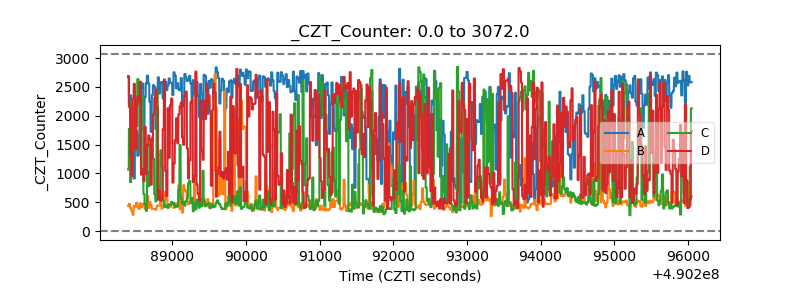 |
| +2.5 Volts monitor | 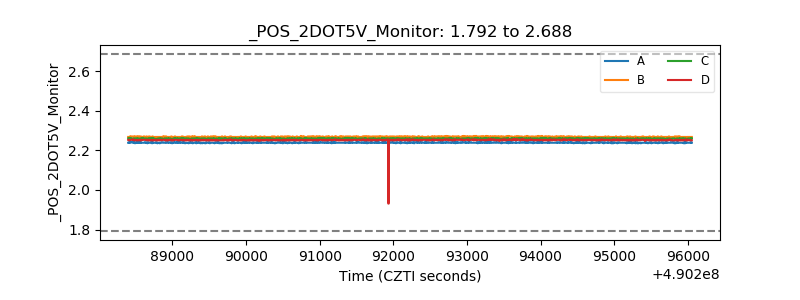 |
| +5 Volts monitor |  |
| _ROLL_ROT | 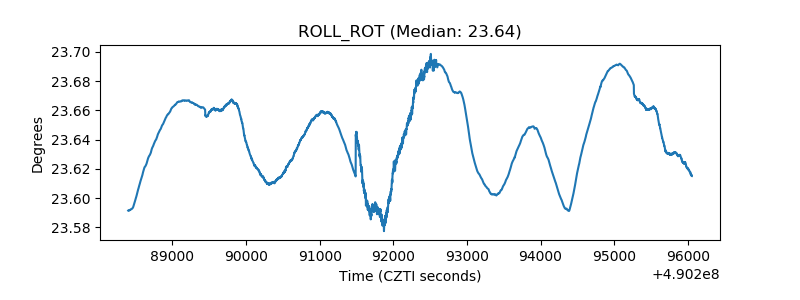 |
| _Roll_DEC | 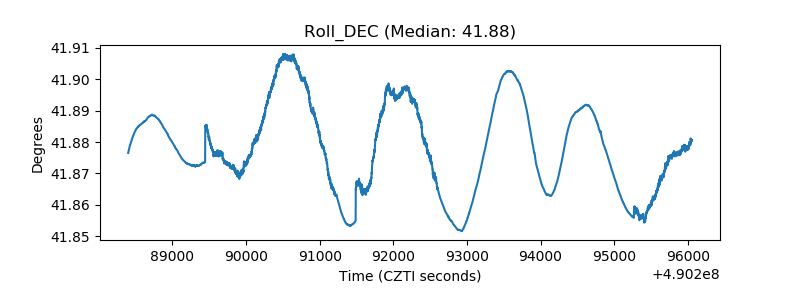 |
| _Roll_RA | 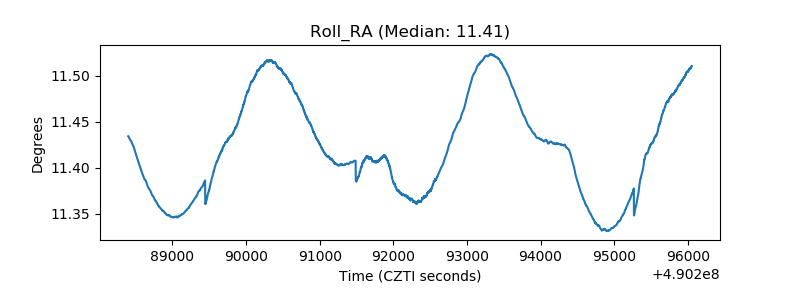 |
| Veto Counter | 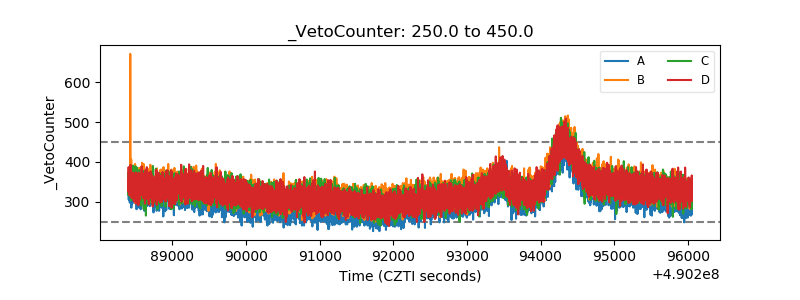 |