| Param | Original file | Final file |
|---|---|---|
| Filename | modeM0/AS1A13_003T01_9000006486_53000cztM0_level2.fits | modeM0/AS1A13_003T01_9000006486_53000cztM0_level2_quad_clean.evt |
| Size (bytes) | 3,689,922,240 | 248,506,560 |
| Size | 3.4 GB | 237.0 MB |
| Events in quadrant A | 55,825,986 | 533,448 |
| Events in quadrant B | 13,611,362 | 2,512,951 |
| Events in quadrant C | 37,402,072 | 1,200,477 |
| Events in quadrant D | 27,858,470 | 1,583,457 |
| Mode M9 | |||
|---|---|---|---|
| Quadrant | BADHDUFLAG | Total packets | Discarded packets |
| A | 0 | 18 | 0 |
| B | 0 | 18 | 0 |
| C | 0 | 18 | 0 |
| D | 0 | 18 | 0 |
| Mode M0 | |||
|---|---|---|---|
| Quadrant | BADHDUFLAG | Total packets | Discarded packets |
| A | 0 | 182614 | 9 |
| B | 0 | 57408 | 3 |
| C | 0 | 128245 | 17 |
| D | 0 | 99792 | 3 |
| Mode SS | |||
|---|---|---|---|
| Quadrant | BADHDUFLAG | Total packets | Discarded packets |
| A | 0 | 498 | 0 |
| B | 0 | 498 | 0 |
| C | 0 | 498 | 0 |
| D | 0 | 498 | 0 |
| Quadrant | Total seconds | Saturated seconds | Saturation percentage |
|---|---|---|---|
| A | 24588 | 19763 | 80.376606% |
| B | 24589 | 460 | 1.870755% |
| C | 24587 | 10732 | 43.649083% |
| D | 24589 | 5431 | 22.087112% |
Noise dominated data is calculated using 1-second bins in cleaned event files. If a bin has >2000 counts, and if more than 50% of those come from <1% of pixels, then it is considered to be noise-dominated and hence unusable.
| Quadrant | # 1 sec bins | Bins with >0 counts | Bins with >2000 counts | High rate bins dominated by noise | Noise dominated (total time) | Noise dominated (detector-on time) | Marked lightcurve |
|---|---|---|---|---|---|---|---|
| A | 26378 | 24588 | 17104 | 17104 | 64.84% | 69.56% | 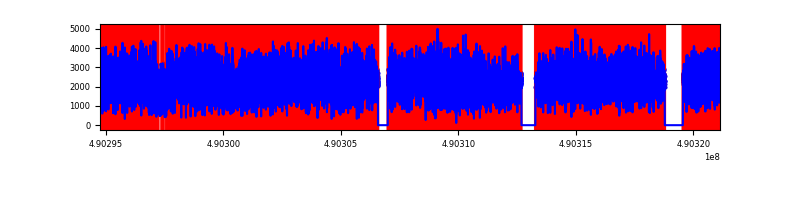 |
| B | 26379 | 24592 | 88 | 88 | 0.33% | 0.36% | 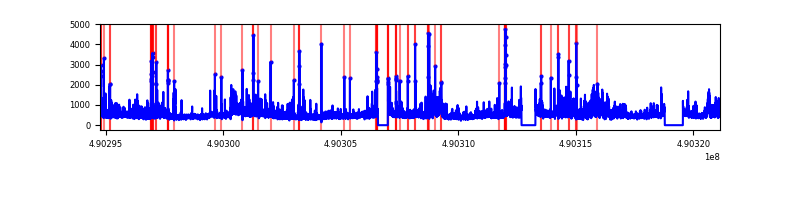 |
| C | 26379 | 24591 | 9176 | 9176 | 34.79% | 37.31% | 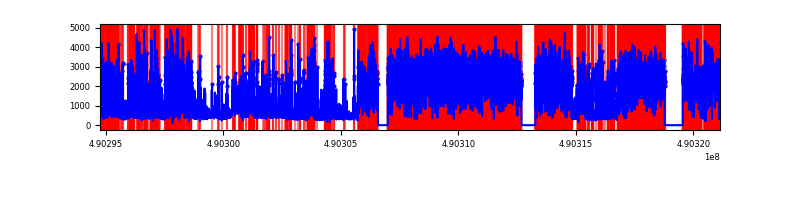 |
| D | 26379 | 24592 | 4049 | 4049 | 15.35% | 16.46% | 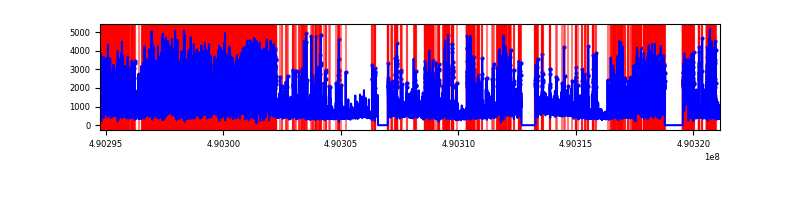 |
Top three noisy pixels from each quadrant. If the there are fewer than three noisy pixels in the level2.evt file, extra rows are filled as -1
| Pixel properties | Quadrant properties | ||||||
|---|---|---|---|---|---|---|---|
| Quadrant | DetID | PixID | Counts | Sigma | Mean | Median | Sigma |
| A | 9 | 191 | 38896187 | 103793.35 | 1495 | 1461 | 374.7 |
| A | 15 | 190 | 8350323 | 22279.53 | 1495 | 1461 | 374.7 |
| A | 7 | 206 | 869122 | 2315.42 | 1495 | 1461 | 374.7 |
| B | 10 | 254 | 1609743 | 2931.8 | 2591 | 2498 | 548.2 |
| B | 14 | 167 | 310931 | 562.62 | 2591 | 2498 | 548.2 |
| B | 4 | 81 | 243454 | 439.53 | 2591 | 2498 | 548.2 |
| C | 1 | 241 | 14312430 | 26134.96 | 1989 | 1972 | 547.6 |
| C | 9 | 38 | 7065852 | 12900.65 | 1989 | 1972 | 547.6 |
| C | 12 | 254 | 3686671 | 6729.31 | 1989 | 1972 | 547.6 |
| D | 2 | 62 | 9611432 | 14594.56 | 2270 | 2168 | 658.4 |
| D | 3 | 224 | 3040253 | 4614.25 | 2270 | 2168 | 658.4 |
| D | 8 | 176 | 2036942 | 3090.42 | 2270 | 2168 | 658.4 |
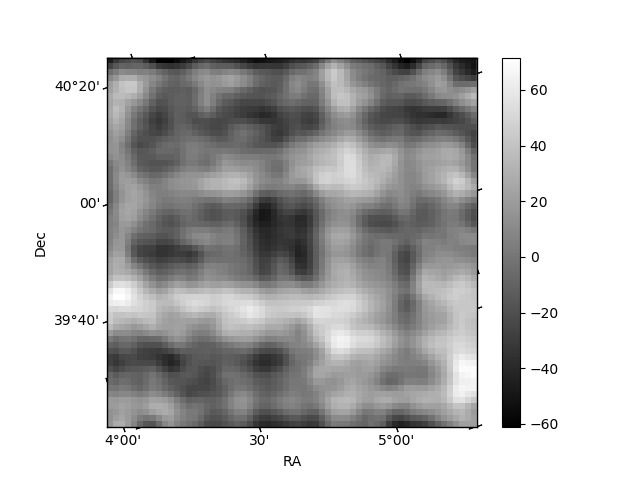
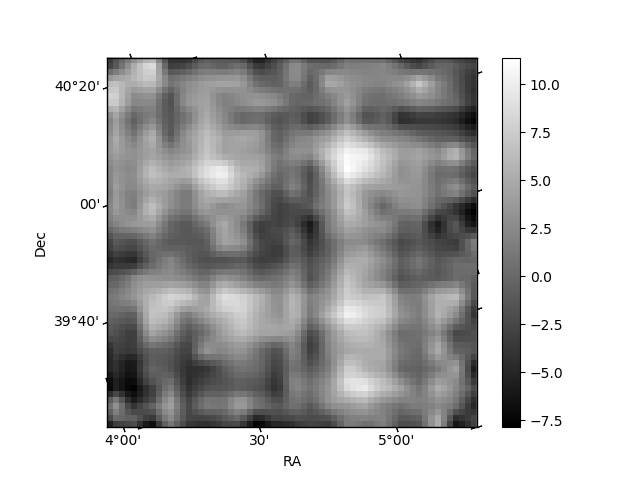
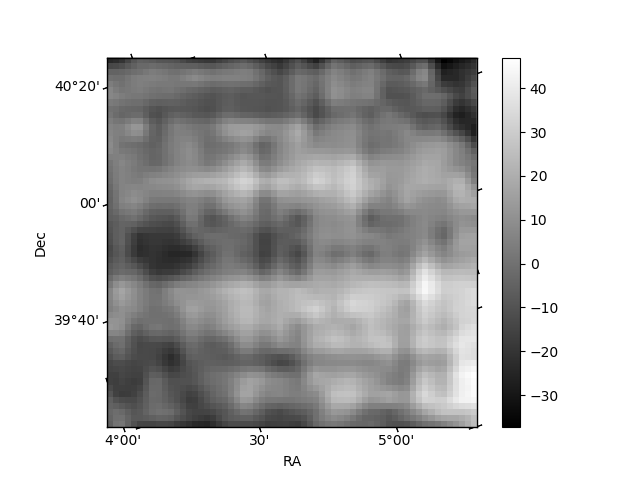
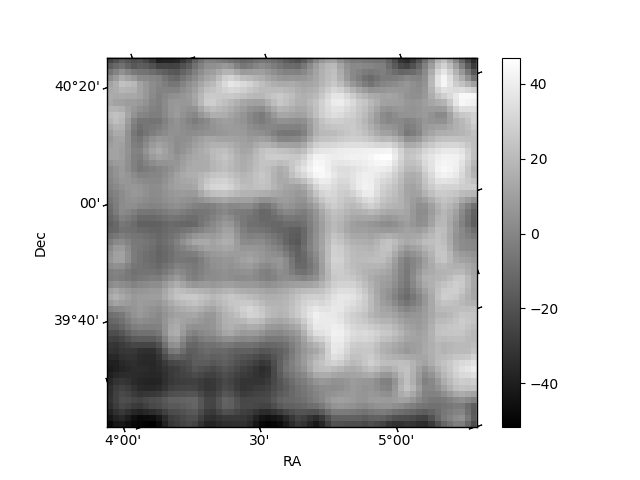
Histogram calculated using DETX and DETY for each event in the final _common_clean file
| Quadrant A | 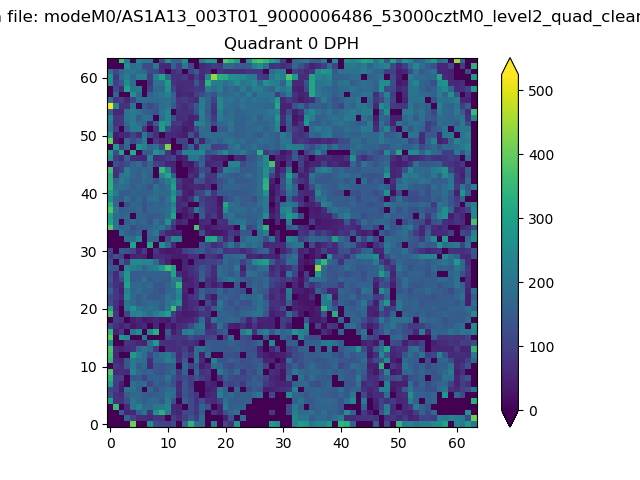 |
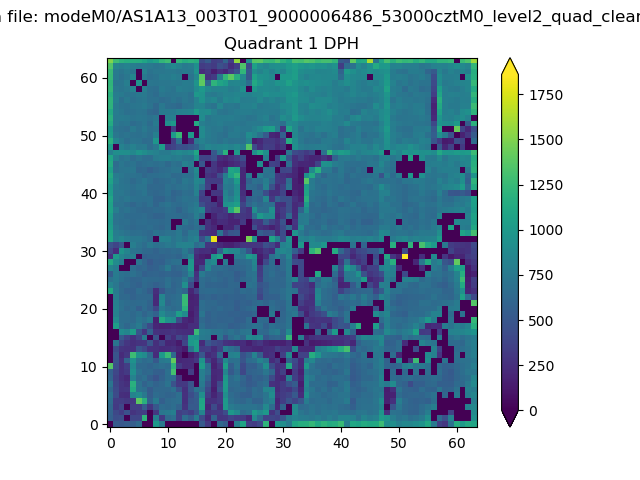 |
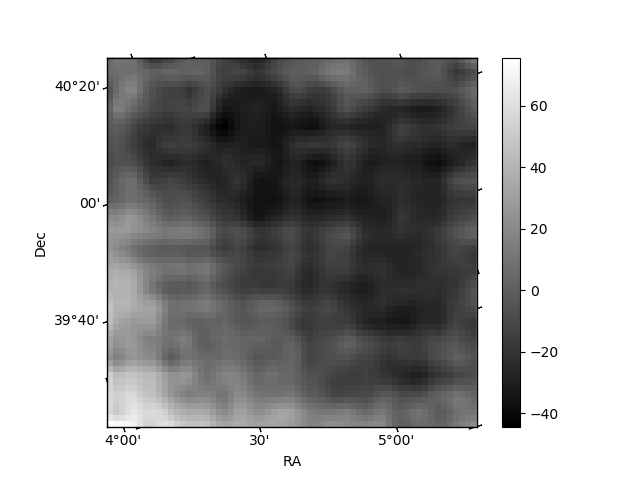
Quadrant B |
|---|---|---|---|
| Quadrant D | 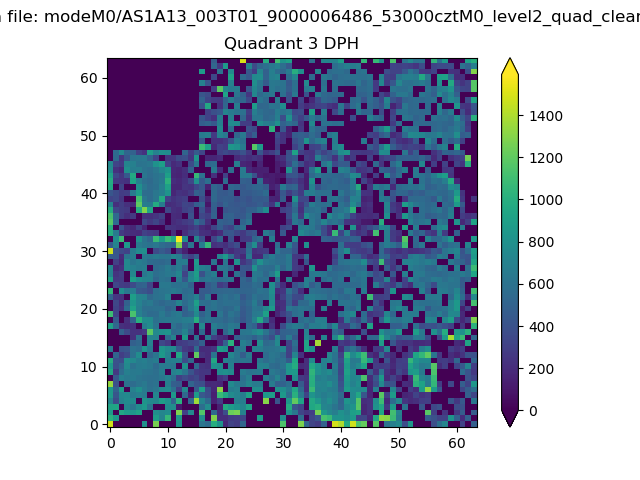 |
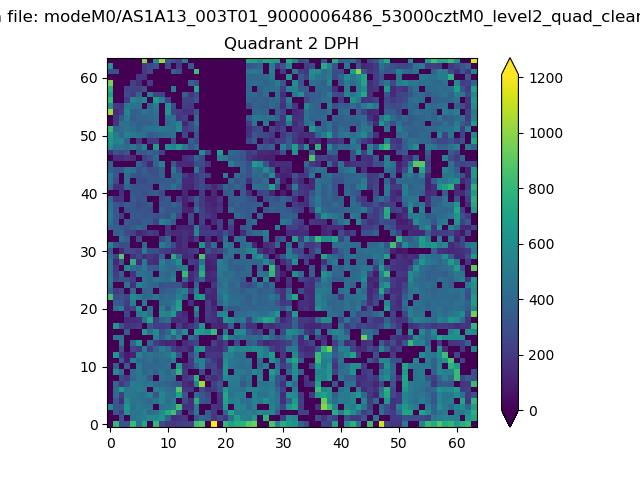 |
Quadrant C |
| Plot type | Count rate plots | Images |
|---|---|---|
| Comparison with Poisson distribution Blue bars denote a histogram of data divided into 1 sec bins. Red curve is a Poisson curve with rate = median count rate of data. |
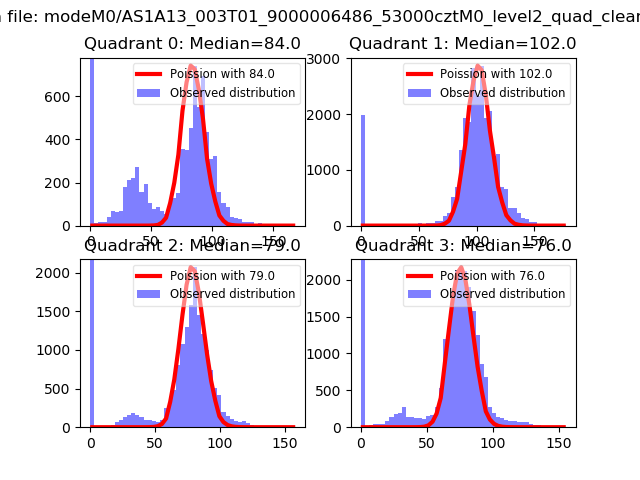 |
 |
| Quadrant-wise count rates Data is divided into 100 sec bins |
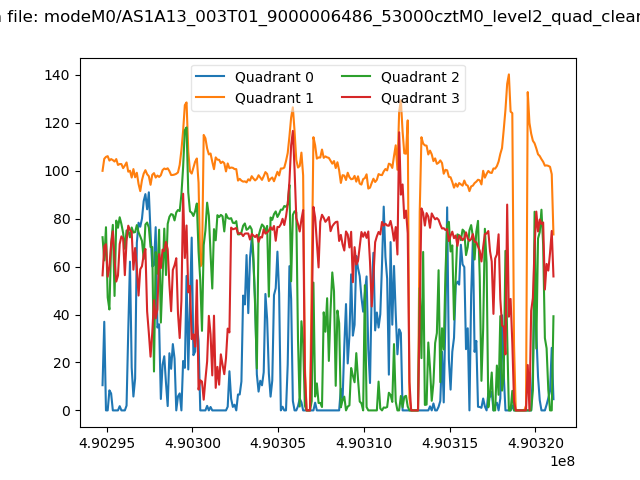 |
|
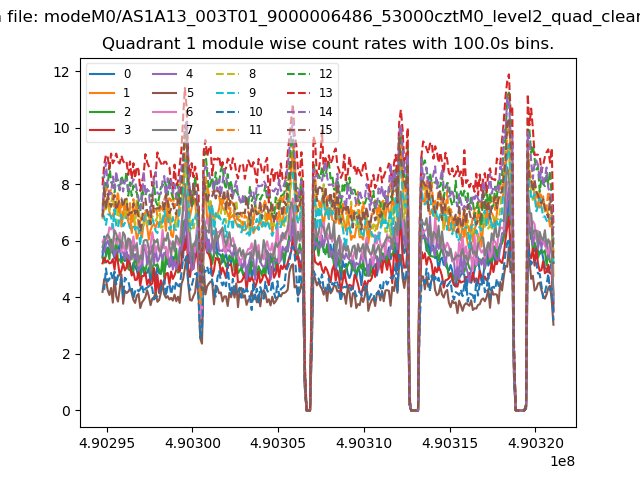
| Module-wise count rates for Quadrant A Data is divided into 100 sec bins |
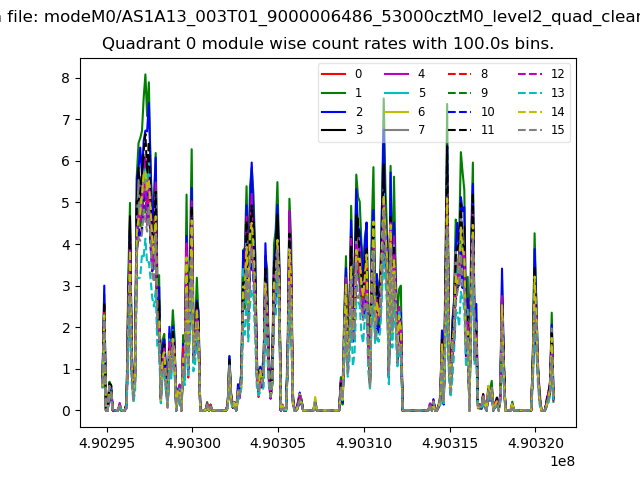 |
 |
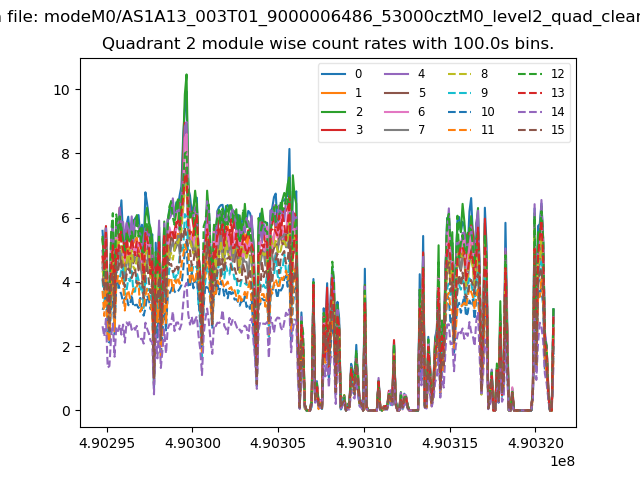
| Module-wise count rates for Quadrant B Data is divided into 100 sec bins |
 |
 |
| Module-wise count rates for Quadrant C Data is divided into 100 sec bins |
 |
 |
| Module-wise count rates for Quadrant D Data is divided into 100 sec bins |
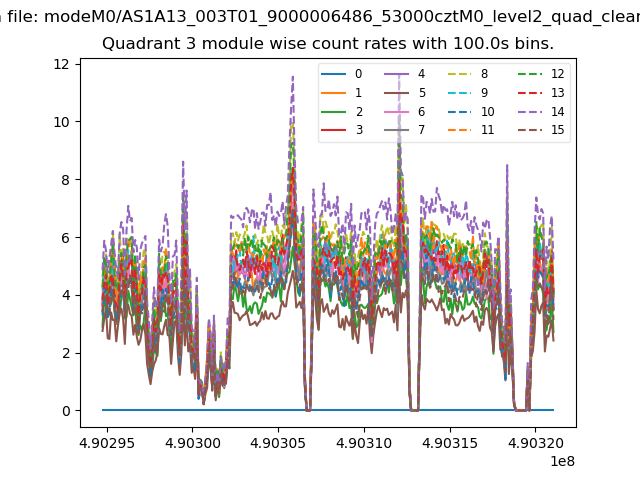 |
 |
| Parameter | Plot |
|---|---|
| CZT HV Monitor | 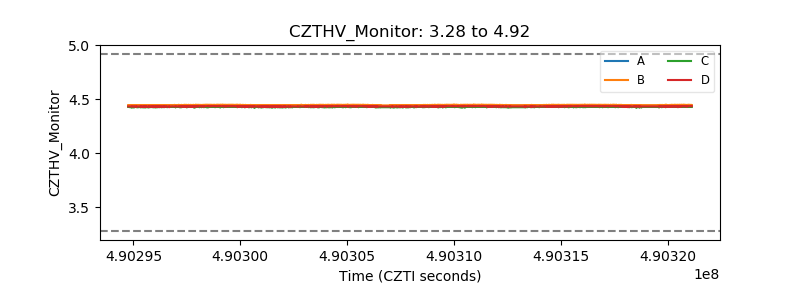 |
| D_VDD | 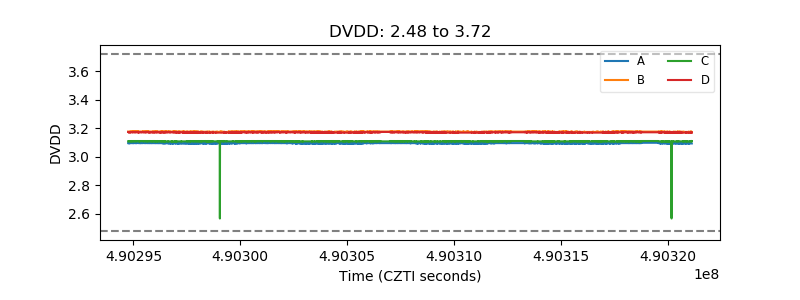 |
| Temperature 1 | 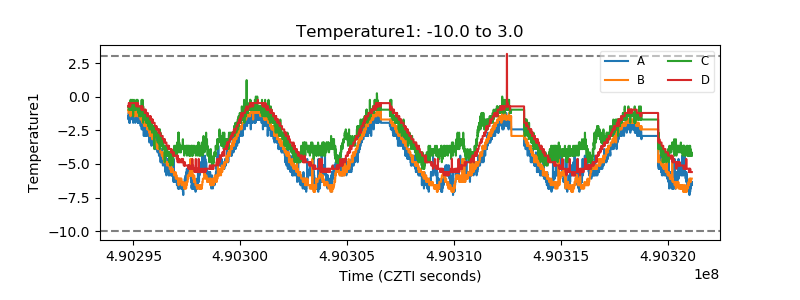 |
| Veto HV Monitor | 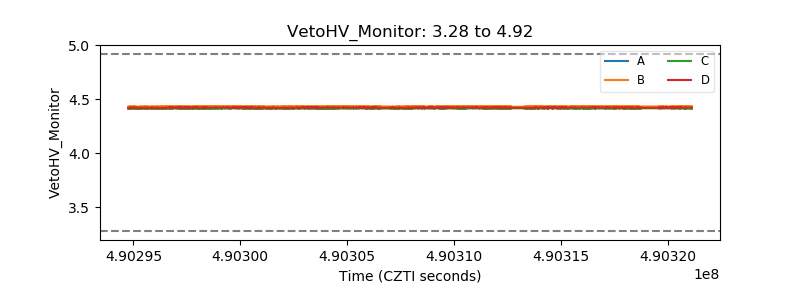 |
| Veto LLD | 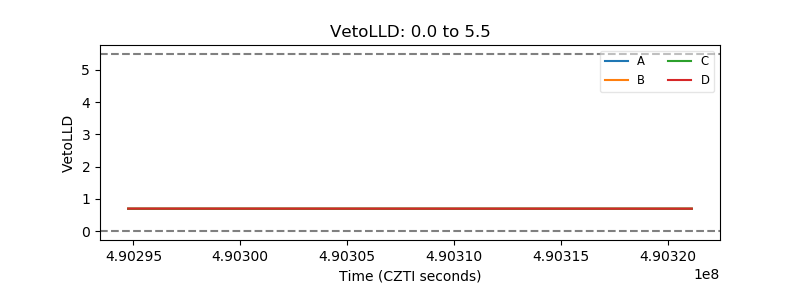 |
| Alpha Counter | 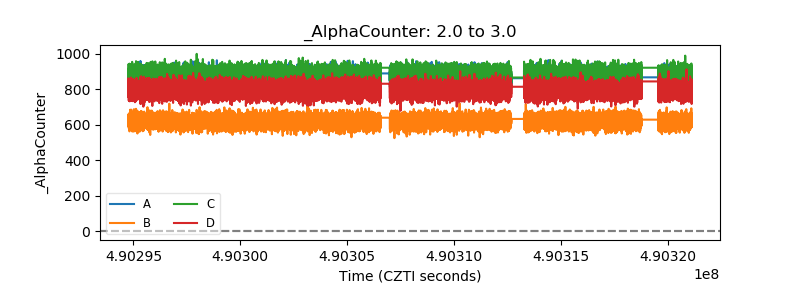 |
| _CPM_Rate | 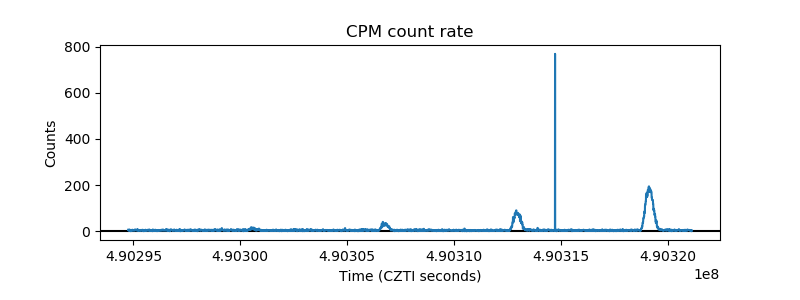 |
| CZT Counter | 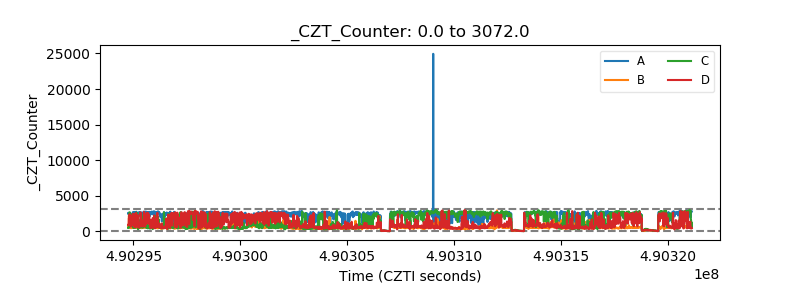 |
| +2.5 Volts monitor |  |
| +5 Volts monitor |  |
| _ROLL_ROT | 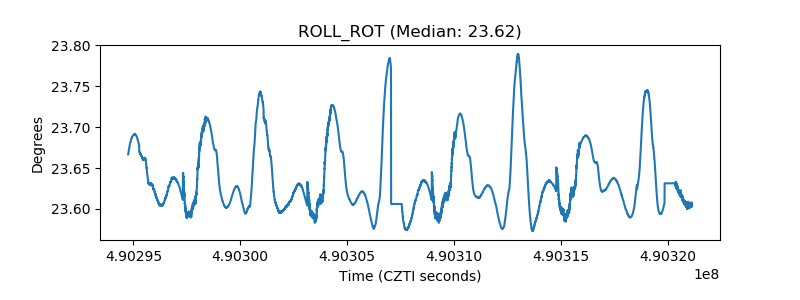 |
| _Roll_DEC | 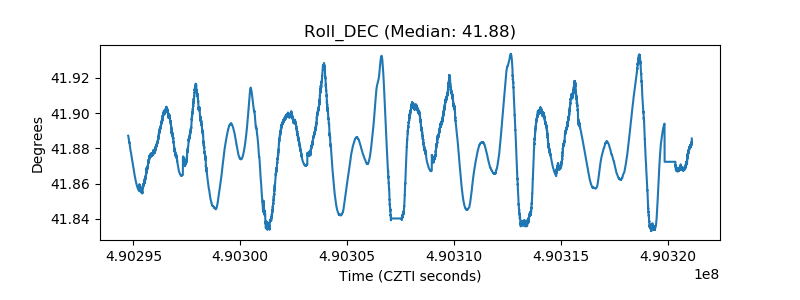 |
| _Roll_RA | 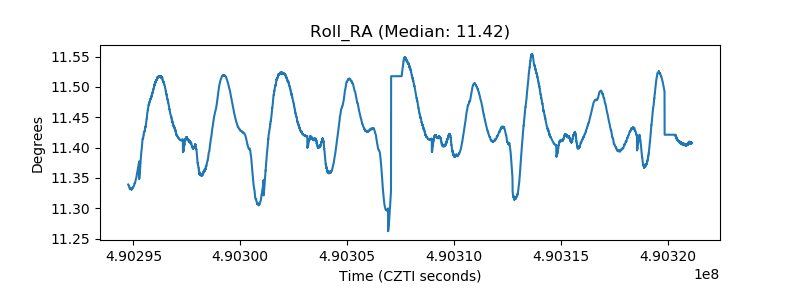 |
| Veto Counter | 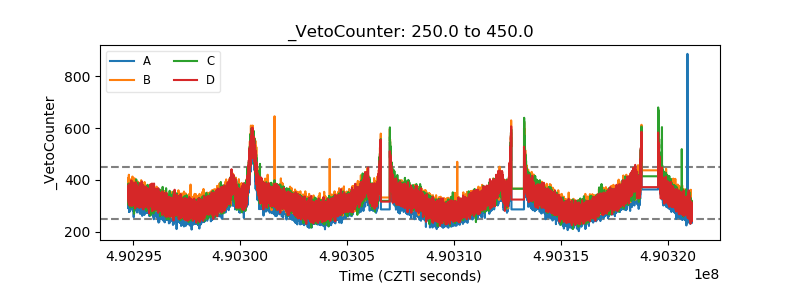 |