| Param | Original file | Final file |
|---|---|---|
| Filename | modeM0/AS1A13_003T01_9000006486_53001cztM0_level2.fits | modeM0/AS1A13_003T01_9000006486_53001cztM0_level2_quad_clean.evt |
| Size (bytes) | 897,399,360 | 72,486,720 |
| Size | 855.8 MB | 69.1 MB |
| Events in quadrant A | 15,232,520 | 105,685 |
| Events in quadrant B | 4,050,050 | 667,924 |
| Events in quadrant C | 7,261,191 | 471,797 |
| Events in quadrant D | 6,176,645 | 499,506 |
| Mode M9 | |||
|---|---|---|---|
| Quadrant | BADHDUFLAG | Total packets | Discarded packets |
| A | 0 | 9 | 0 |
| B | 0 | 9 | 0 |
| C | 0 | 9 | 0 |
| D | 0 | 9 | 0 |
| Mode M0 | |||
|---|---|---|---|
| Quadrant | BADHDUFLAG | Total packets | Discarded packets |
| A | 0 | 49619 | 7 |
| B | 0 | 16435 | 2 |
| C | 0 | 26185 | 2 |
| D | 0 | 22918 | 2 |
| Mode SS | |||
|---|---|---|---|
| Quadrant | BADHDUFLAG | Total packets | Discarded packets |
| A | 0 | 132 | 0 |
| B | 0 | 132 | 0 |
| C | 0 | 132 | 0 |
| D | 0 | 132 | 0 |
| Quadrant | Total seconds | Saturated seconds | Saturation percentage |
|---|---|---|---|
| A | 6439 | 5525 | 85.805249% |
| B | 6439 | 113 | 1.754931% |
| C | 6440 | 1459 | 22.655280% |
| D | 6440 | 844 | 13.105590% |
Noise dominated data is calculated using 1-second bins in cleaned event files. If a bin has >2000 counts, and if more than 50% of those come from <1% of pixels, then it is considered to be noise-dominated and hence unusable.
| Quadrant | # 1 sec bins | Bins with >0 counts | Bins with >2000 counts | High rate bins dominated by noise | Noise dominated (total time) | Noise dominated (detector-on time) | Marked lightcurve |
|---|---|---|---|---|---|---|---|
| A | 7373 | 6438 | 4887 | 4887 | 66.28% | 75.91% | 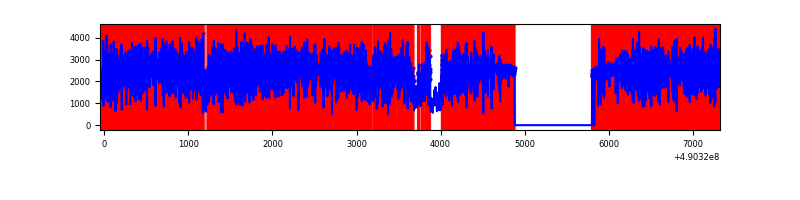 |
| B | 7374 | 6441 | 67 | 67 | 0.91% | 1.04% | 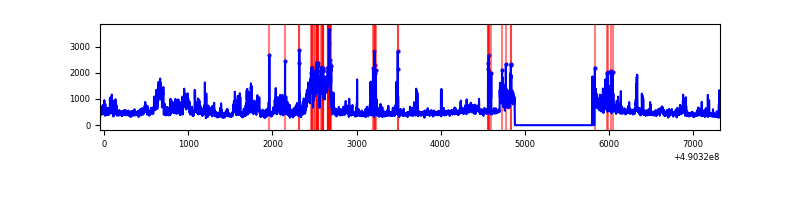 |
| C | 7375 | 6442 | 1299 | 1299 | 17.61% | 20.16% | 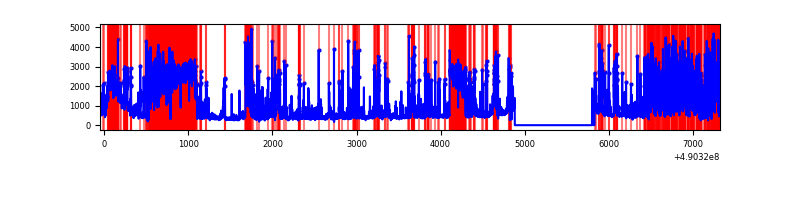 |
| D | 7375 | 6442 | 689 | 689 | 9.34% | 10.70% | 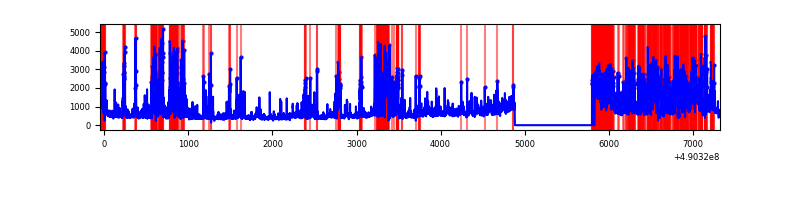 |
Top three noisy pixels from each quadrant. If the there are fewer than three noisy pixels in the level2.evt file, extra rows are filled as -1
| Pixel properties | Quadrant properties | ||||||
|---|---|---|---|---|---|---|---|
| Quadrant | DetID | PixID | Counts | Sigma | Mean | Median | Sigma |
| A | 9 | 191 | 12110771 | 126619.15 | 374 | 365 | 95.6 |
| A | 15 | 190 | 1294983 | 13535.75 | 374 | 365 | 95.6 |
| A | 0 | 8 | 147053 | 1533.68 | 374 | 365 | 95.6 |
| B | 10 | 254 | 932389 | 6490.56 | 665 | 642 | 143.6 |
| B | 10 | 247 | 118517 | 821.12 | 665 | 642 | 143.6 |
| B | 4 | 81 | 94034 | 650.57 | 665 | 642 | 143.6 |
| C | 1 | 241 | 2457673 | 15070.55 | 590 | 586 | 163.0 |
| C | 15 | 224 | 1395155 | 8553.59 | 590 | 586 | 163.0 |
| C | 7 | 80 | 511199 | 3131.85 | 590 | 586 | 163.0 |
| D | 2 | 62 | 1464737 | 8312.21 | 612 | 586 | 176.1 |
| D | 8 | 176 | 974992 | 5531.85 | 612 | 586 | 176.1 |
| D | 15 | 78 | 325631 | 1845.33 | 612 | 586 | 176.1 |
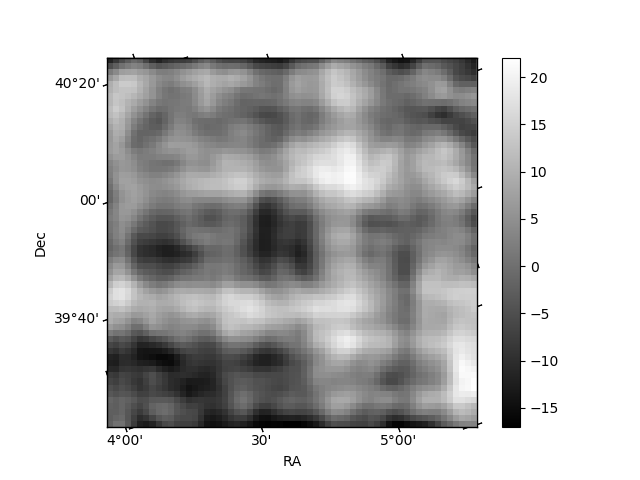
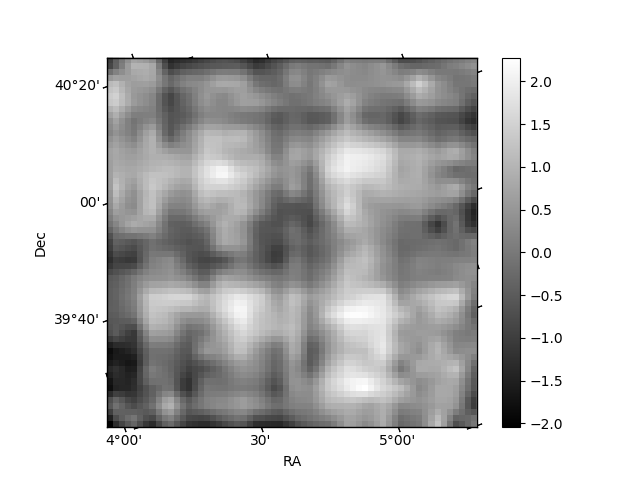
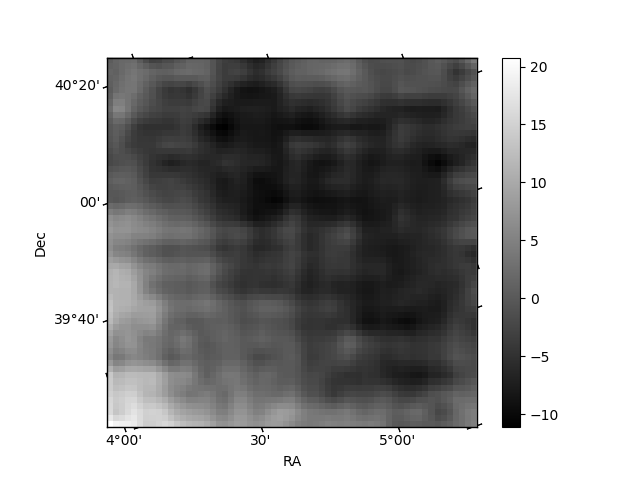
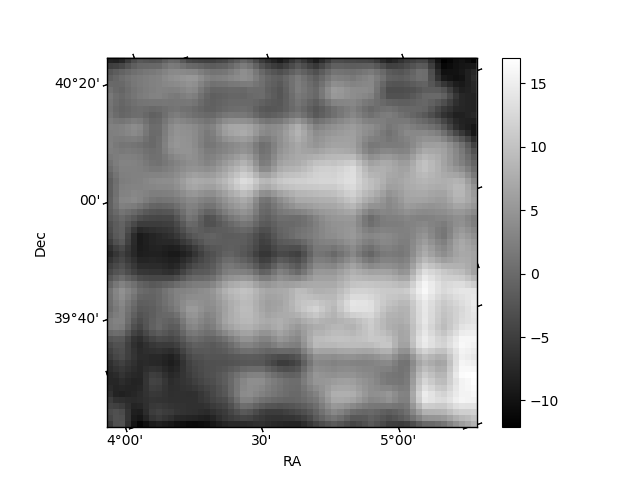
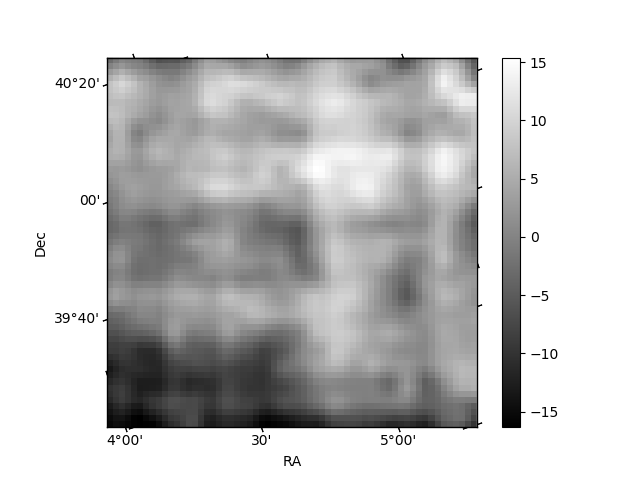
Histogram calculated using DETX and DETY for each event in the final _common_clean file
| Quadrant A | 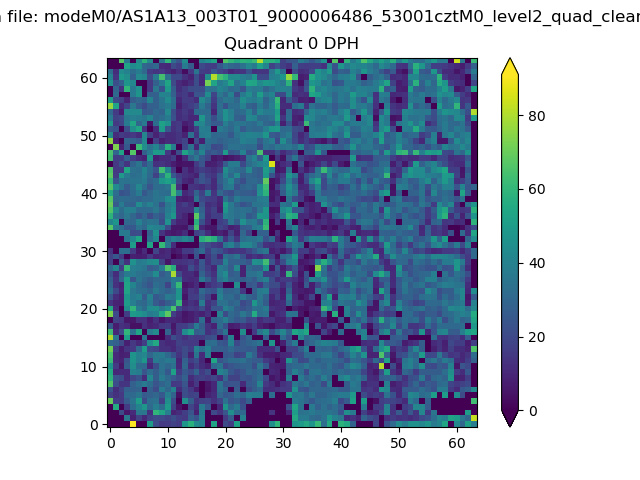 |
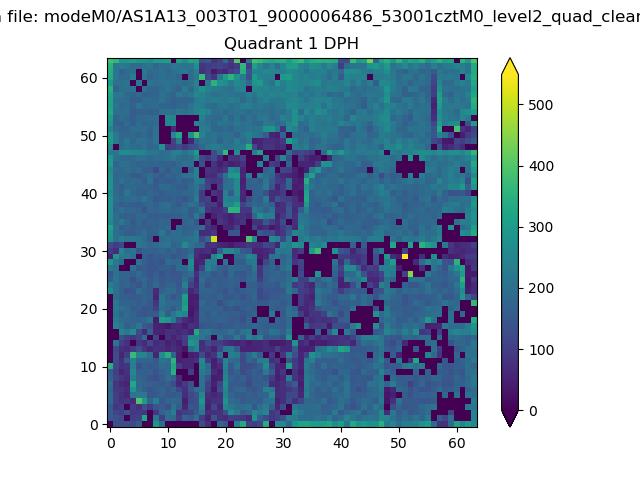 |
Quadrant B |
|---|---|---|---|
| Quadrant D | 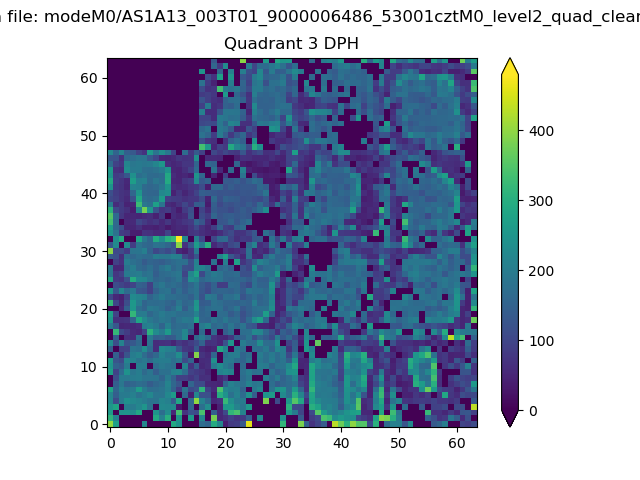 |
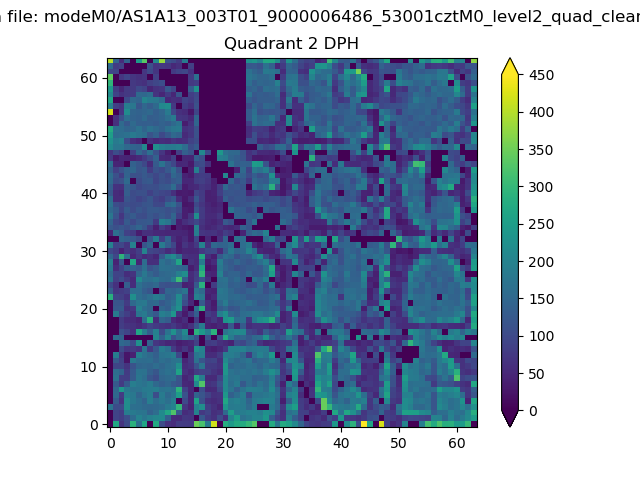 |
Quadrant C |
| Plot type | Count rate plots | Images |
|---|---|---|
| Comparison with Poisson distribution Blue bars denote a histogram of data divided into 1 sec bins. Red curve is a Poisson curve with rate = median count rate of data. |
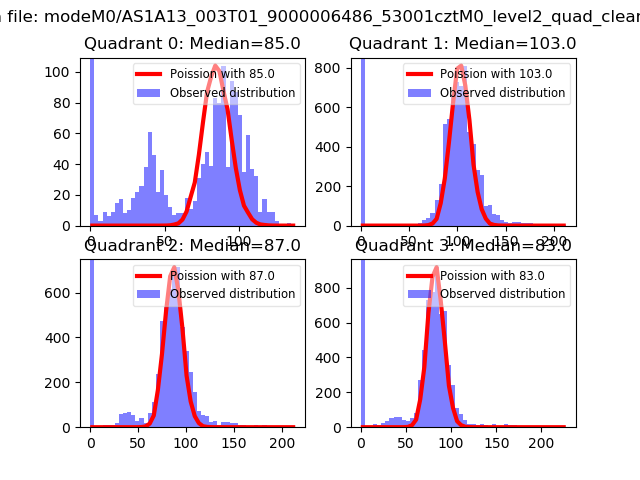 |
 |
| Quadrant-wise count rates Data is divided into 100 sec bins |
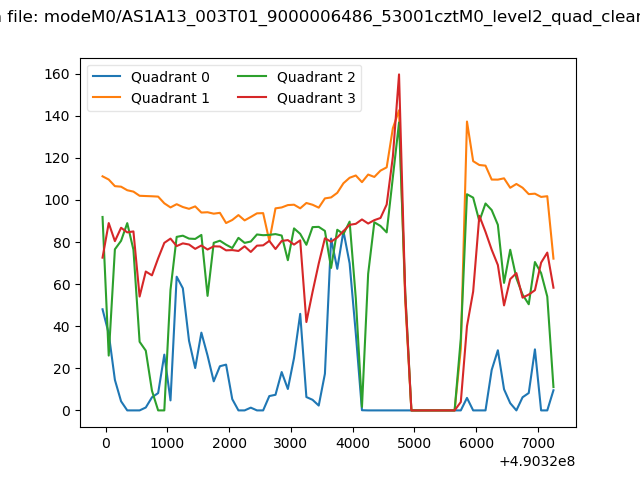 |
|
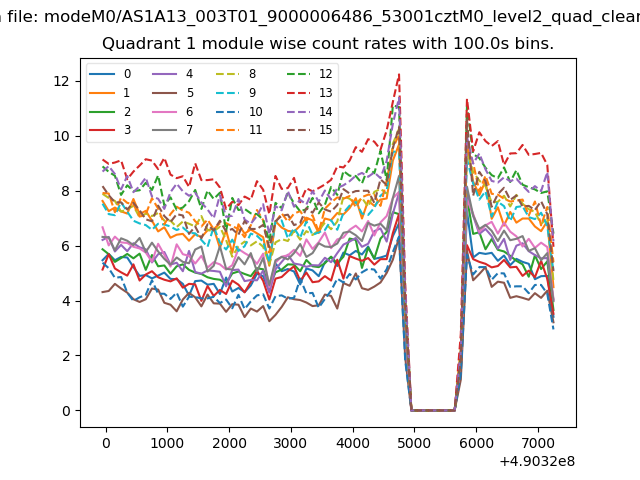
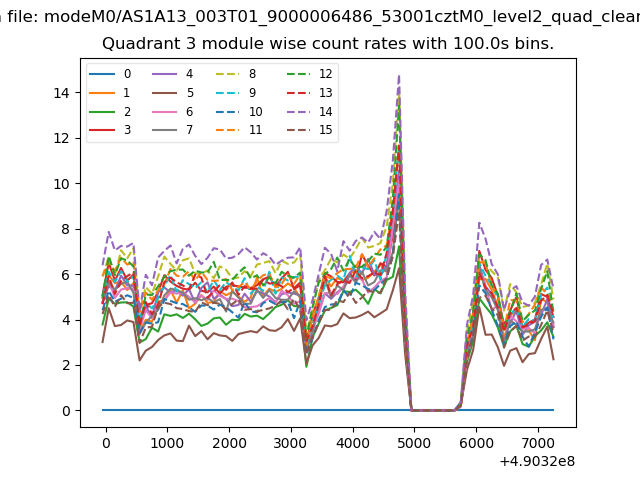
| Module-wise count rates for Quadrant A Data is divided into 100 sec bins |
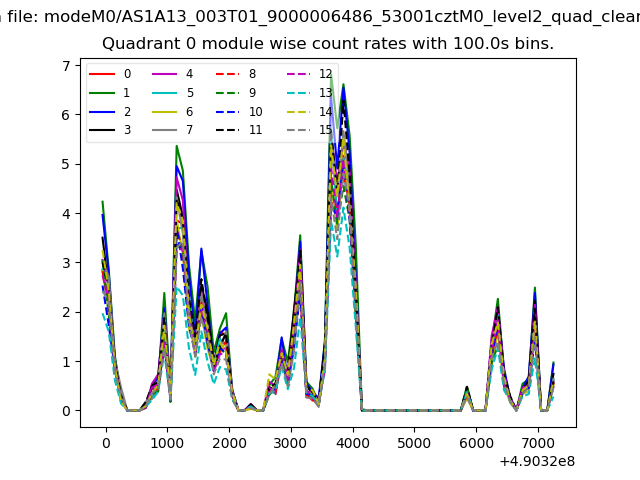 |
 |
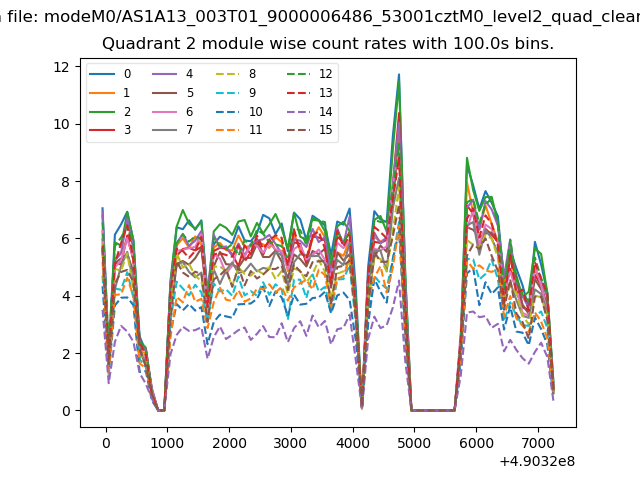
| Module-wise count rates for Quadrant B Data is divided into 100 sec bins |
 |
 |
| Module-wise count rates for Quadrant C Data is divided into 100 sec bins |
 |
 |
| Module-wise count rates for Quadrant D Data is divided into 100 sec bins |
 |
 |
| Parameter | Plot |
|---|---|
| CZT HV Monitor | 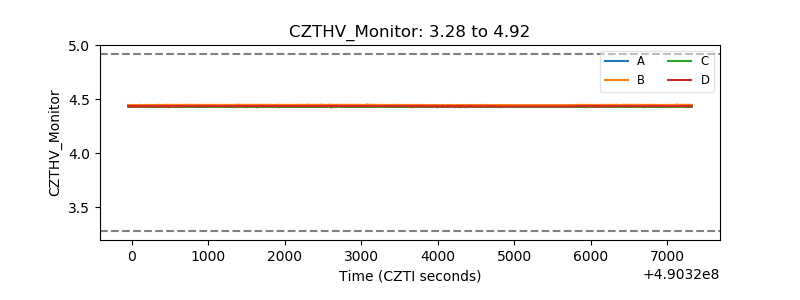 |
| D_VDD | 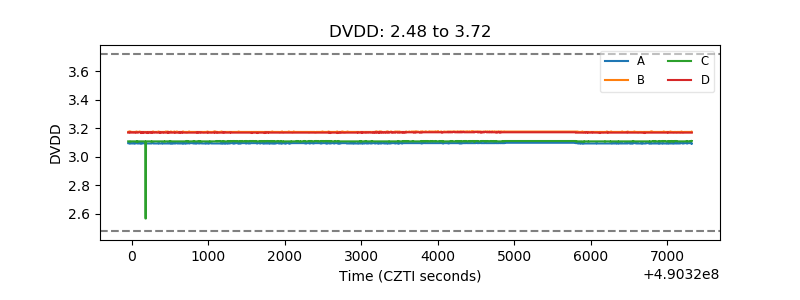 |
| Temperature 1 | 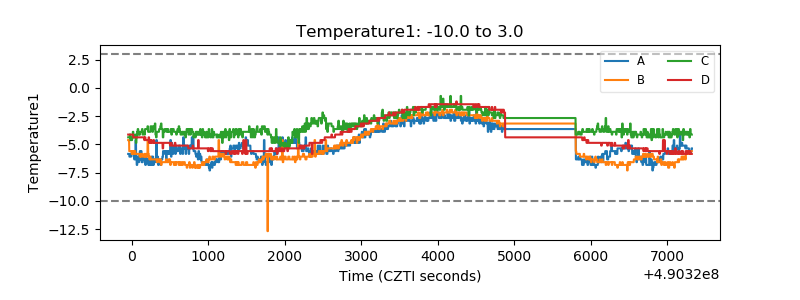 |
| Veto HV Monitor | 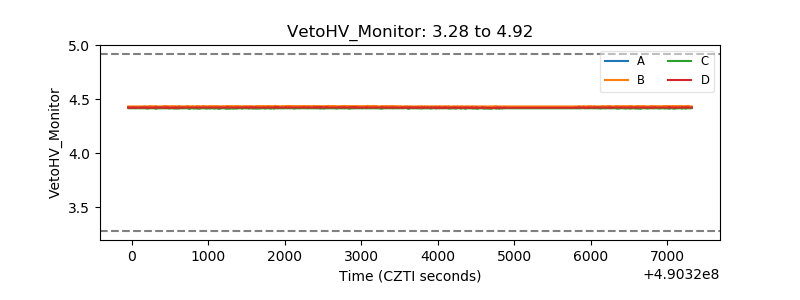 |
| Veto LLD | 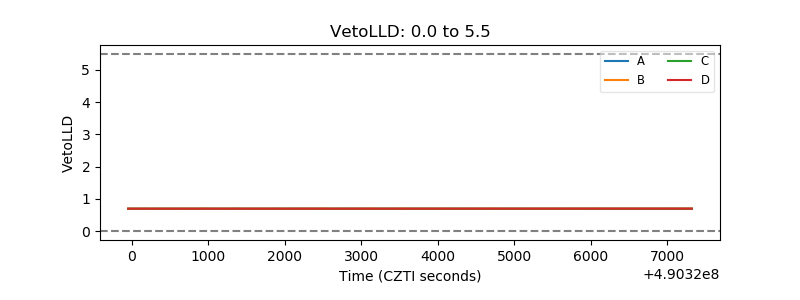 |
| Alpha Counter | 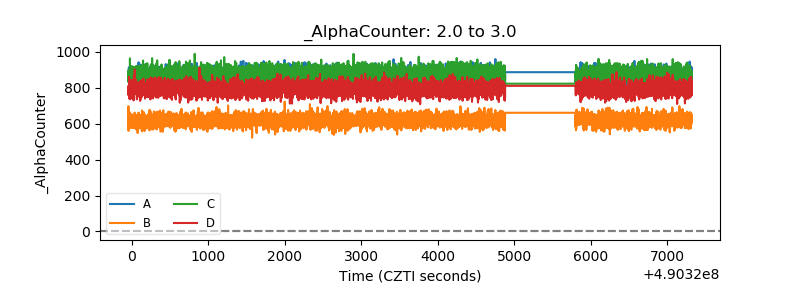 |
| _CPM_Rate | 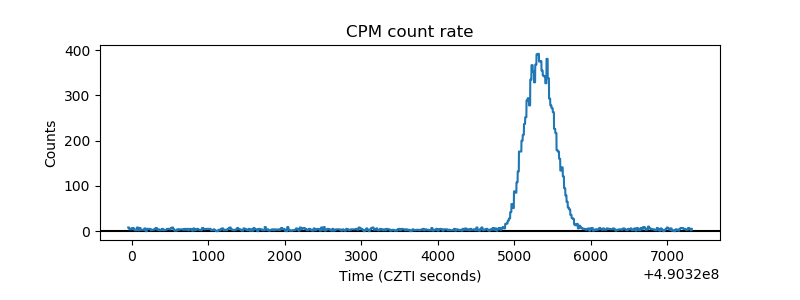 |
| CZT Counter | 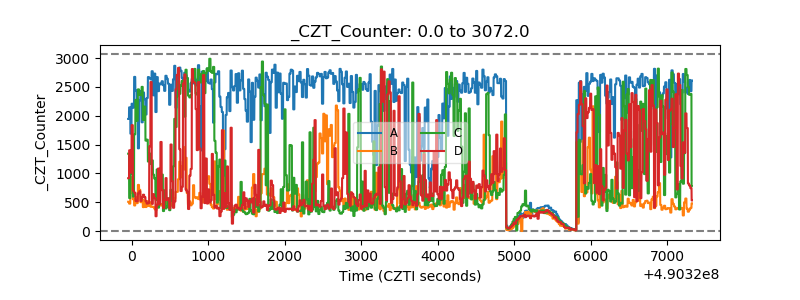 |
| +2.5 Volts monitor | 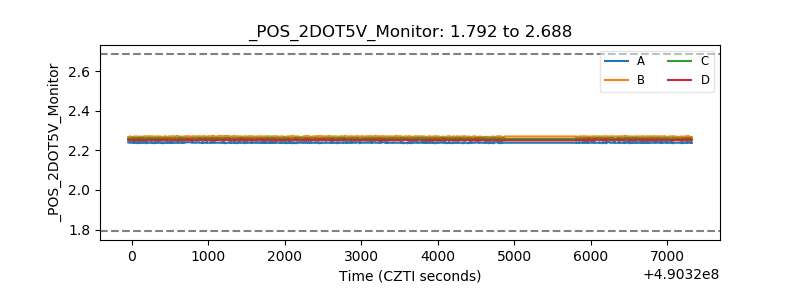 |
| +5 Volts monitor | 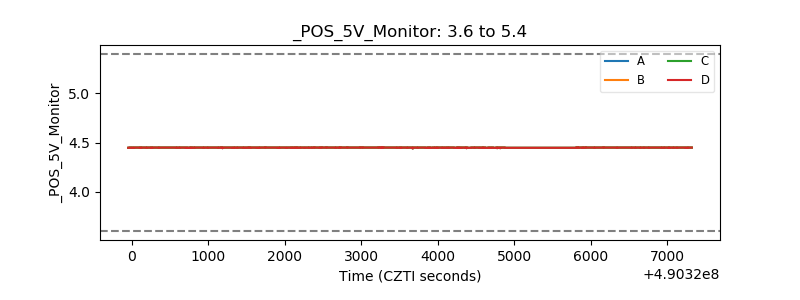 |
| _ROLL_ROT | 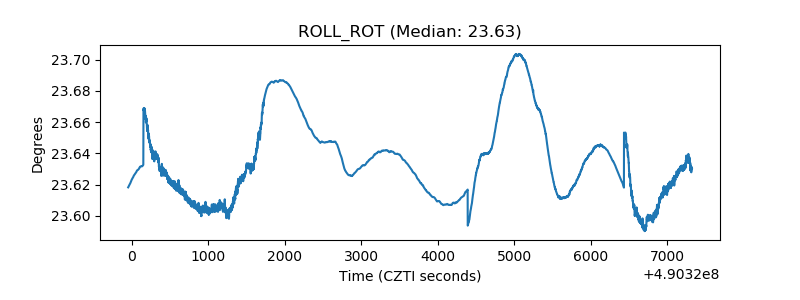 |
| _Roll_DEC | 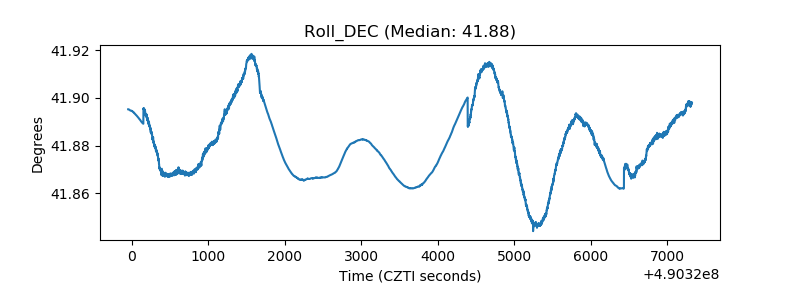 |
| _Roll_RA | 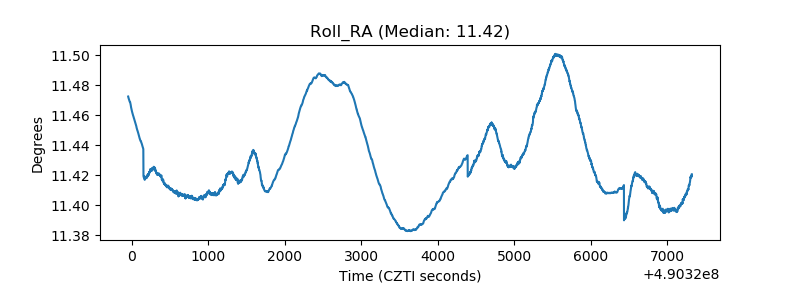 |
| Veto Counter | 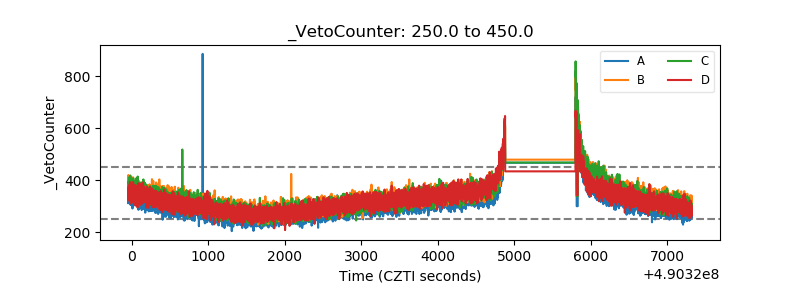 |