| Param | Original file | Final file |
|---|---|---|
| Filename | modeM0/AS1A13_003T01_9000006486_53003cztM0_level2.fits | modeM0/AS1A13_003T01_9000006486_53003cztM0_level2_quad_clean.evt |
| Size (bytes) | 628,565,760 | 39,605,760 |
| Size | 599.4 MB | 37.8 MB |
| Events in quadrant A | 9,119,994 | 51,474 |
| Events in quadrant B | 2,691,060 | 382,603 |
| Events in quadrant C | 5,781,349 | 243,394 |
| Events in quadrant D | 5,382,176 | 254,103 |
| Mode M9 | |||
|---|---|---|---|
| Quadrant | BADHDUFLAG | Total packets | Discarded packets |
| A | 0 | 1 | 0 |
| B | 0 | 1 | 0 |
| C | 0 | 2 | 0 |
| D | 0 | 2 | 0 |
| Mode M0 | |||
|---|---|---|---|
| Quadrant | BADHDUFLAG | Total packets | Discarded packets |
| A | 0 | 29668 | 2 |
| B | 0 | 10608 | 2 |
| C | 0 | 19776 | 2 |
| D | 0 | 18676 | 2 |
| Mode SS | |||
|---|---|---|---|
| Quadrant | BADHDUFLAG | Total packets | Discarded packets |
| A | 0 | 76 | 0 |
| B | 0 | 76 | 0 |
| C | 0 | 76 | 0 |
| D | 0 | 76 | 0 |
| Quadrant | Total seconds | Saturated seconds | Saturation percentage |
|---|---|---|---|
| A | 3783 | 3327 | 87.946075% |
| B | 3783 | 54 | 1.427439% |
| C | 3783 | 1327 | 35.077980% |
| D | 3783 | 964 | 25.482421% |
Noise dominated data is calculated using 1-second bins in cleaned event files. If a bin has >2000 counts, and if more than 50% of those come from <1% of pixels, then it is considered to be noise-dominated and hence unusable.
| Quadrant | # 1 sec bins | Bins with >0 counts | Bins with >2000 counts | High rate bins dominated by noise | Noise dominated (total time) | Noise dominated (detector-on time) | Marked lightcurve |
|---|---|---|---|---|---|---|---|
| A | 3797 | 3782 | 2963 | 2963 | 78.04% | 78.34% | 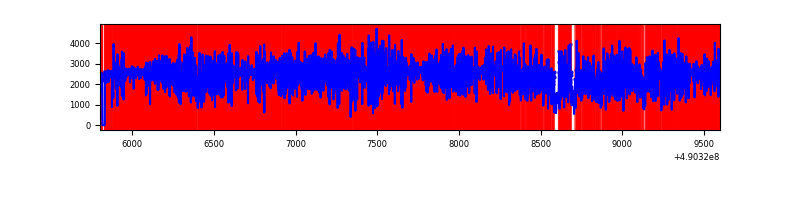 |
| B | 3798 | 3784 | 35 | 35 | 0.92% | 0.92% | 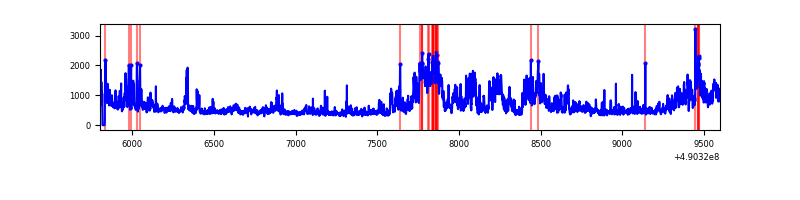 |
| C | 3798 | 3784 | 1098 | 1098 | 28.91% | 29.02% | 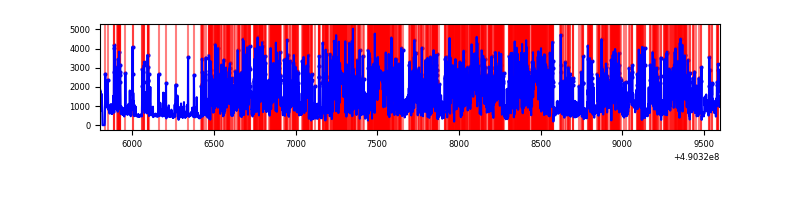 |
| D | 3798 | 3784 | 830 | 830 | 21.85% | 21.93% | 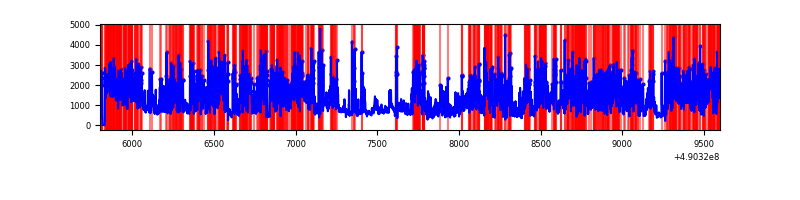 |
Top three noisy pixels from each quadrant. If the there are fewer than three noisy pixels in the level2.evt file, extra rows are filled as -1
| Pixel properties | Quadrant properties | ||||||
|---|---|---|---|---|---|---|---|
| Quadrant | DetID | PixID | Counts | Sigma | Mean | Median | Sigma |
| A | 9 | 191 | 7299913 | 138000.51 | 205 | 201 | 52.9 |
| A | 15 | 190 | 831493 | 15715.51 | 205 | 201 | 52.9 |
| A | 7 | 206 | 89311 | 1684.62 | 205 | 201 | 52.9 |
| B | 10 | 254 | 971673 | 11842.28 | 374 | 361 | 82.0 |
| B | 4 | 81 | 56303 | 682.05 | 374 | 361 | 82.0 |
| B | 5 | 172 | 53643 | 649.62 | 374 | 361 | 82.0 |
| C | 15 | 224 | 2460713 | 28457.37 | 308 | 306 | 86.5 |
| C | 12 | 254 | 1040877 | 12035.37 | 308 | 306 | 86.5 |
| C | 7 | 80 | 721088 | 8336.65 | 308 | 306 | 86.5 |
| D | 2 | 62 | 3097230 | 32179.94 | 330 | 314 | 96.2 |
| D | 15 | 78 | 335207 | 3479.86 | 330 | 314 | 96.2 |
| D | 8 | 176 | 205003 | 2126.92 | 330 | 314 | 96.2 |
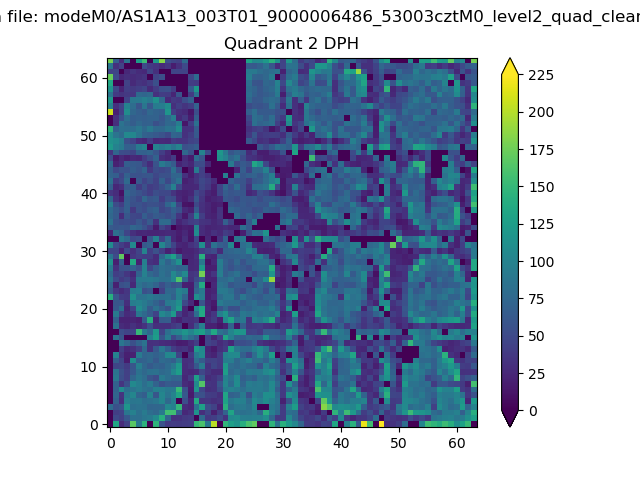
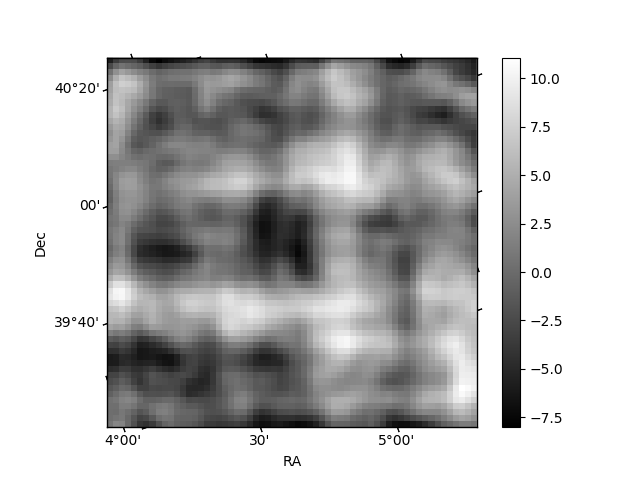
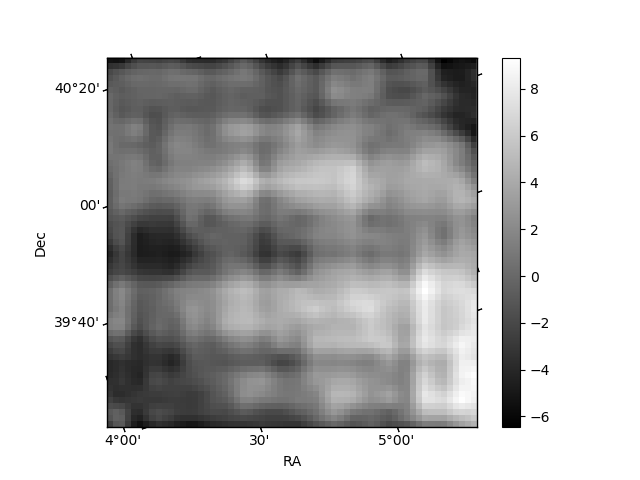
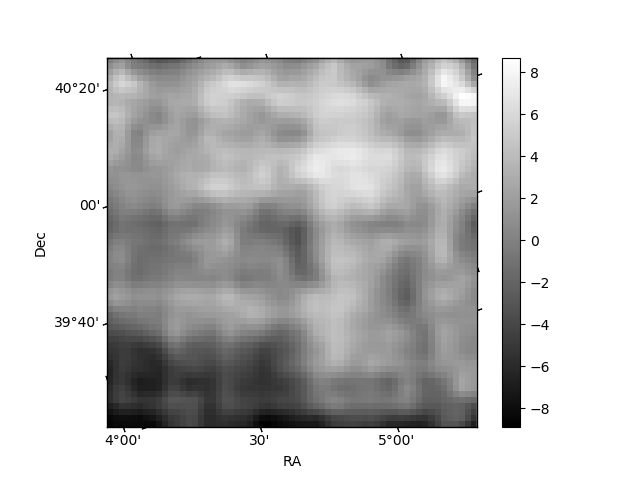
Histogram calculated using DETX and DETY for each event in the final _common_clean file
| Quadrant A | 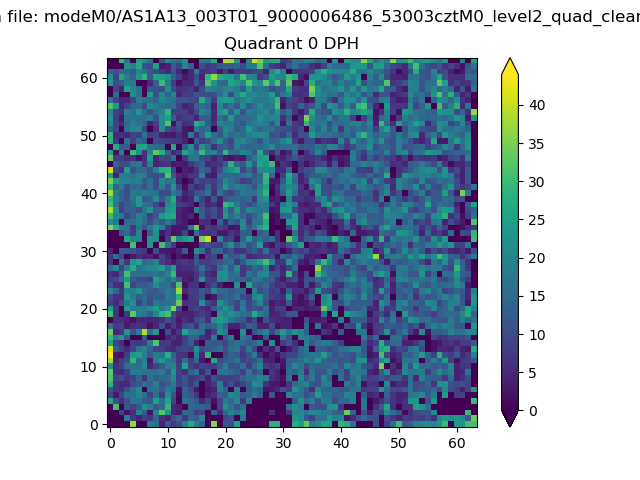 |
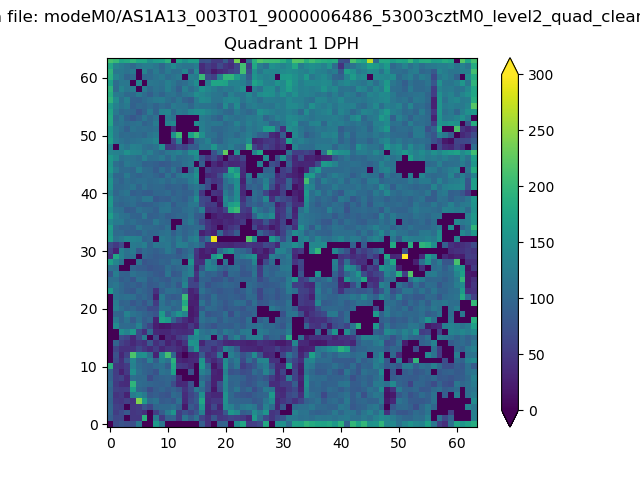 |
Quadrant B |
|---|---|---|---|
| Quadrant D | 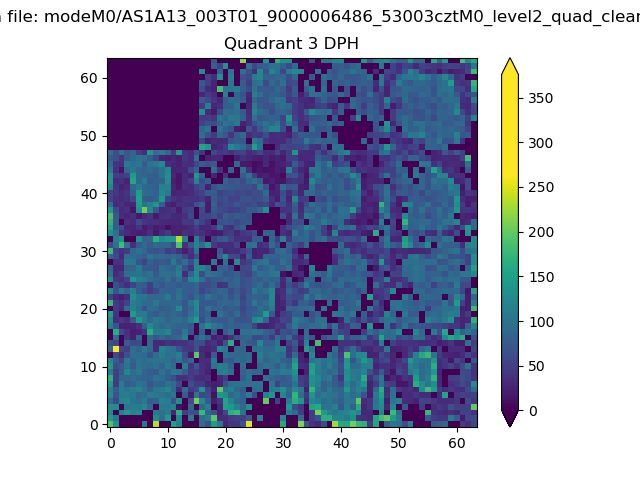 |
 |
Quadrant C |
| Plot type | Count rate plots | Images |
|---|---|---|
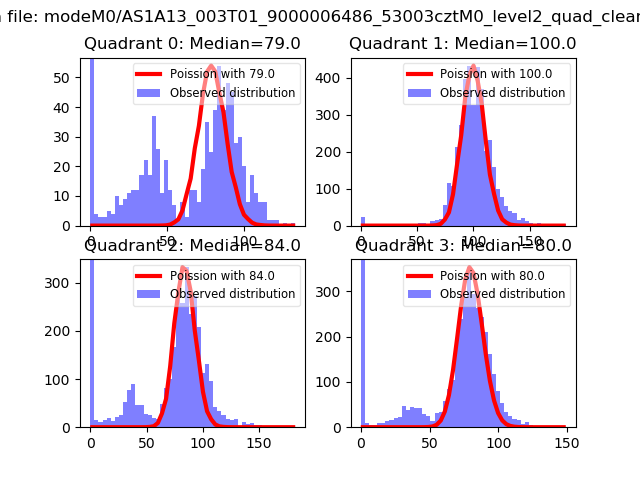
| Comparison with Poisson distribution Blue bars denote a histogram of data divided into 1 sec bins. Red curve is a Poisson curve with rate = median count rate of data. |
 |
 |
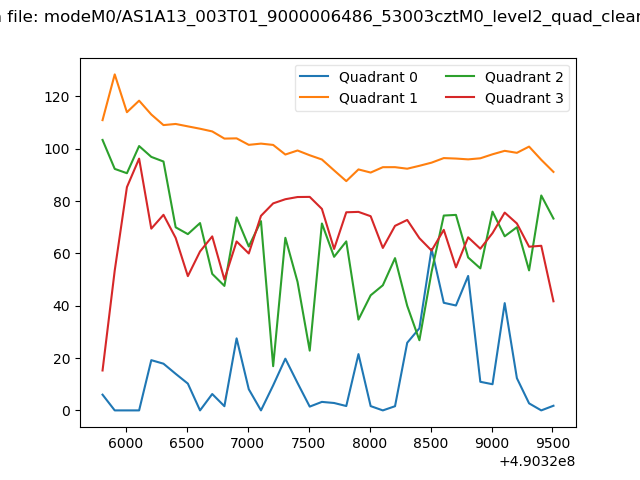
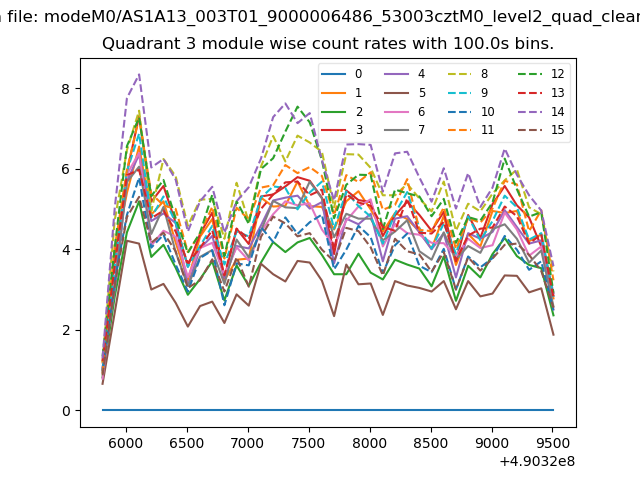
| Quadrant-wise count rates Data is divided into 100 sec bins |
 |
|
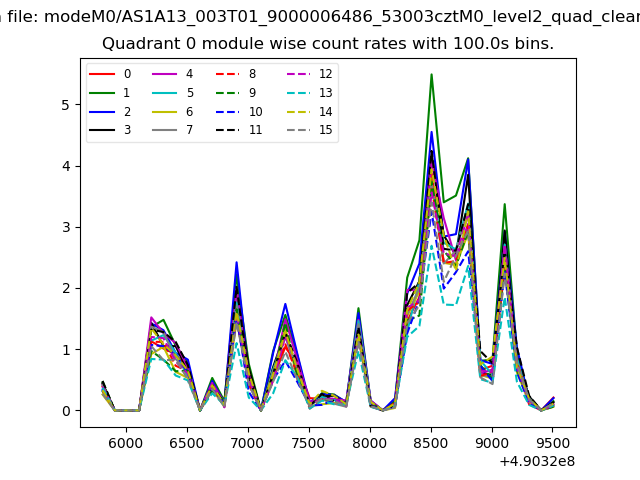
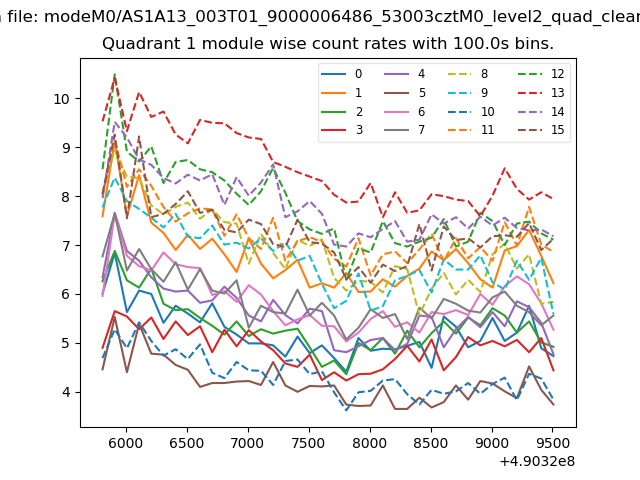
| Module-wise count rates for Quadrant A Data is divided into 100 sec bins |
 |
 |
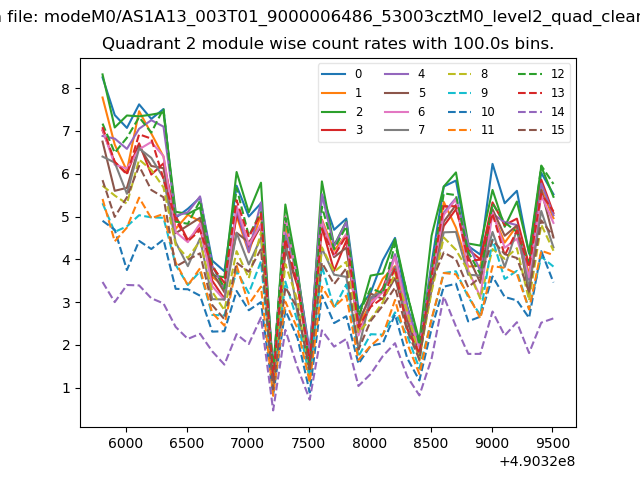
| Module-wise count rates for Quadrant B Data is divided into 100 sec bins |
 |
 |
| Module-wise count rates for Quadrant C Data is divided into 100 sec bins |
 |
 |
| Module-wise count rates for Quadrant D Data is divided into 100 sec bins |
 |
 |
| Parameter | Plot |
|---|---|
| CZT HV Monitor | 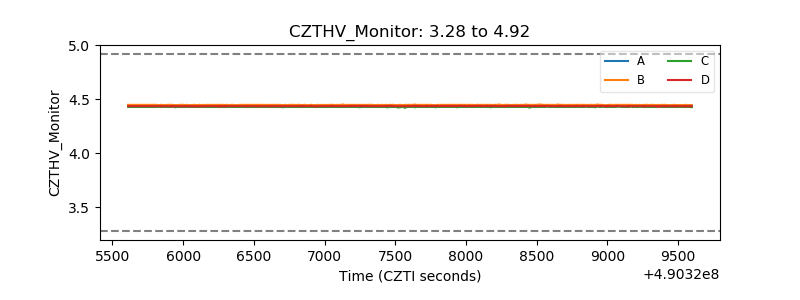 |
| D_VDD | 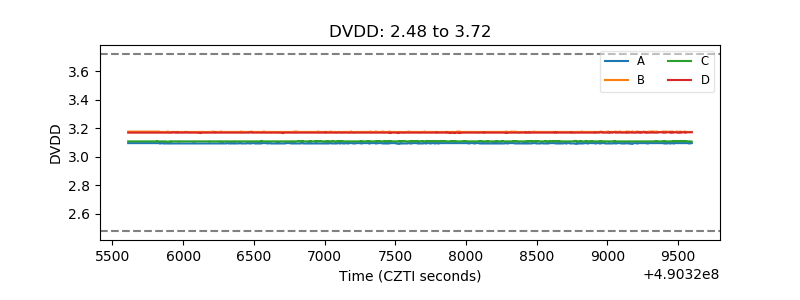 |
| Temperature 1 | 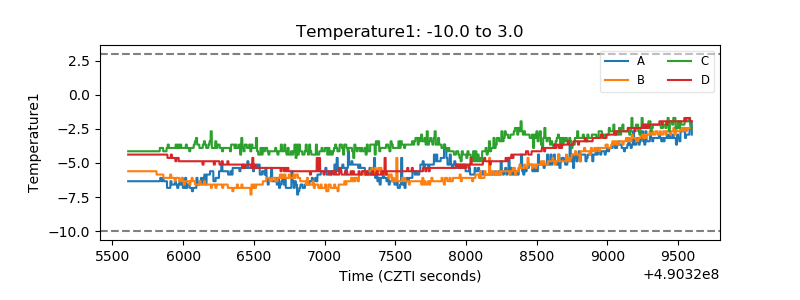 |
| Veto HV Monitor | 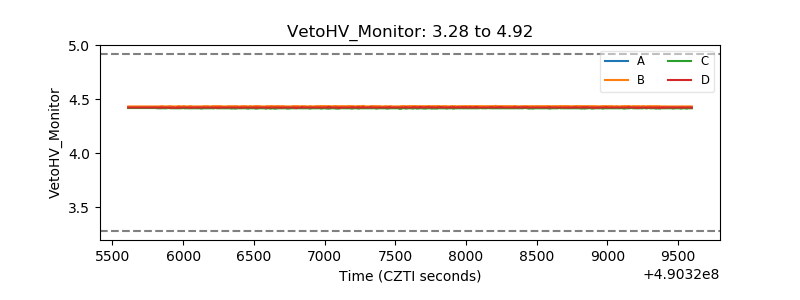 |
| Veto LLD | 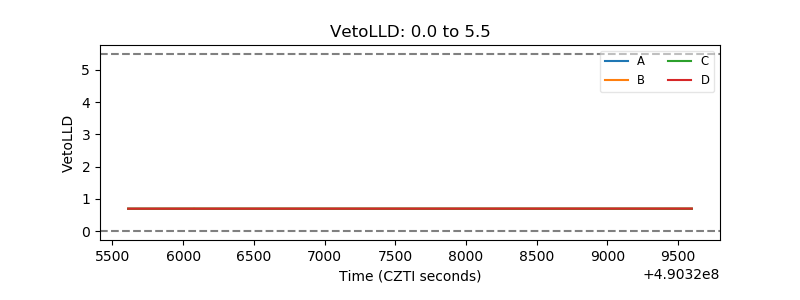 |
| Alpha Counter | 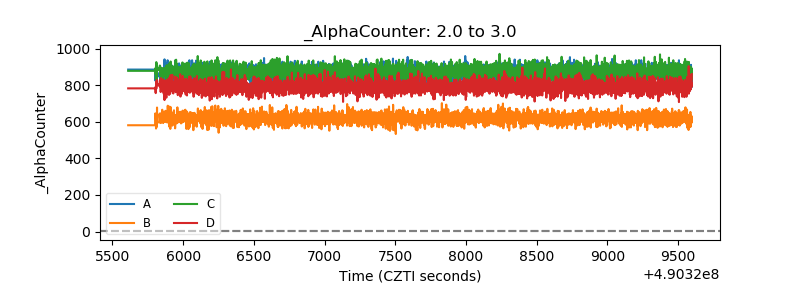 |
| _CPM_Rate | 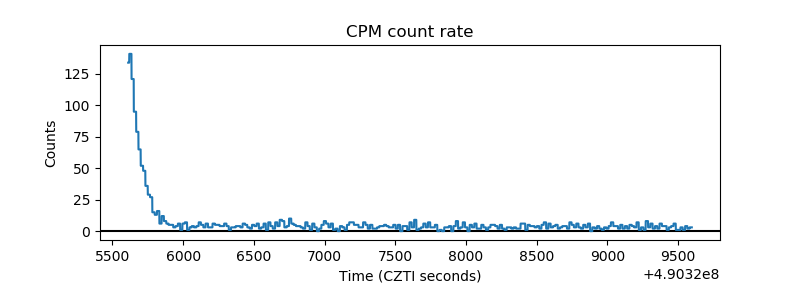 |
| CZT Counter | 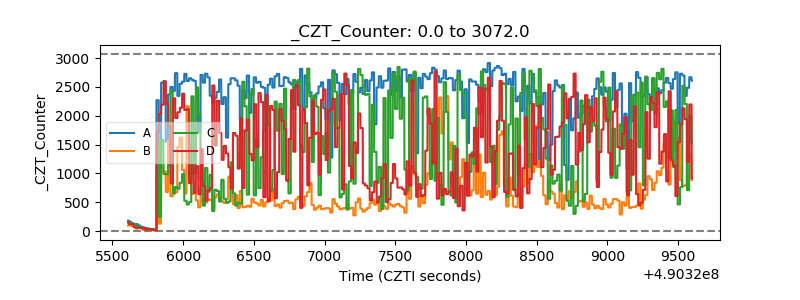 |
| +2.5 Volts monitor |  |
| +5 Volts monitor | 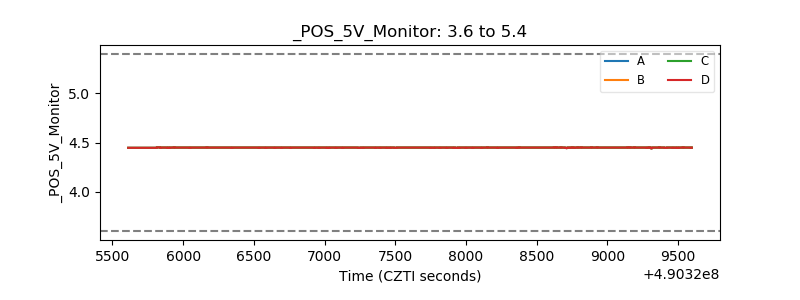 |
| _ROLL_ROT | 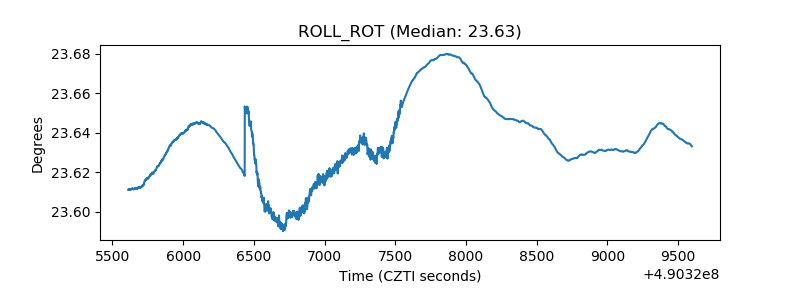 |
| _Roll_DEC | 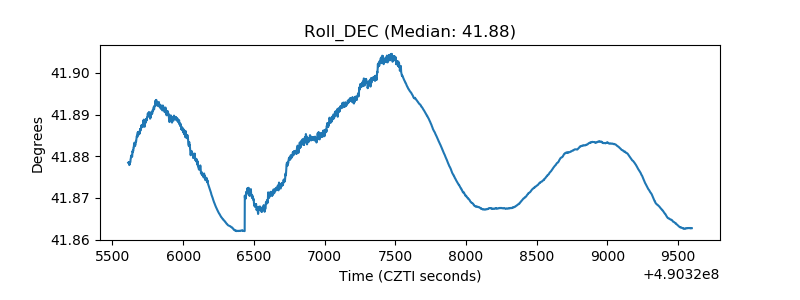 |
| _Roll_RA | 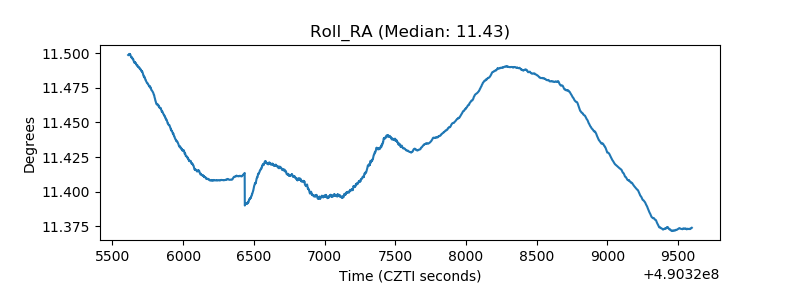 |
| Veto Counter | 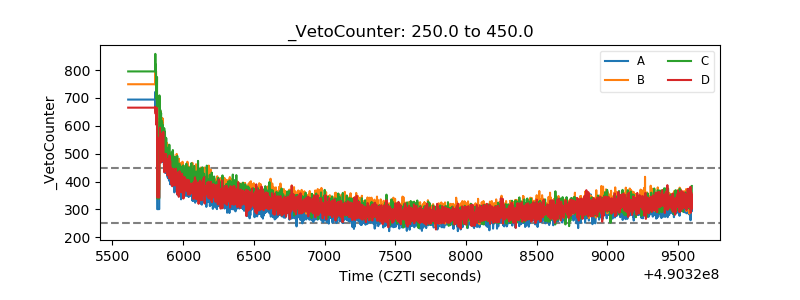 |