| Param | Original file | Final file |
|---|---|---|
| Filename | modeM0/AS1A13_003T01_9000006486_53124cztM0_level2.fits | modeM0/AS1A13_003T01_9000006486_53124cztM0_level2_quad_clean.evt |
| Size (bytes) | 1,049,722,560 | 67,671,360 |
| Size | 1001.1 MB | 64.5 MB |
| Events in quadrant A | 13,896,865 | 165,719 |
| Events in quadrant B | 9,019,767 | 510,551 |
| Events in quadrant C | 5,577,138 | 549,822 |
| Events in quadrant D | 9,867,632 | 373,885 |
| Mode M9 | |||
|---|---|---|---|
| Quadrant | BADHDUFLAG | Total packets | Discarded packets |
| A | 0 | 9 | 0 |
| B | 0 | 9 | 0 |
| C | 0 | 9 | 0 |
| D | 0 | 9 | 0 |
| Mode M0 | |||
|---|---|---|---|
| Quadrant | BADHDUFLAG | Total packets | Discarded packets |
| A | 0 | 45663 | 1 |
| B | 0 | 31278 | 1 |
| C | 0 | 21124 | 4 |
| D | 0 | 33840 | 1 |
| Mode SS | |||
|---|---|---|---|
| Quadrant | BADHDUFLAG | Total packets | Discarded packets |
| A | 0 | 128 | 0 |
| B | 0 | 128 | 0 |
| C | 0 | 128 | 0 |
| D | 0 | 128 | 0 |
| Quadrant | Total seconds | Saturated seconds | Saturation percentage |
|---|---|---|---|
| A | 6436 | 4918 | 76.413922% |
| B | 6437 | 1649 | 25.617524% |
| C | 6436 | 470 | 7.302672% |
| D | 6436 | 2465 | 38.300186% |
Noise dominated data is calculated using 1-second bins in cleaned event files. If a bin has >2000 counts, and if more than 50% of those come from <1% of pixels, then it is considered to be noise-dominated and hence unusable.
| Quadrant | # 1 sec bins | Bins with >0 counts | Bins with >2000 counts | High rate bins dominated by noise | Noise dominated (total time) | Noise dominated (detector-on time) | Marked lightcurve |
|---|---|---|---|---|---|---|---|
| A | 7285 | 6435 | 4250 | 4250 | 58.34% | 66.05% | 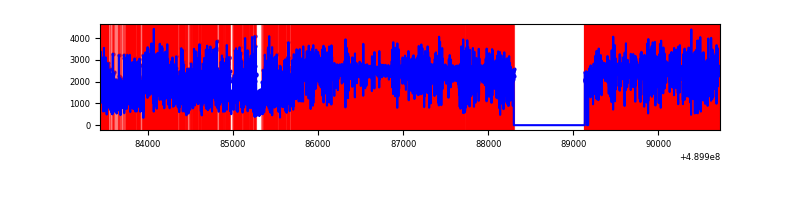 |
| B | 7287 | 6438 | 1310 | 1310 | 17.98% | 20.35% | 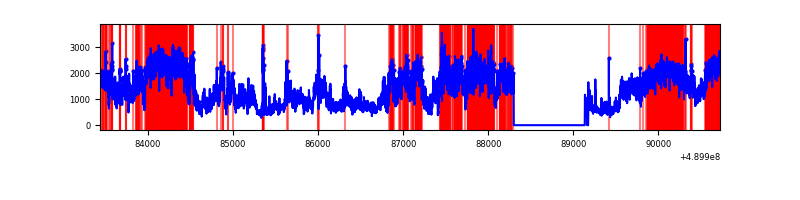 |
| C | 7286 | 6438 | 425 | 425 | 5.83% | 6.60% | 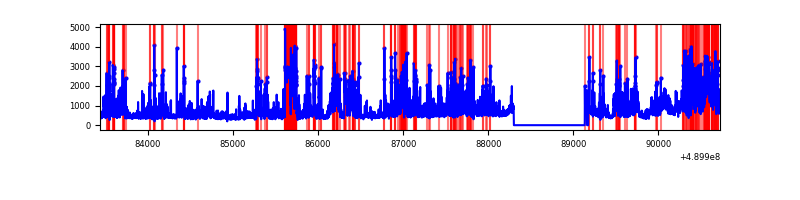 |
| D | 7286 | 6438 | 2137 | 2137 | 29.33% | 33.19% | 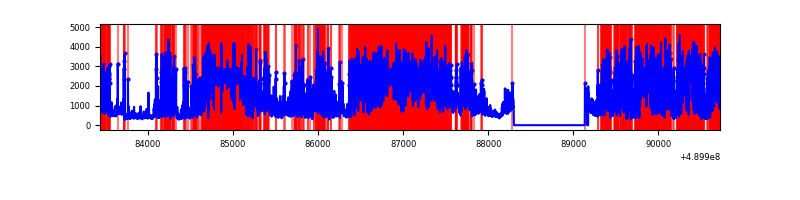 |
Top three noisy pixels from each quadrant. If the there are fewer than three noisy pixels in the level2.evt file, extra rows are filled as -1
| Pixel properties | Quadrant properties | ||||||
|---|---|---|---|---|---|---|---|
| Quadrant | DetID | PixID | Counts | Sigma | Mean | Median | Sigma |
| A | 9 | 191 | 11839932 | 117645.6 | 395 | 384 | 100.6 |
| A | 3 | 62 | 200073 | 1984.24 | 395 | 384 | 100.6 |
| A | 15 | 174 | 107422 | 1063.6 | 395 | 384 | 100.6 |
| B | 10 | 254 | 5984578 | 45866.59 | 615 | 595 | 130.5 |
| B | 4 | 171 | 126056 | 961.65 | 615 | 595 | 130.5 |
| B | 1 | 255 | 112935 | 861.07 | 615 | 595 | 130.5 |
| C | 15 | 224 | 1197339 | 7059.18 | 616 | 611 | 169.5 |
| C | 9 | 38 | 632180 | 3725.46 | 616 | 611 | 169.5 |
| C | 1 | 241 | 554792 | 3268.97 | 616 | 611 | 169.5 |
| D | 12 | 3 | 6392632 | 43056.91 | 511 | 485 | 148.5 |
| D | 3 | 224 | 315288 | 2120.48 | 511 | 485 | 148.5 |
| D | 2 | 120 | 250446 | 1683.71 | 511 | 485 | 148.5 |
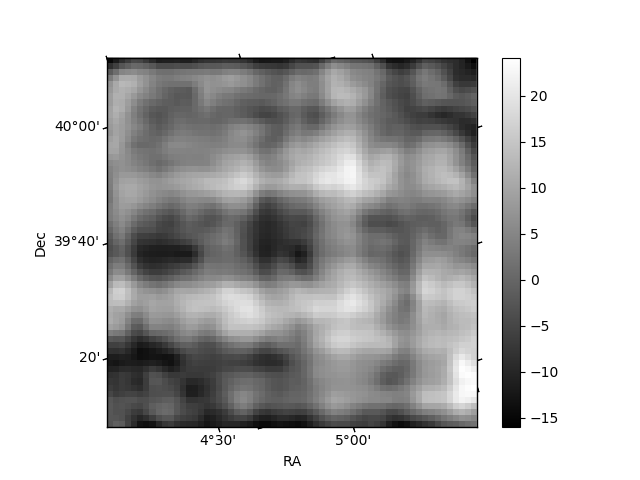
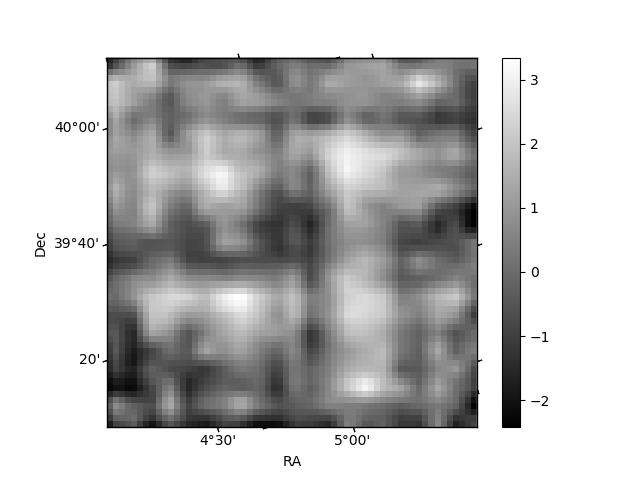
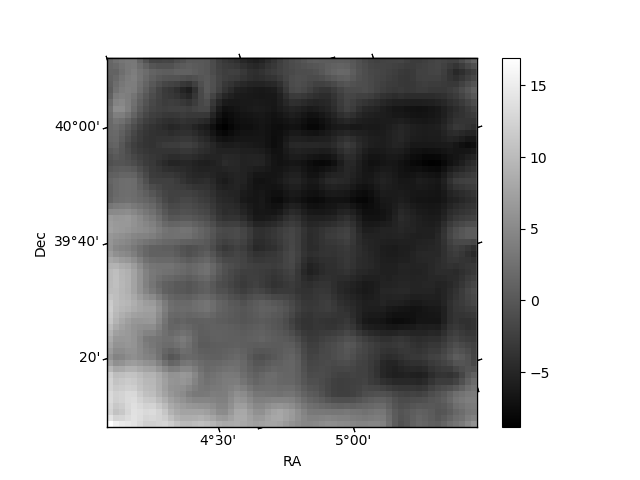
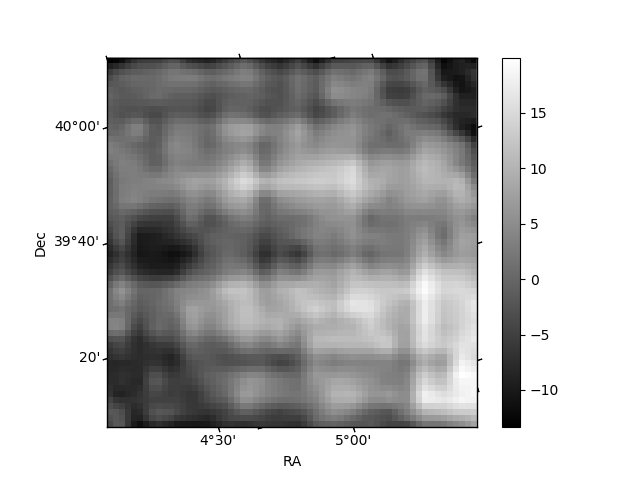
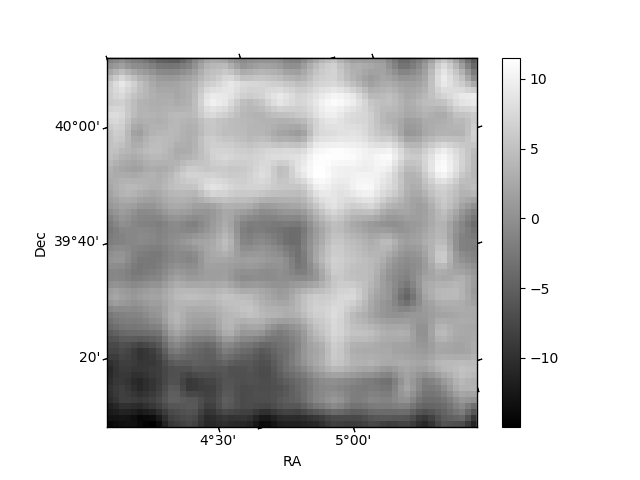
Histogram calculated using DETX and DETY for each event in the final _common_clean file
| Quadrant A | 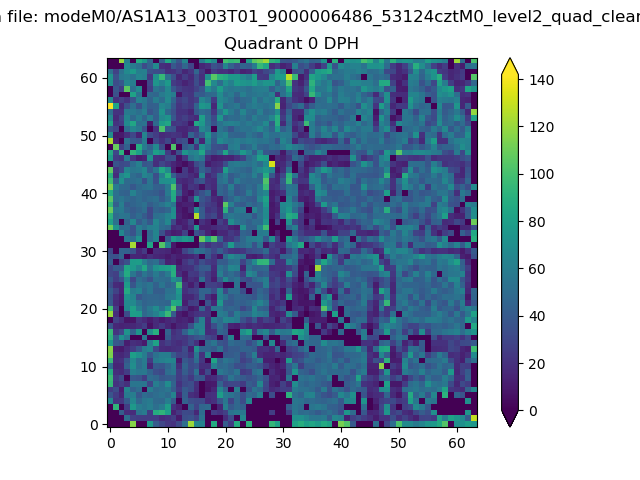 |
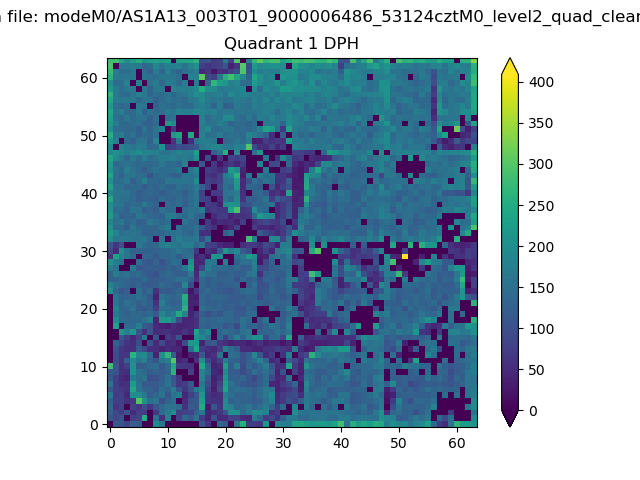 |
Quadrant B |
|---|---|---|---|
| Quadrant D | 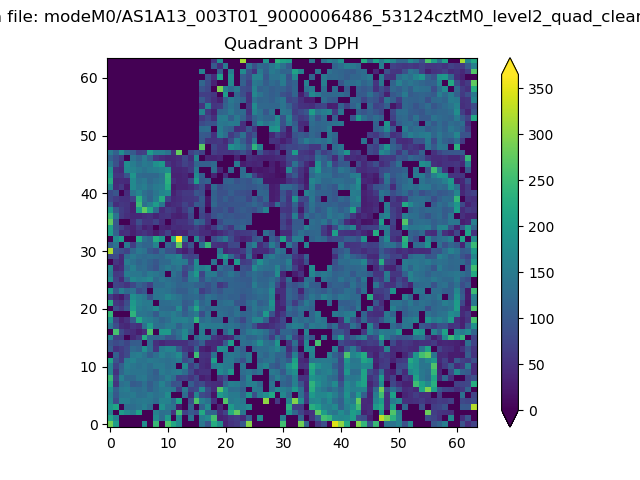 |
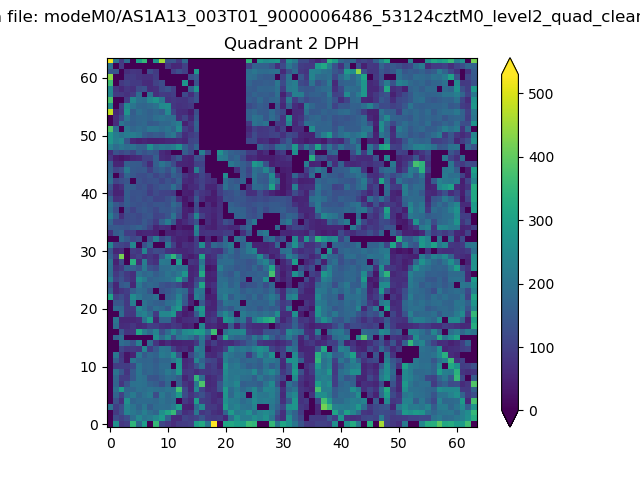 |
Quadrant C |
| Plot type | Count rate plots | Images |
|---|---|---|
| Comparison with Poisson distribution Blue bars denote a histogram of data divided into 1 sec bins. Red curve is a Poisson curve with rate = median count rate of data. |
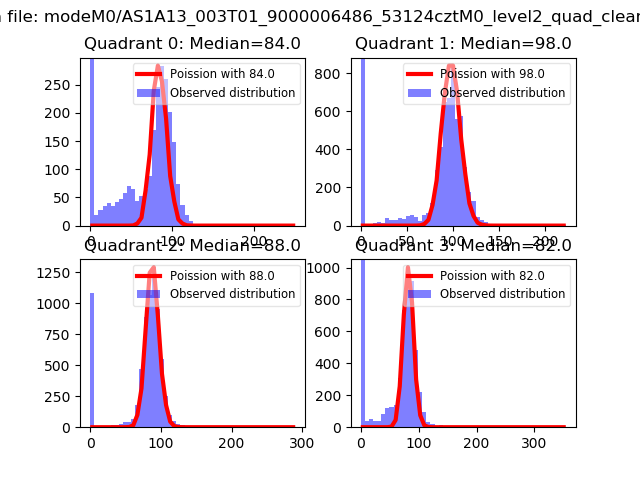 |
 |
| Quadrant-wise count rates Data is divided into 100 sec bins |
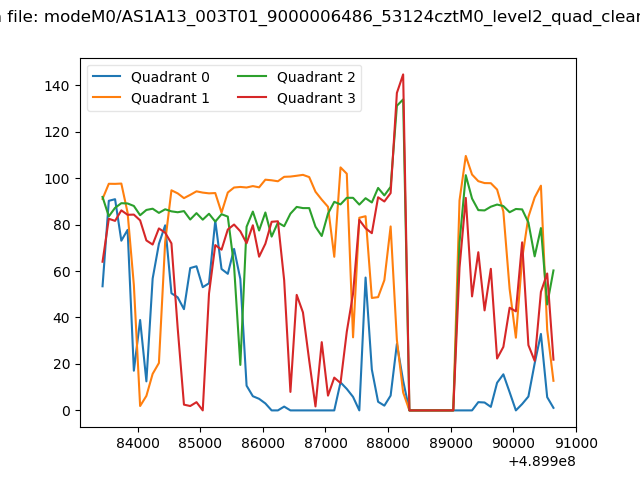 |
|
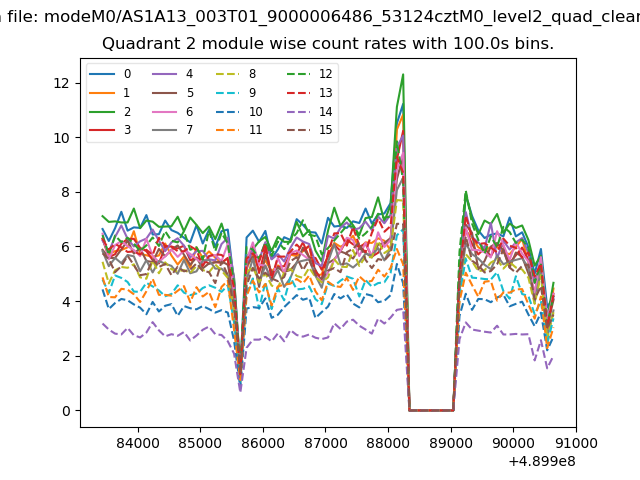
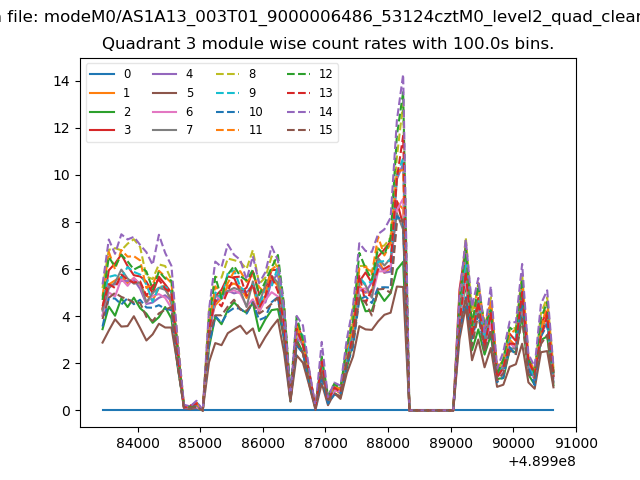
| Module-wise count rates for Quadrant A Data is divided into 100 sec bins |
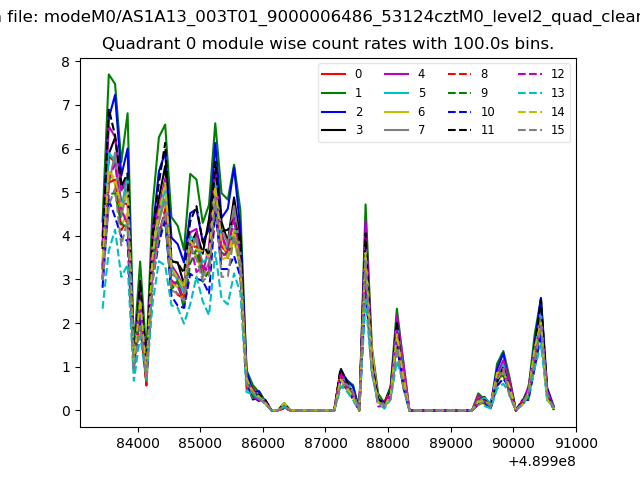 |
 |
| Module-wise count rates for Quadrant B Data is divided into 100 sec bins |
 |
 |
| Module-wise count rates for Quadrant C Data is divided into 100 sec bins |
 |
 |
| Module-wise count rates for Quadrant D Data is divided into 100 sec bins |
 |
 |
| Parameter | Plot |
|---|---|
| CZT HV Monitor | 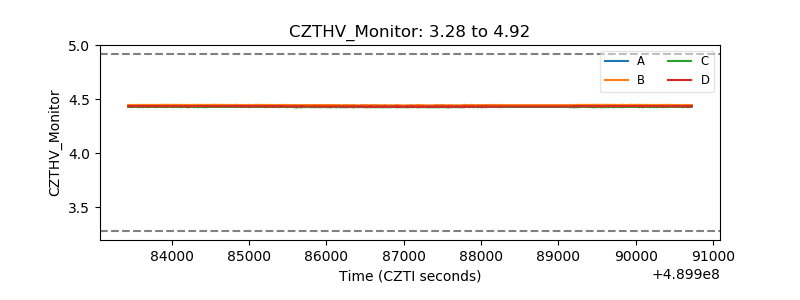 |
| D_VDD | 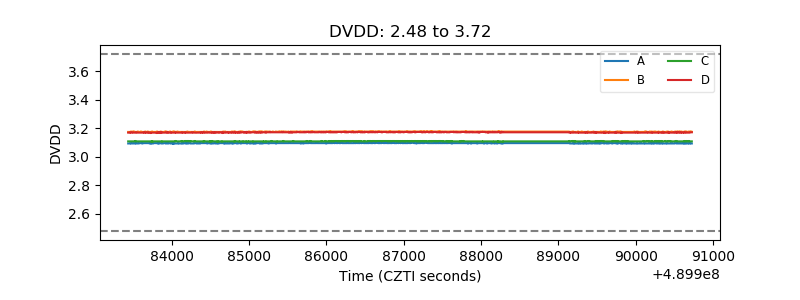 |
| Temperature 1 | 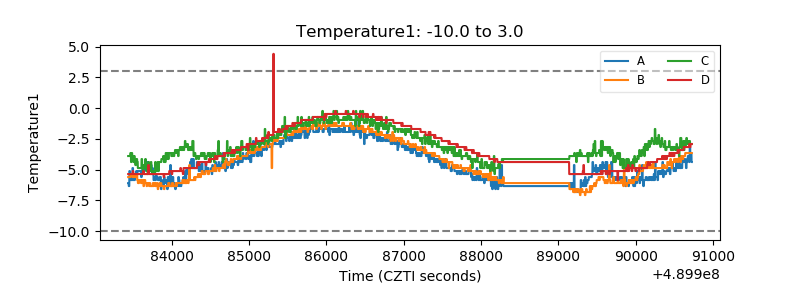 |
| Veto HV Monitor |  |
| Veto LLD | 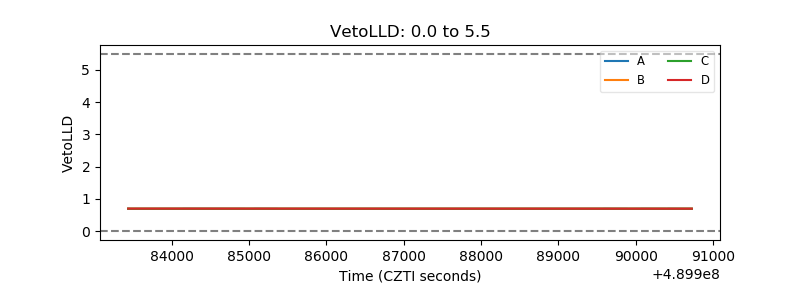 |
| Alpha Counter | 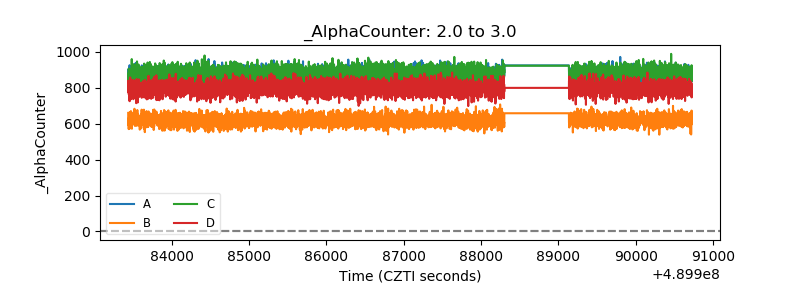 |
| _CPM_Rate | 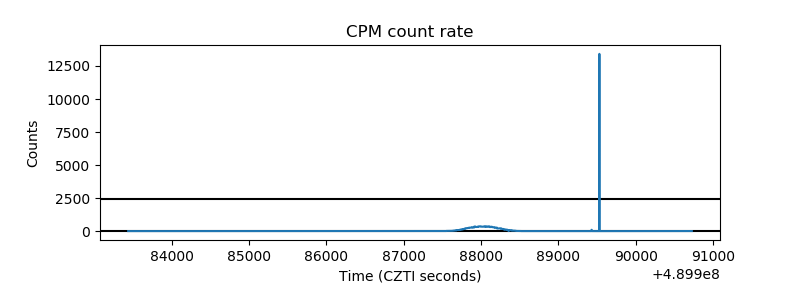 |
| CZT Counter | 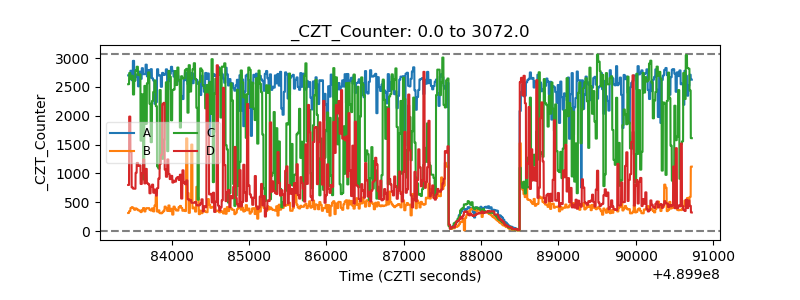 |
| +2.5 Volts monitor |  |
| +5 Volts monitor |  |
| _ROLL_ROT | 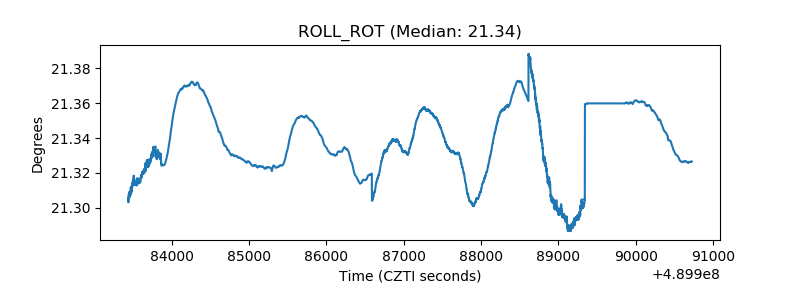 |
| _Roll_DEC | 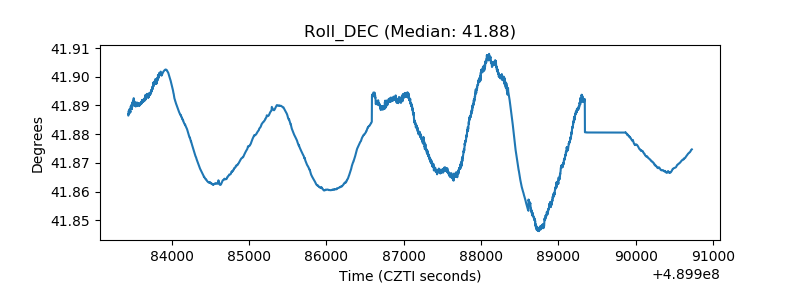 |
| _Roll_RA | 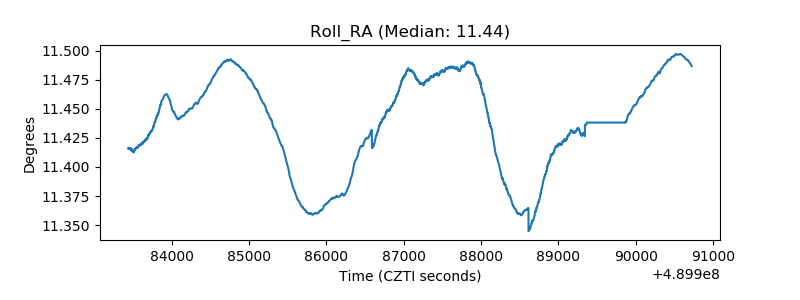 |
| Veto Counter | 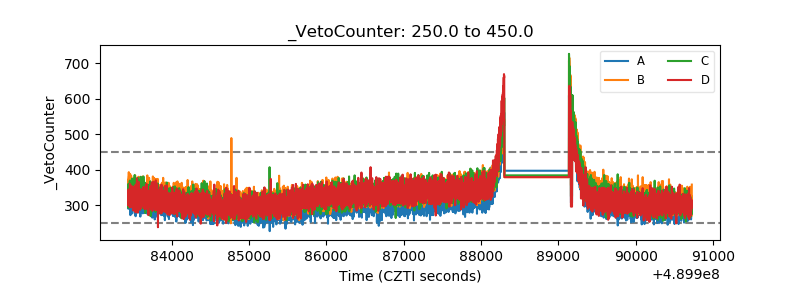 |