| Param | Original file | Final file |
|---|---|---|
| Filename | modeM0/AS1A13_003T01_9000006486_53138cztM0_level2.fits | modeM0/AS1A13_003T01_9000006486_53138cztM0_level2_quad_clean.evt |
| Size (bytes) | 788,434,560 | 68,374,080 |
| Size | 751.9 MB | 65.2 MB |
| Events in quadrant A | 15,464,585 | 2,032 |
| Events in quadrant B | 3,440,395 | 615,175 |
| Events in quadrant C | 5,683,244 | 506,375 |
| Events in quadrant D | 4,117,430 | 515,393 |
| Mode M9 | |||
|---|---|---|---|
| Quadrant | BADHDUFLAG | Total packets | Discarded packets |
| A | 0 | 10 | 0 |
| B | 0 | 10 | 0 |
| C | 0 | 10 | 0 |
| D | 0 | 10 | 0 |
| Mode M0 | |||
|---|---|---|---|
| Quadrant | BADHDUFLAG | Total packets | Discarded packets |
| A | 0 | 50117 | 94 |
| B | 0 | 14771 | 7 |
| C | 0 | 21155 | 12 |
| D | 0 | 16614 | 18 |
| Mode SS | |||
|---|---|---|---|
| Quadrant | BADHDUFLAG | Total packets | Discarded packets |
| A | 0 | 126 | 0 |
| B | 0 | 126 | 0 |
| C | 0 | 126 | 0 |
| D | 0 | 126 | 0 |
| Quadrant | Total seconds | Saturated seconds | Saturation percentage |
|---|---|---|---|
| A | 6168 | 6152 | 99.740597% |
| B | 6177 | 219 | 3.545410% |
| C | 6176 | 637 | 10.314119% |
| D | 6175 | 233 | 3.773279% |
Noise dominated data is calculated using 1-second bins in cleaned event files. If a bin has >2000 counts, and if more than 50% of those come from <1% of pixels, then it is considered to be noise-dominated and hence unusable.
| Quadrant | # 1 sec bins | Bins with >0 counts | Bins with >2000 counts | High rate bins dominated by noise | Noise dominated (total time) | Noise dominated (detector-on time) | Marked lightcurve |
|---|---|---|---|---|---|---|---|
| A | 7175 | 6168 | 6042 | 6042 | 84.21% | 97.96% | 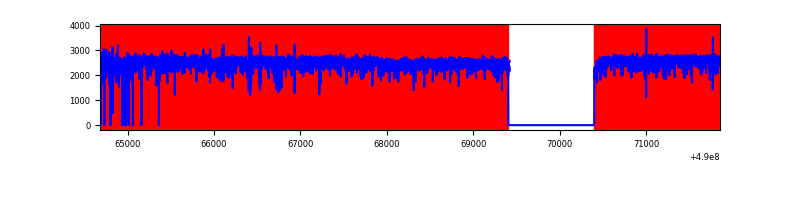 |
| B | 7177 | 6182 | 126 | 126 | 1.76% | 2.04% | 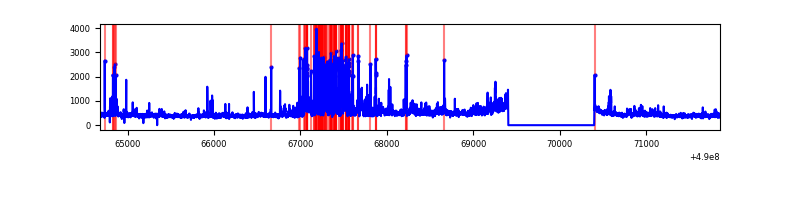 |
| C | 7177 | 6182 | 583 | 583 | 8.12% | 9.43% | 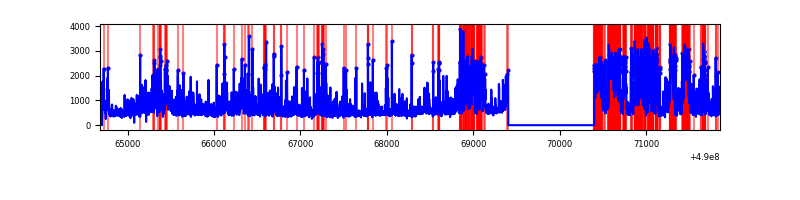 |
| D | 7177 | 6181 | 235 | 235 | 3.27% | 3.80% | 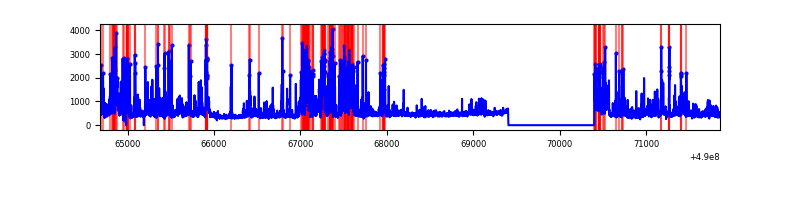 |
Top three noisy pixels from each quadrant. If the there are fewer than three noisy pixels in the level2.evt file, extra rows are filled as -1
| Pixel properties | Quadrant properties | ||||||
|---|---|---|---|---|---|---|---|
| Quadrant | DetID | PixID | Counts | Sigma | Mean | Median | Sigma |
| A | 9 | 191 | 14461835 | 306645.66 | 180 | 175 | 47.2 |
| A | 0 | 8 | 144987 | 3070.6 | 180 | 175 | 47.2 |
| A | 15 | 174 | 64092 | 1355.3 | 180 | 175 | 47.2 |
| B | 2 | 249 | 429130 | 3238.49 | 621 | 599 | 132.3 |
| B | 10 | 254 | 134616 | 1012.79 | 621 | 599 | 132.3 |
| B | 0 | 213 | 130416 | 981.05 | 621 | 599 | 132.3 |
| C | 0 | 240 | 1605496 | 9911.06 | 585 | 581 | 161.9 |
| C | 15 | 224 | 645895 | 3985.1 | 585 | 581 | 161.9 |
| C | 7 | 80 | 455817 | 2811.28 | 585 | 581 | 161.9 |
| D | 8 | 176 | 559103 | 3268.86 | 598 | 572 | 170.9 |
| D | 3 | 224 | 273845 | 1599.36 | 598 | 572 | 170.9 |
| D | 6 | 42 | 151102 | 880.99 | 598 | 572 | 170.9 |
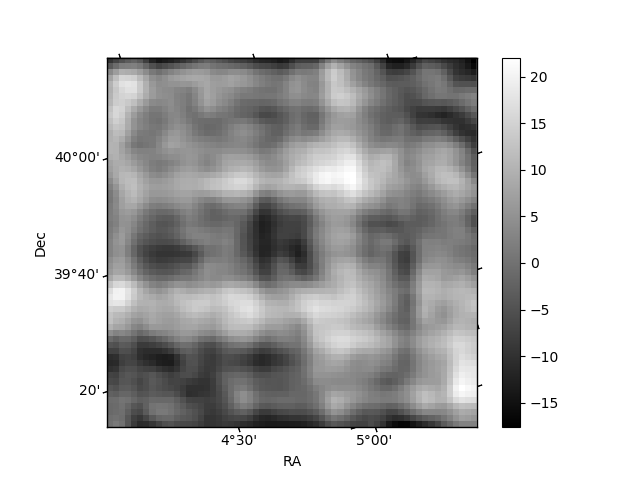
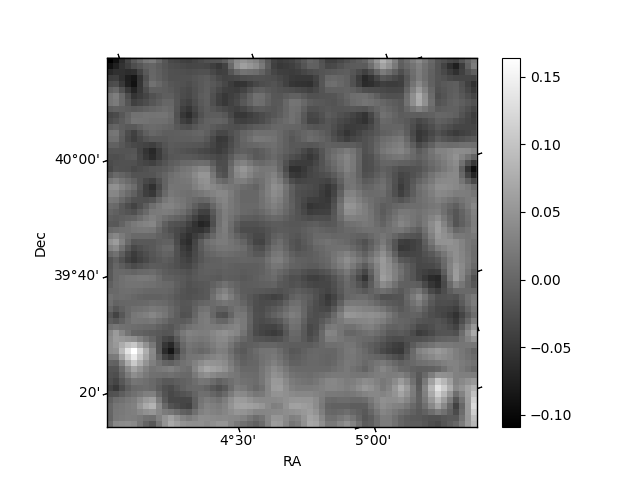
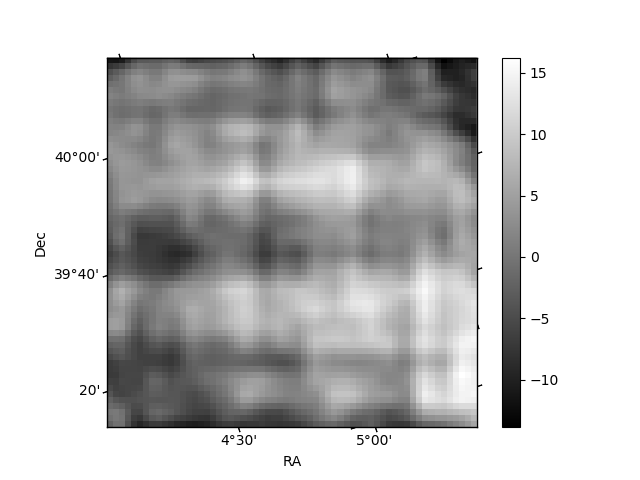
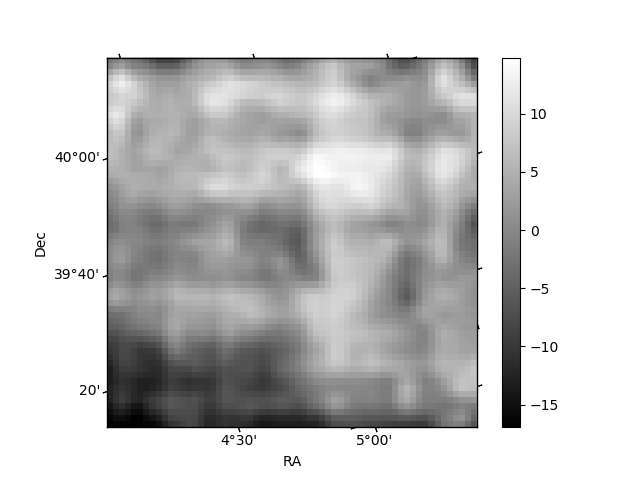
Histogram calculated using DETX and DETY for each event in the final _common_clean file
| Quadrant A | 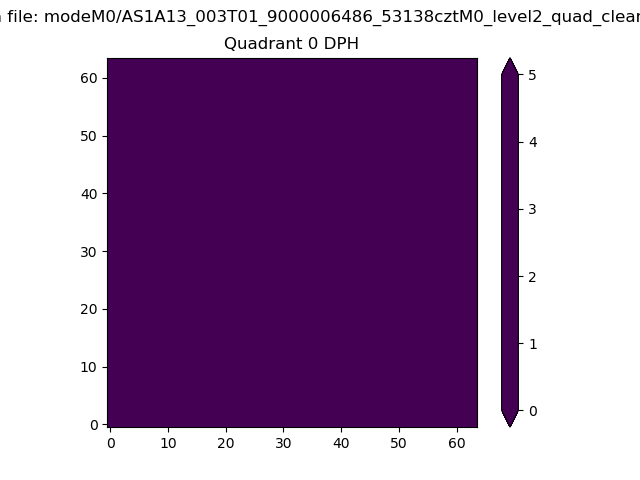 |
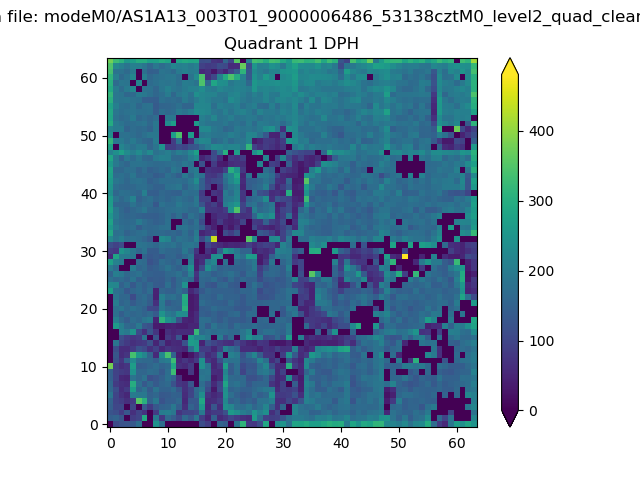 |
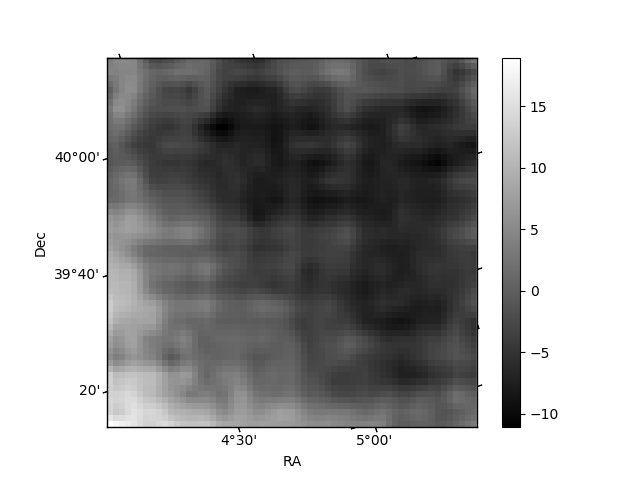
Quadrant B |
|---|---|---|---|
| Quadrant D | 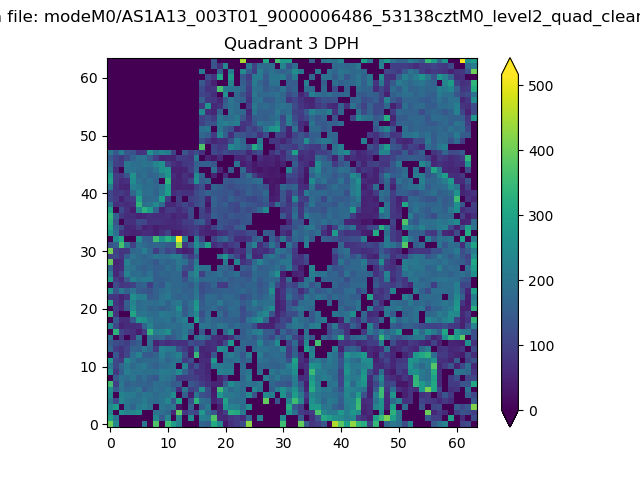 |
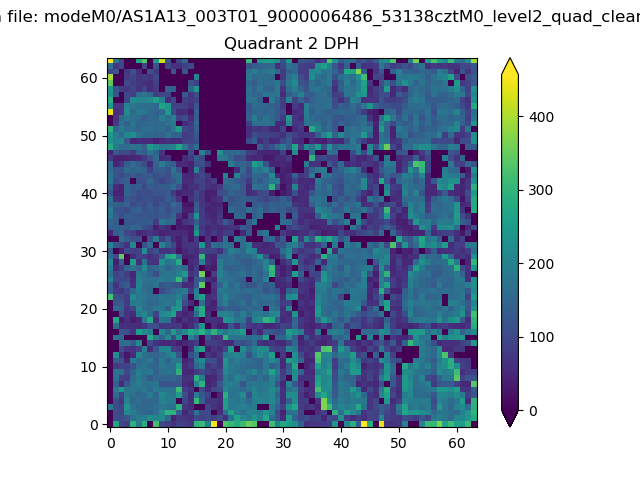 |
Quadrant C |
| Plot type | Count rate plots | Images |
|---|---|---|
| Comparison with Poisson distribution Blue bars denote a histogram of data divided into 1 sec bins. Red curve is a Poisson curve with rate = median count rate of data. |
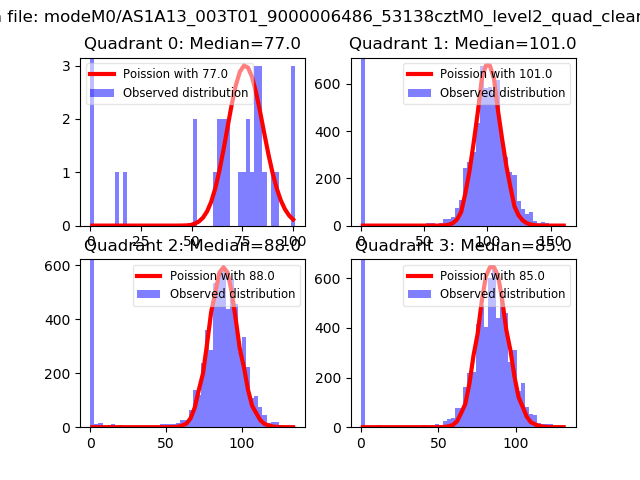 |
 |
| Quadrant-wise count rates Data is divided into 100 sec bins |
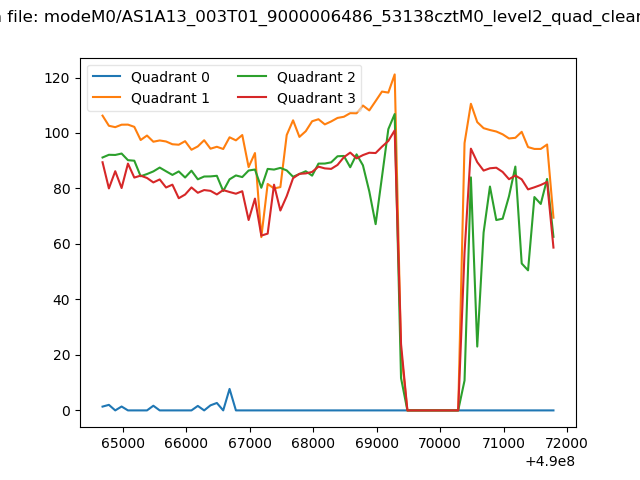 |
|
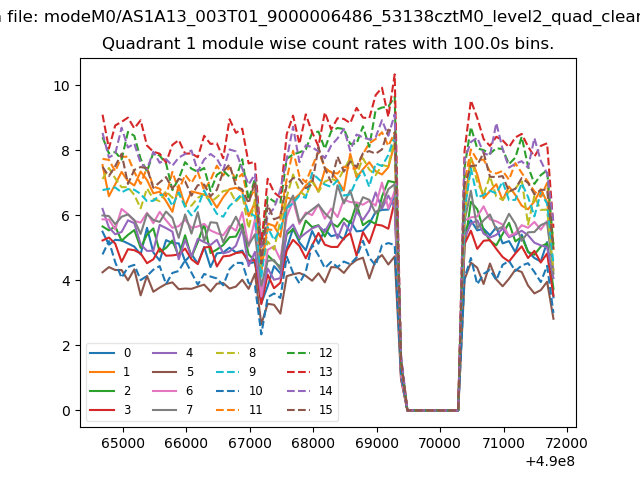
| Module-wise count rates for Quadrant A Data is divided into 100 sec bins |
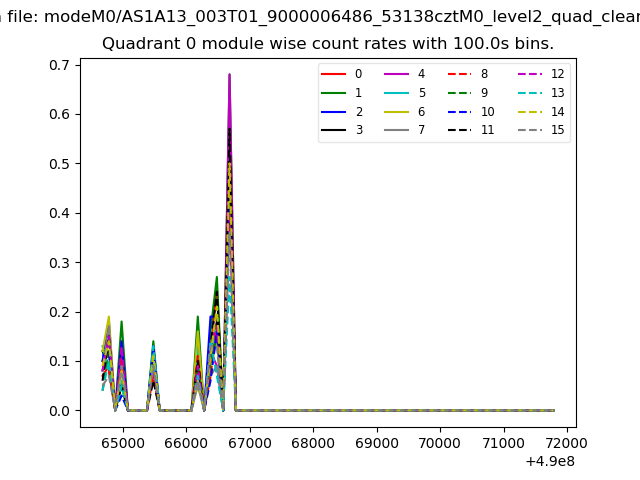 |
 |
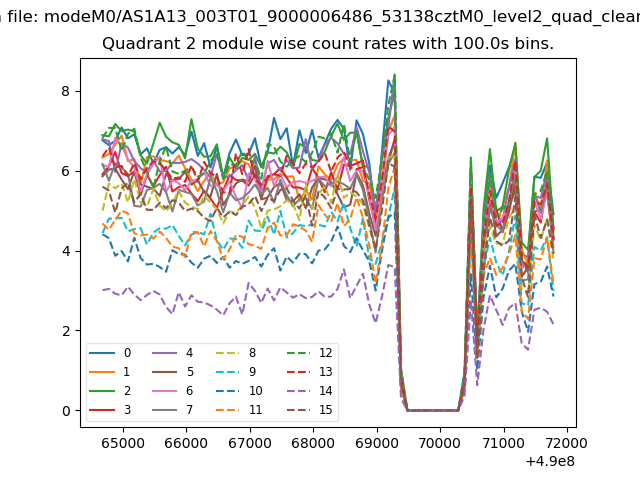
| Module-wise count rates for Quadrant B Data is divided into 100 sec bins |
 |
 |
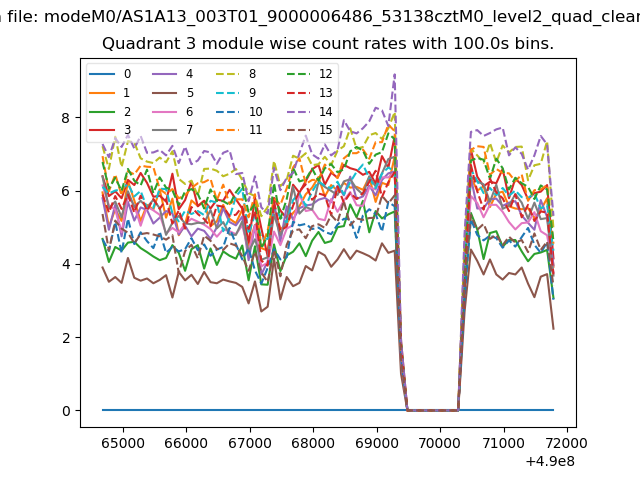
| Module-wise count rates for Quadrant C Data is divided into 100 sec bins |
 |
 |
| Module-wise count rates for Quadrant D Data is divided into 100 sec bins |
 |
 |
| Parameter | Plot |
|---|---|
| CZT HV Monitor |  |
| D_VDD | 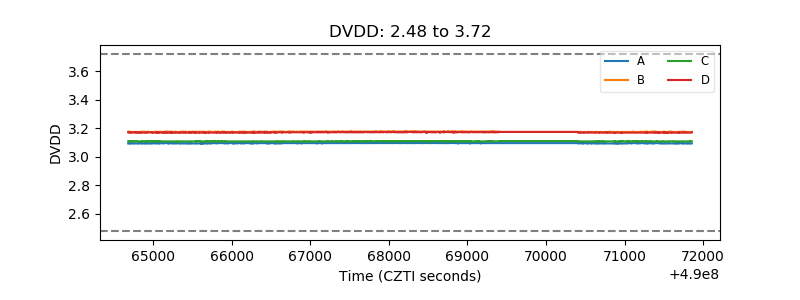 |
| Temperature 1 | 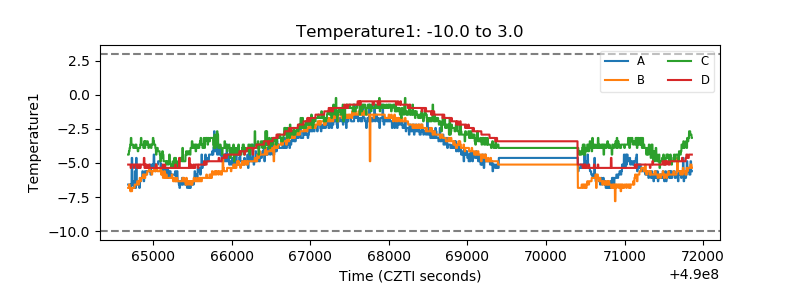 |
| Veto HV Monitor | 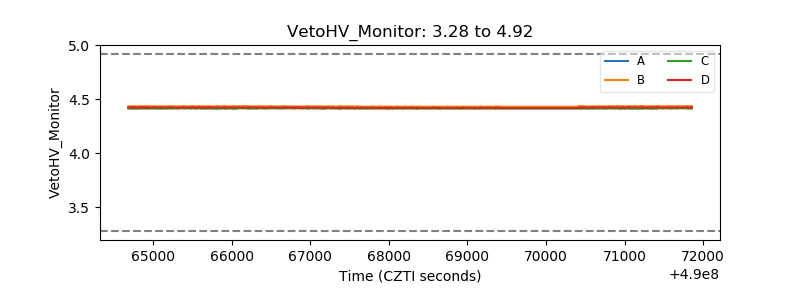 |
| Veto LLD | 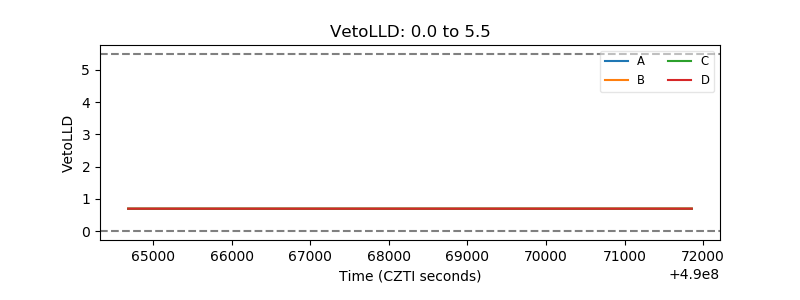 |
| Alpha Counter | 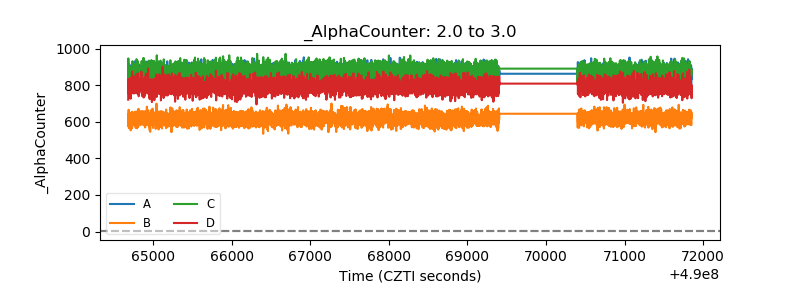 |
| _CPM_Rate | 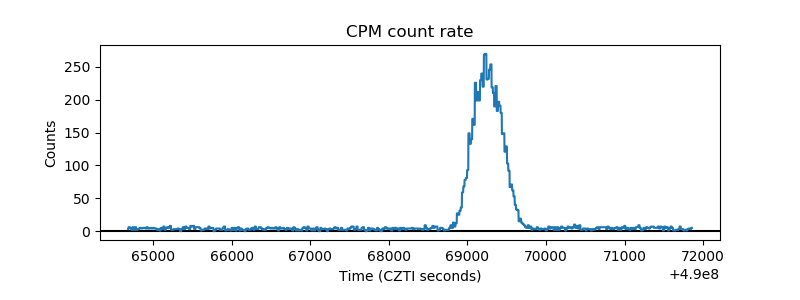 |
| CZT Counter | 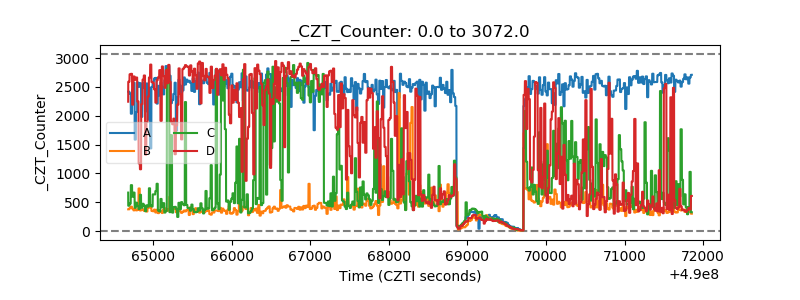 |
| +2.5 Volts monitor |  |
| +5 Volts monitor |  |
| _ROLL_ROT | 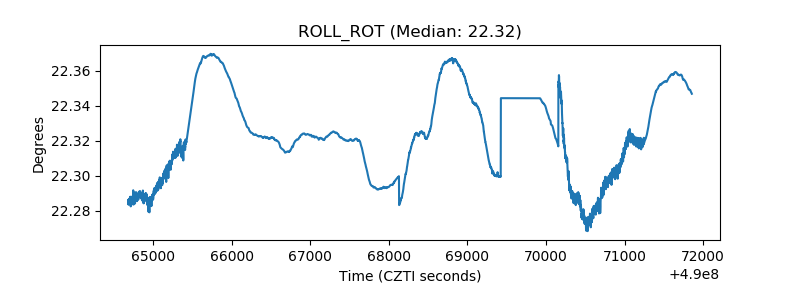 |
| _Roll_DEC | 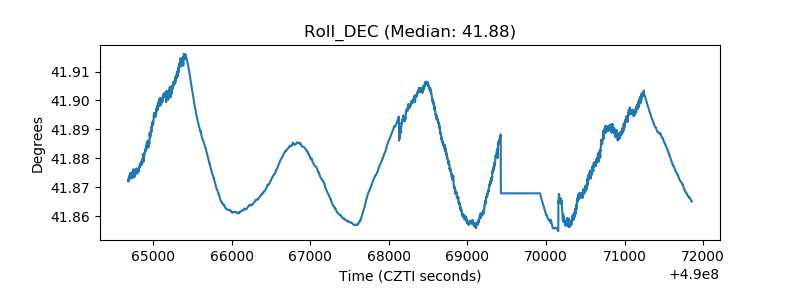 |
| _Roll_RA | 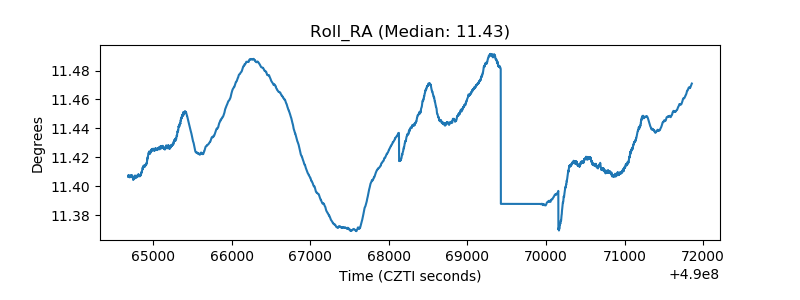 |
| Veto Counter | 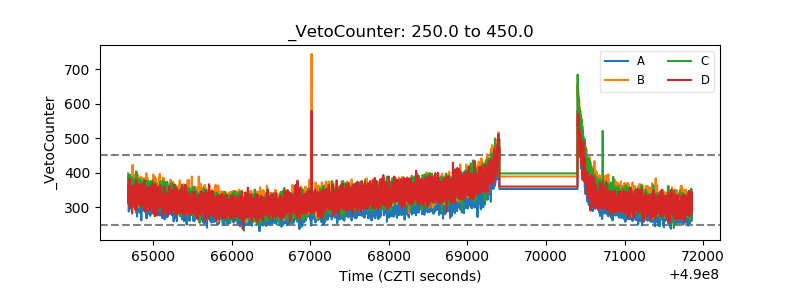 |