| Param | Original file | Final file |
|---|---|---|
| Filename | modeM0/AS1A13_003T01_9000006486_53139cztM0_level2.fits | modeM0/AS1A13_003T01_9000006486_53139cztM0_level2_quad_clean.evt |
| Size (bytes) | 868,561,920 | 75,916,800 |
| Size | 828.3 MB | 72.4 MB |
| Events in quadrant A | 17,192,077 | 1,976 |
| Events in quadrant B | 3,947,248 | 676,397 |
| Events in quadrant C | 6,138,926 | 567,924 |
| Events in quadrant D | 4,345,049 | 578,069 |
| Mode M9 | |||
|---|---|---|---|
| Quadrant | BADHDUFLAG | Total packets | Discarded packets |
| A | 0 | 6 | 0 |
| B | 0 | 6 | 0 |
| C | 0 | 6 | 0 |
| D | 0 | 6 | 0 |
| Mode M0 | |||
|---|---|---|---|
| Quadrant | BADHDUFLAG | Total packets | Discarded packets |
| A | 0 | 55602 | 1 |
| B | 0 | 16841 | 1 |
| C | 0 | 23062 | 1 |
| D | 0 | 17916 | 1 |
| Mode SS | |||
|---|---|---|---|
| Quadrant | BADHDUFLAG | Total packets | Discarded packets |
| A | 0 | 140 | 0 |
| B | 0 | 140 | 0 |
| C | 0 | 140 | 0 |
| D | 0 | 140 | 0 |
| Quadrant | Total seconds | Saturated seconds | Saturation percentage |
|---|---|---|---|
| A | 6803 | 6787 | 99.764810% |
| B | 6803 | 232 | 3.410260% |
| C | 6803 | 747 | 10.980450% |
| D | 6803 | 279 | 4.101132% |
Noise dominated data is calculated using 1-second bins in cleaned event files. If a bin has >2000 counts, and if more than 50% of those come from <1% of pixels, then it is considered to be noise-dominated and hence unusable.
| Quadrant | # 1 sec bins | Bins with >0 counts | Bins with >2000 counts | High rate bins dominated by noise | Noise dominated (total time) | Noise dominated (detector-on time) | Marked lightcurve |
|---|---|---|---|---|---|---|---|
| A | 7397 | 6802 | 6662 | 6662 | 90.06% | 97.94% | 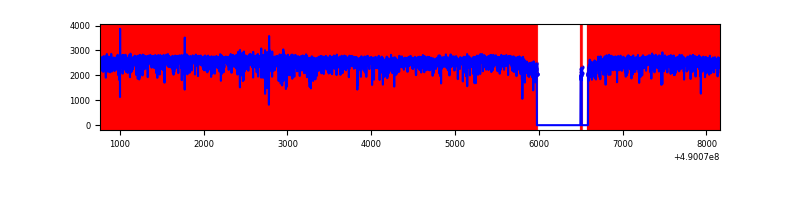 |
| B | 7398 | 6804 | 97 | 97 | 1.31% | 1.43% | 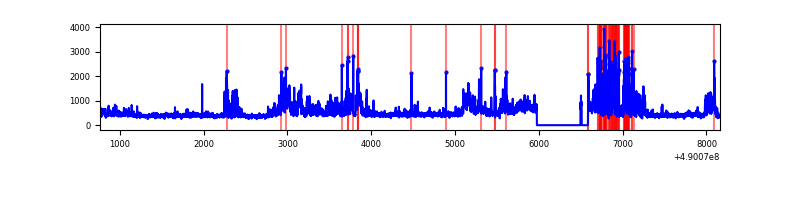 |
| C | 7398 | 6804 | 680 | 680 | 9.19% | 9.99% | 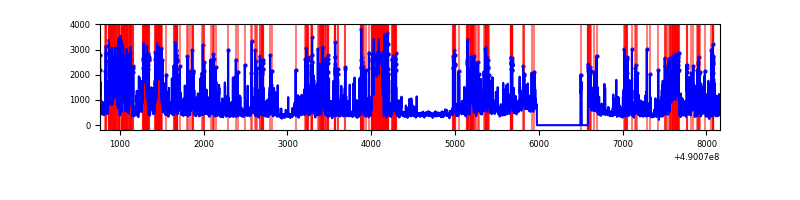 |
| D | 7398 | 6804 | 210 | 210 | 2.84% | 3.09% | 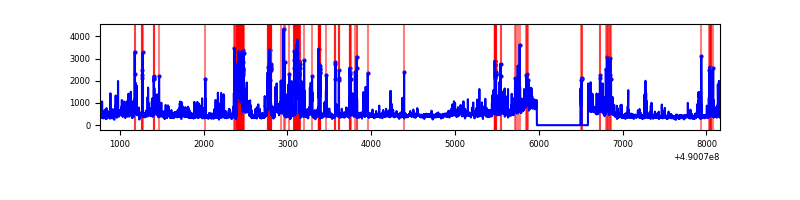 |
Top three noisy pixels from each quadrant. If the there are fewer than three noisy pixels in the level2.evt file, extra rows are filled as -1
| Pixel properties | Quadrant properties | ||||||
|---|---|---|---|---|---|---|---|
| Quadrant | DetID | PixID | Counts | Sigma | Mean | Median | Sigma |
| A | 9 | 191 | 16107974 | 325772.64 | 189 | 184 | 49.4 |
| A | 0 | 8 | 212149 | 4286.89 | 189 | 184 | 49.4 |
| A | 7 | 206 | 64263 | 1295.97 | 189 | 184 | 49.4 |
| B | 2 | 249 | 431228 | 2943.71 | 688 | 664 | 146.3 |
| B | 10 | 254 | 419997 | 2866.92 | 688 | 664 | 146.3 |
| B | 4 | 81 | 119807 | 814.56 | 688 | 664 | 146.3 |
| C | 15 | 224 | 1648394 | 9167.54 | 647 | 640 | 179.7 |
| C | 0 | 240 | 944114 | 5249.17 | 647 | 640 | 179.7 |
| C | 9 | 38 | 369492 | 2052.17 | 647 | 640 | 179.7 |
| D | 8 | 176 | 424105 | 2238.58 | 667 | 639 | 189.2 |
| D | 6 | 42 | 220125 | 1160.27 | 667 | 639 | 189.2 |
| D | 1 | 0 | 201612 | 1062.41 | 667 | 639 | 189.2 |
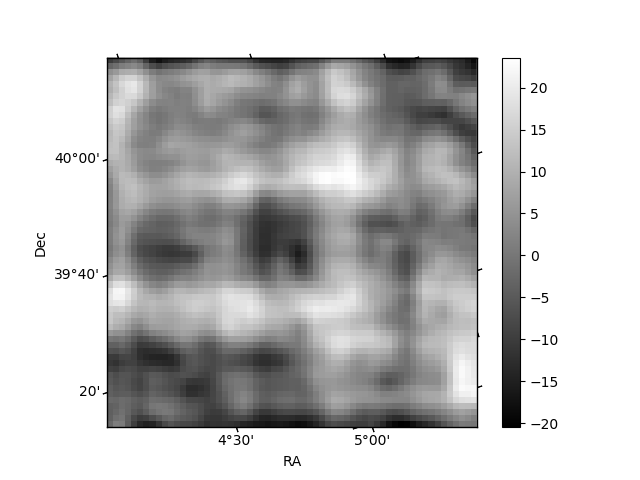
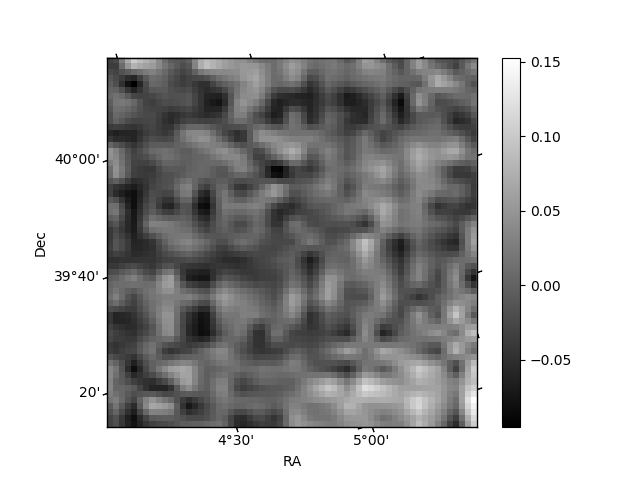
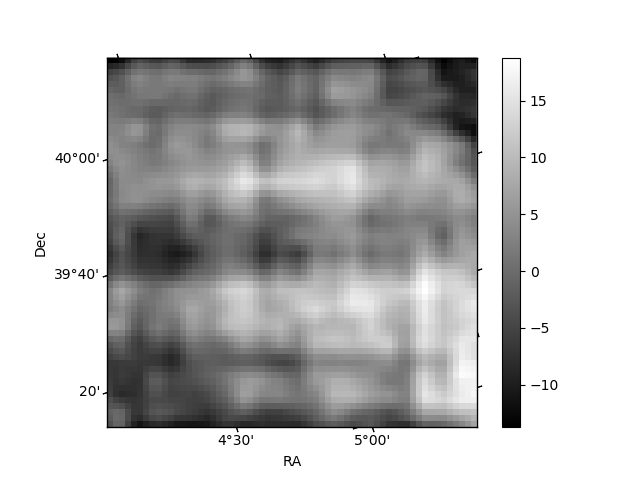
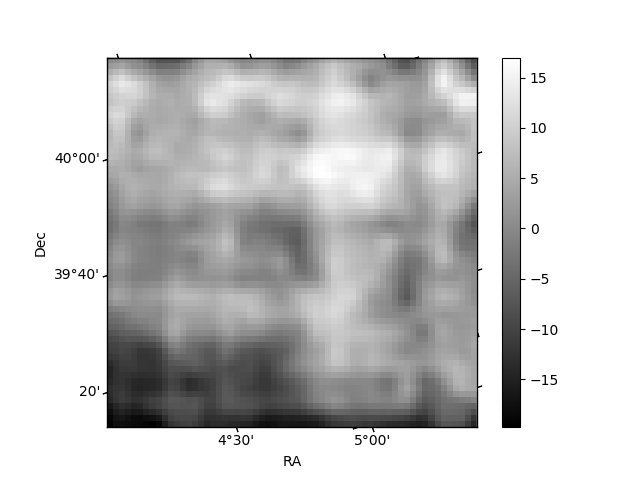
Histogram calculated using DETX and DETY for each event in the final _common_clean file
| Quadrant A | 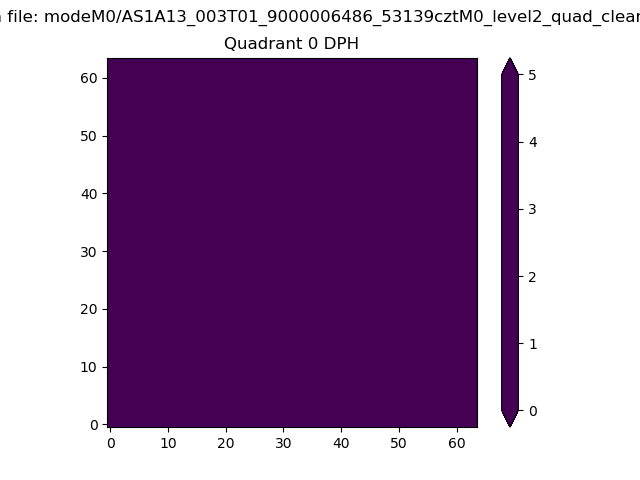 |
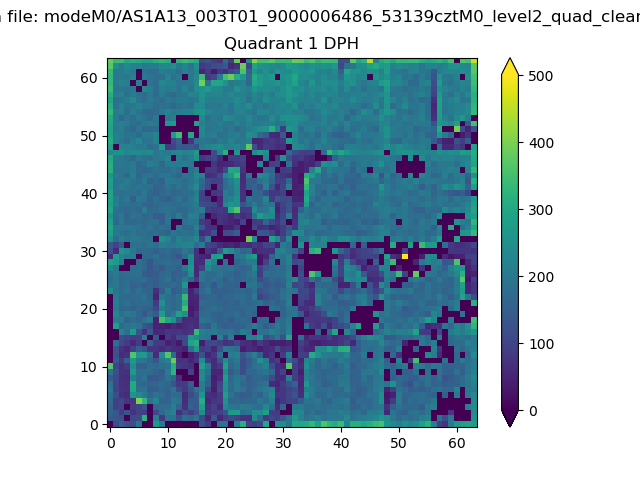 |
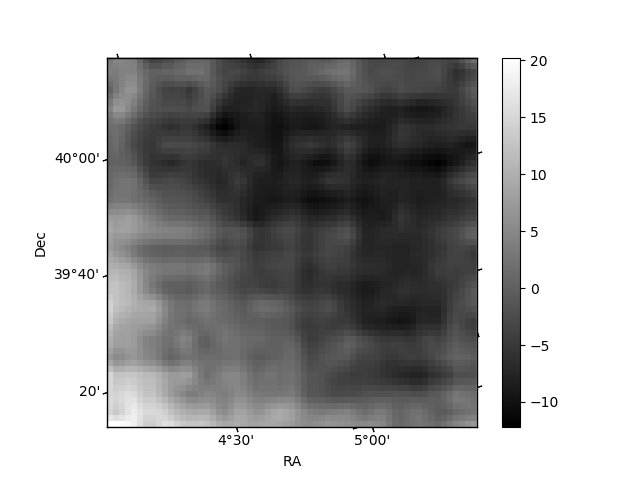
Quadrant B |
|---|---|---|---|
| Quadrant D | 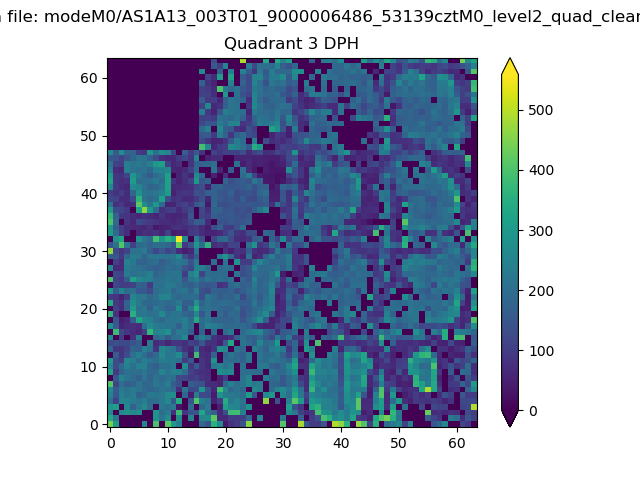 |
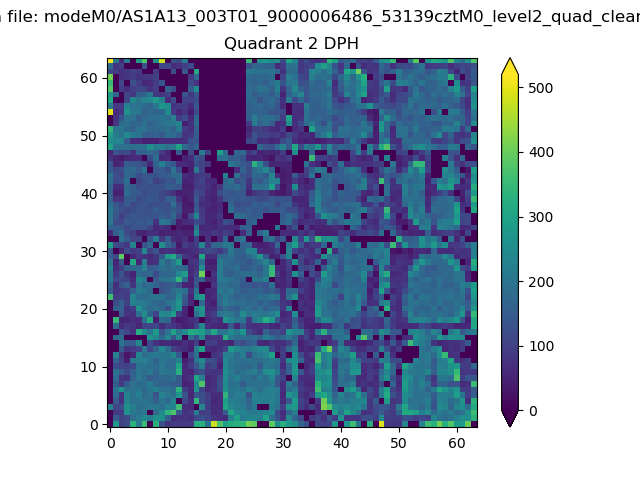 |
Quadrant C |
| Plot type | Count rate plots | Images |
|---|---|---|
| Comparison with Poisson distribution Blue bars denote a histogram of data divided into 1 sec bins. Red curve is a Poisson curve with rate = median count rate of data. |
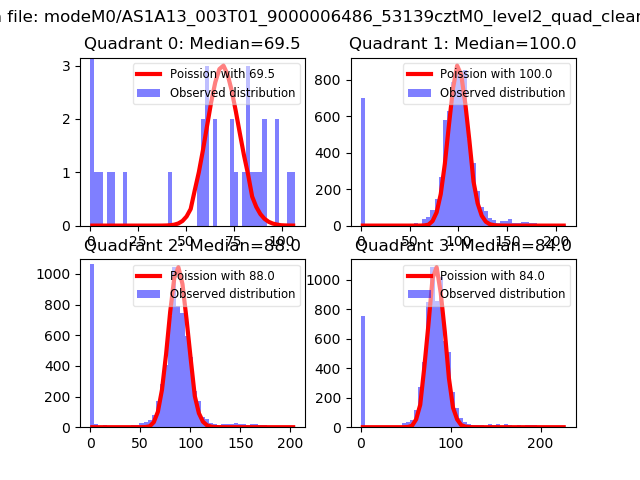 |
 |
| Quadrant-wise count rates Data is divided into 100 sec bins |
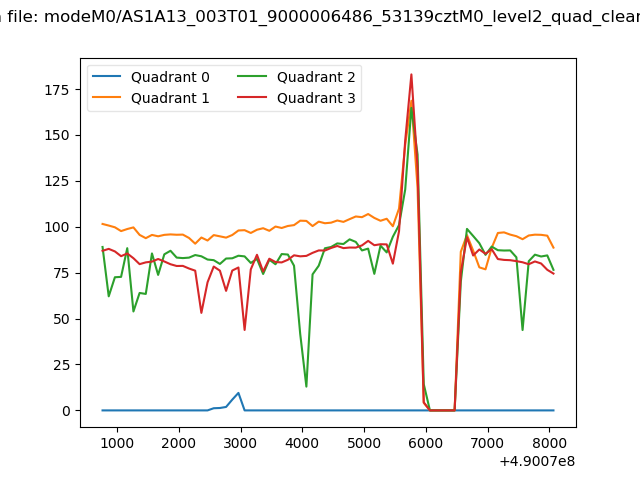 |
|
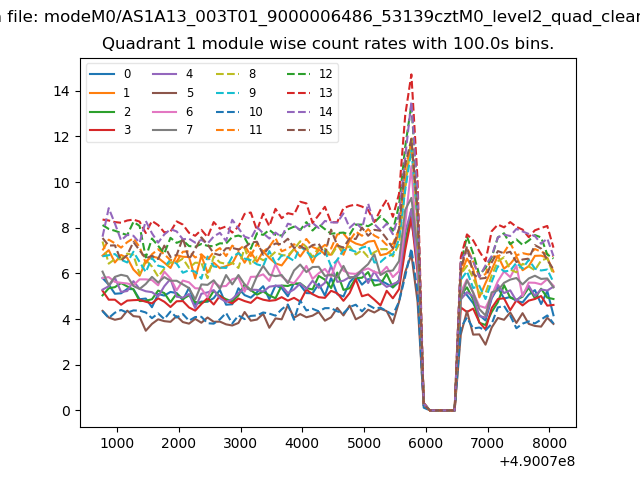
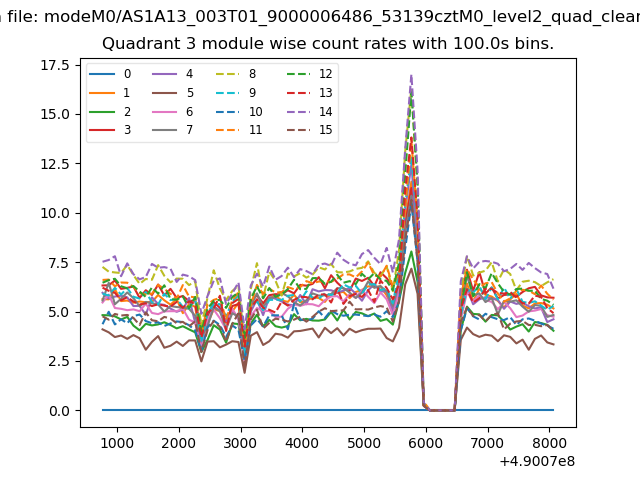
| Module-wise count rates for Quadrant A Data is divided into 100 sec bins |
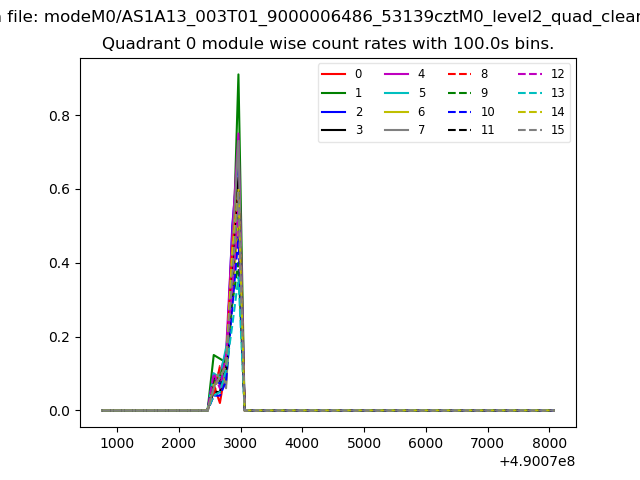 |
 |
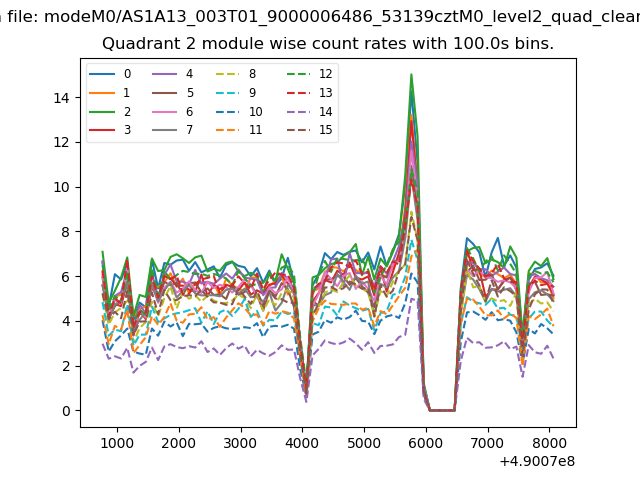
| Module-wise count rates for Quadrant B Data is divided into 100 sec bins |
 |
 |
| Module-wise count rates for Quadrant C Data is divided into 100 sec bins |
 |
 |
| Module-wise count rates for Quadrant D Data is divided into 100 sec bins |
 |
 |
| Parameter | Plot |
|---|---|
| CZT HV Monitor | 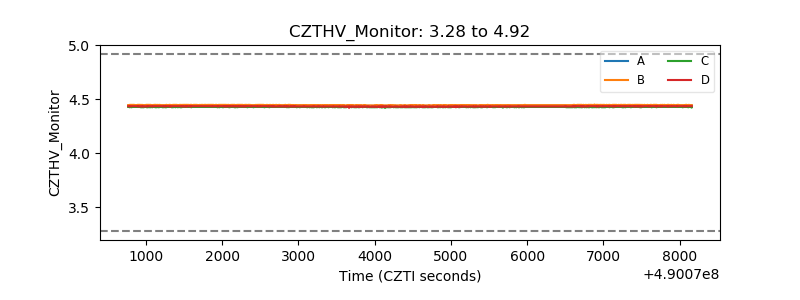 |
| D_VDD | 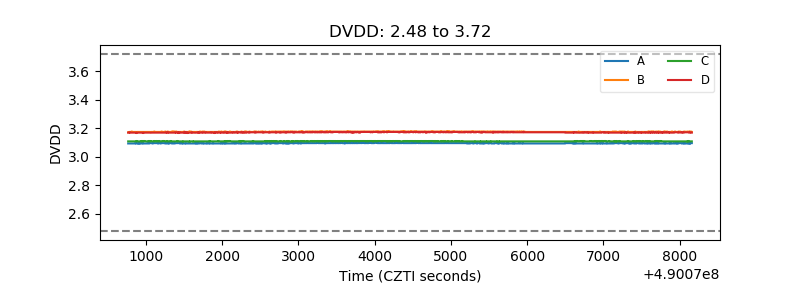 |
| Temperature 1 | 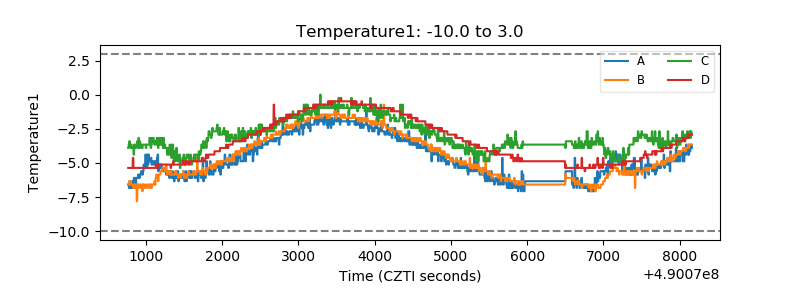 |
| Veto HV Monitor | 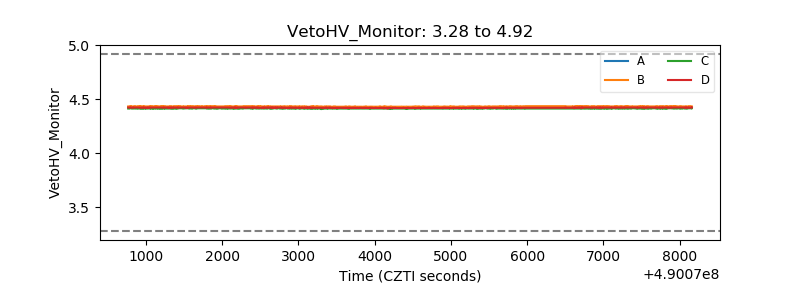 |
| Veto LLD | 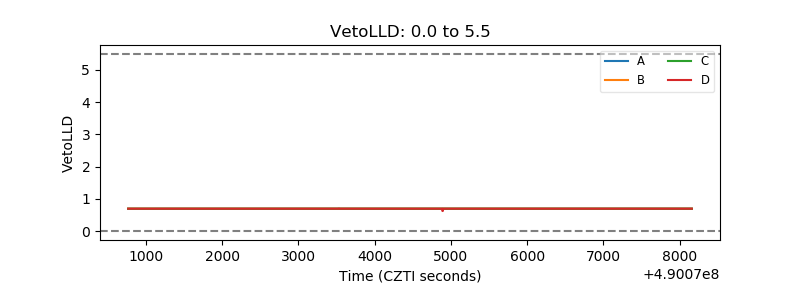 |
| Alpha Counter | 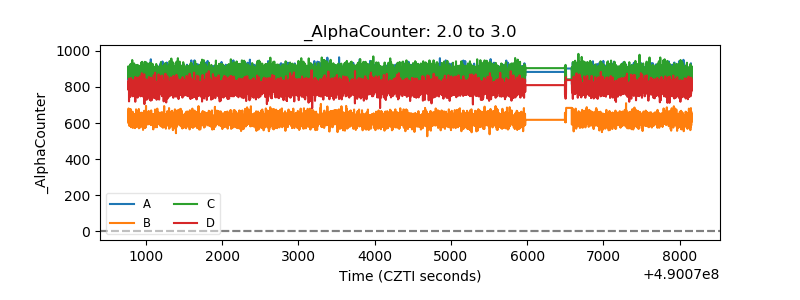 |
| _CPM_Rate | 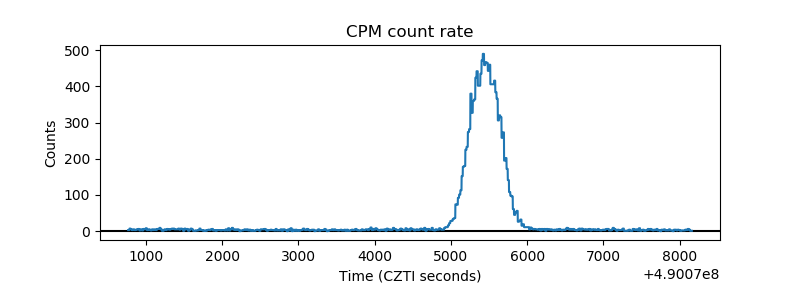 |
| CZT Counter | 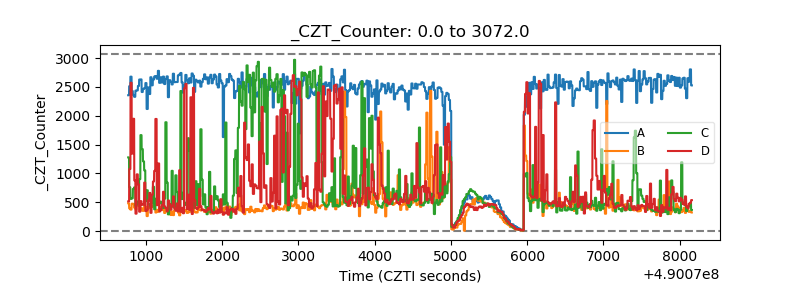 |
| +2.5 Volts monitor | 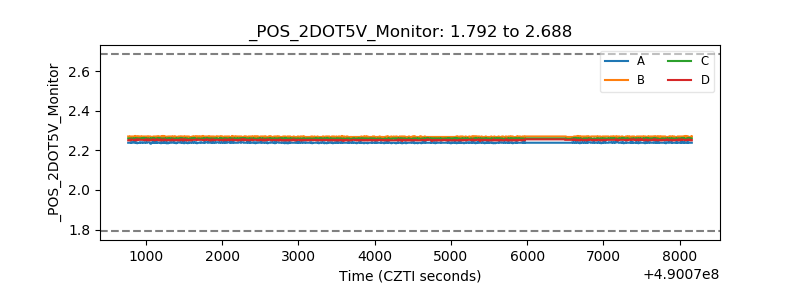 |
| +5 Volts monitor | 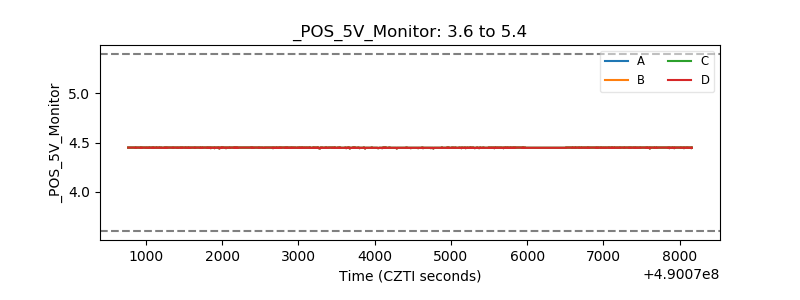 |
| _ROLL_ROT | 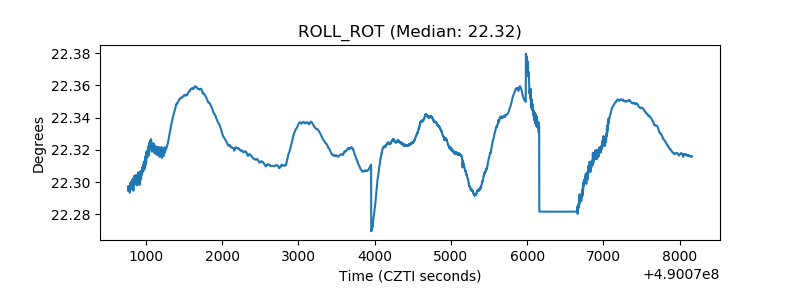 |
| _Roll_DEC | 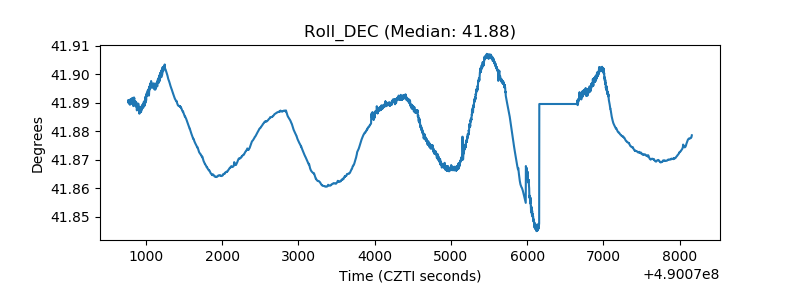 |
| _Roll_RA | 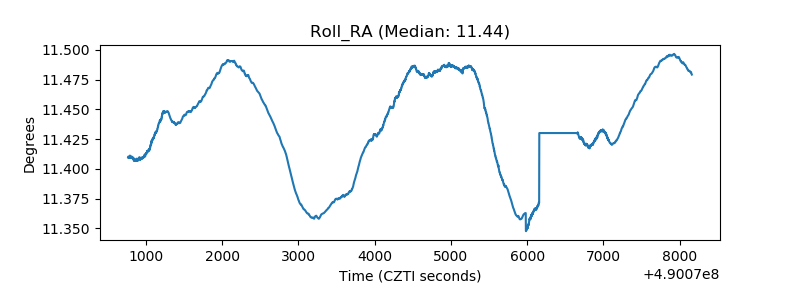 |
| Veto Counter | 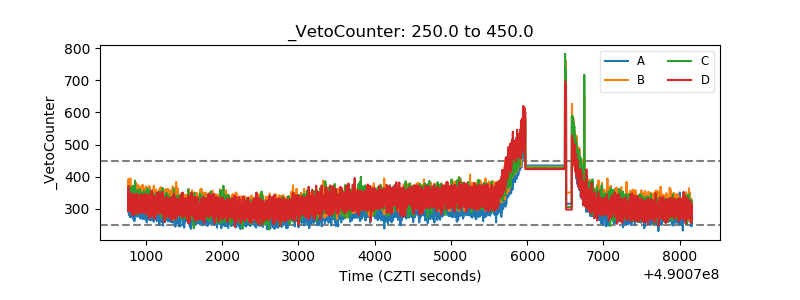 |