| Param | Original file | Final file |
|---|---|---|
| Filename | modeM0/AS1A13_003T01_9000006486_53152cztM0_level2.fits | modeM0/AS1A13_003T01_9000006486_53152cztM0_level2_quad_clean.evt |
| Size (bytes) | 539,064,000 | 76,999,680 |
| Size | 514.1 MB | 73.4 MB |
| Events in quadrant A | 3,103,728 | 541,591 |
| Events in quadrant B | 3,227,681 | 564,390 |
| Events in quadrant C | 9,727,212 | 322,444 |
| Events in quadrant D | 3,444,514 | 497,480 |
| Mode M9 | |||
|---|---|---|---|
| Quadrant | BADHDUFLAG | Total packets | Discarded packets |
| A | 0 | 11 | 0 |
| B | 0 | 11 | 0 |
| C | 0 | 11 | 0 |
| D | 0 | 11 | 0 |
| Mode M0 | |||
|---|---|---|---|
| Quadrant | BADHDUFLAG | Total packets | Discarded packets |
| A | 0 | 13723 | 1 |
| B | 0 | 14189 | 1 |
| C | 0 | 32886 | 5 |
| D | 0 | 14481 | 1 |
| Mode SS | |||
|---|---|---|---|
| Quadrant | BADHDUFLAG | Total packets | Discarded packets |
| A | 0 | 118 | 0 |
| B | 0 | 118 | 0 |
| C | 0 | 118 | 0 |
| D | 0 | 118 | 0 |
| Quadrant | Total seconds | Saturated seconds | Saturation percentage |
|---|---|---|---|
| A | 5801 | 184 | 3.171867% |
| B | 5802 | 350 | 6.032403% |
| C | 5801 | 2556 | 44.061369% |
| D | 5801 | 94 | 1.620410% |
Noise dominated data is calculated using 1-second bins in cleaned event files. If a bin has >2000 counts, and if more than 50% of those come from <1% of pixels, then it is considered to be noise-dominated and hence unusable.
| Quadrant | # 1 sec bins | Bins with >0 counts | Bins with >2000 counts | High rate bins dominated by noise | Noise dominated (total time) | Noise dominated (detector-on time) | Marked lightcurve |
|---|---|---|---|---|---|---|---|
| A | 6885 | 5800 | 162 | 162 | 2.35% | 2.79% | 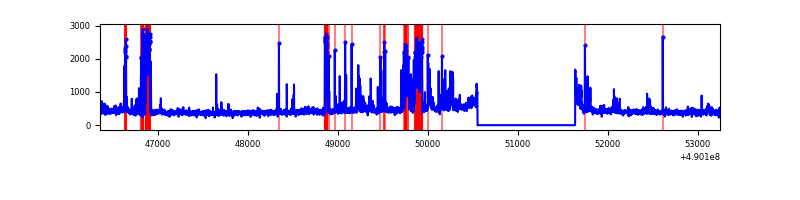 |
| B | 6887 | 5802 | 168 | 168 | 2.44% | 2.90% | 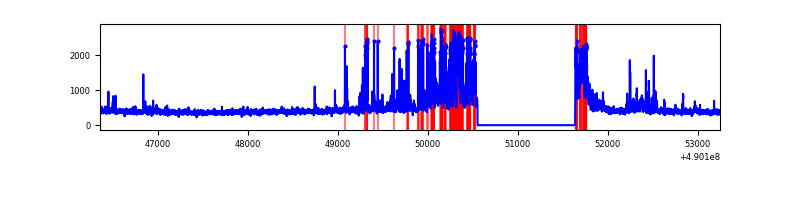 |
| C | 6885 | 5800 | 2636 | 2636 | 38.29% | 45.45% | 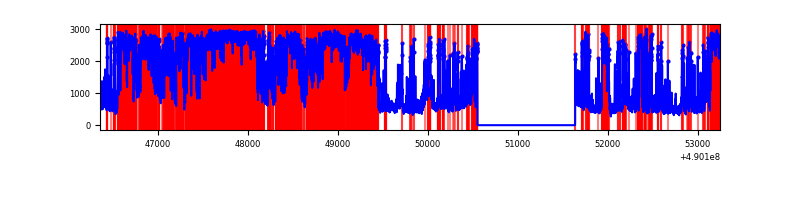 |
| D | 6886 | 5802 | 87 | 87 | 1.26% | 1.50% | 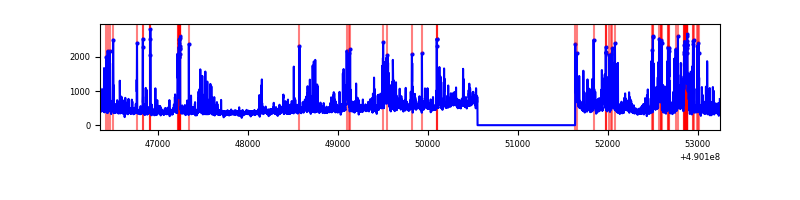 |
Top three noisy pixels from each quadrant. If the there are fewer than three noisy pixels in the level2.evt file, extra rows are filled as -1
| Pixel properties | Quadrant properties | ||||||
|---|---|---|---|---|---|---|---|
| Quadrant | DetID | PixID | Counts | Sigma | Mean | Median | Sigma |
| A | 15 | 174 | 282767 | 1920.55 | 587 | 572 | 146.9 |
| A | 12 | 115 | 250088 | 1698.14 | 587 | 572 | 146.9 |
| A | 0 | 8 | 54149 | 364.63 | 587 | 572 | 146.9 |
| B | 2 | 249 | 544788 | 4446.42 | 574 | 553 | 122.4 |
| B | 1 | 255 | 220144 | 1794.07 | 574 | 553 | 122.4 |
| B | 4 | 81 | 58344 | 472.16 | 574 | 553 | 122.4 |
| C | 1 | 241 | 3089329 | 24462.44 | 455 | 451 | 126.3 |
| C | 0 | 240 | 2736379 | 21667.24 | 455 | 451 | 126.3 |
| C | 15 | 224 | 1141082 | 9033.25 | 455 | 451 | 126.3 |
| D | 13 | 170 | 198755 | 1221.58 | 568 | 542 | 162.3 |
| D | 15 | 125 | 171579 | 1054.09 | 568 | 542 | 162.3 |
| D | 8 | 176 | 160935 | 988.5 | 568 | 542 | 162.3 |
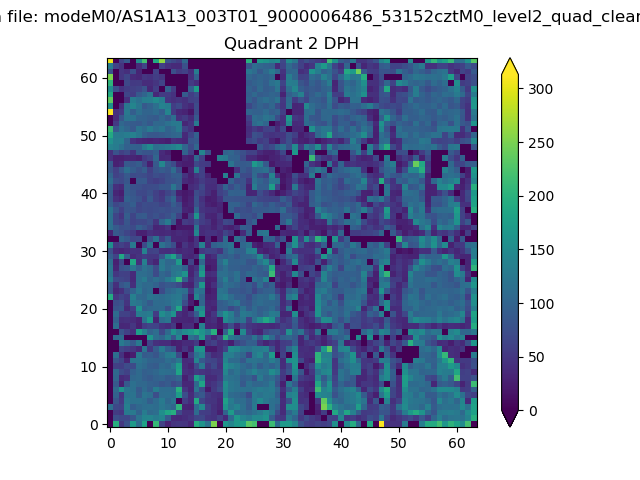
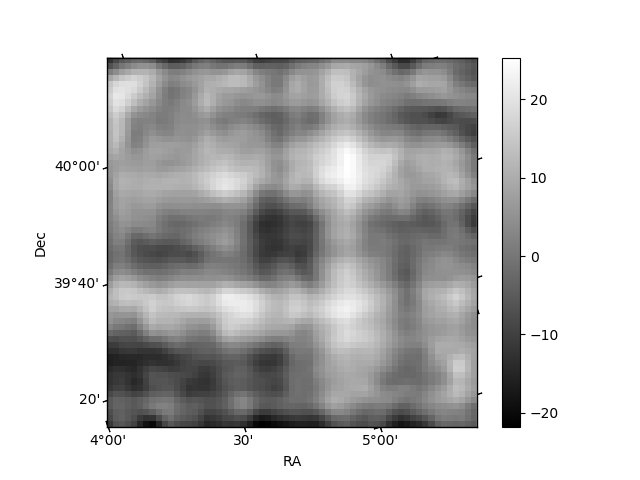
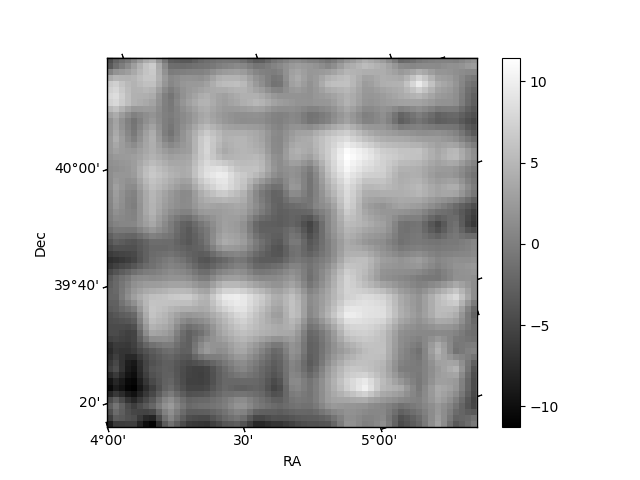
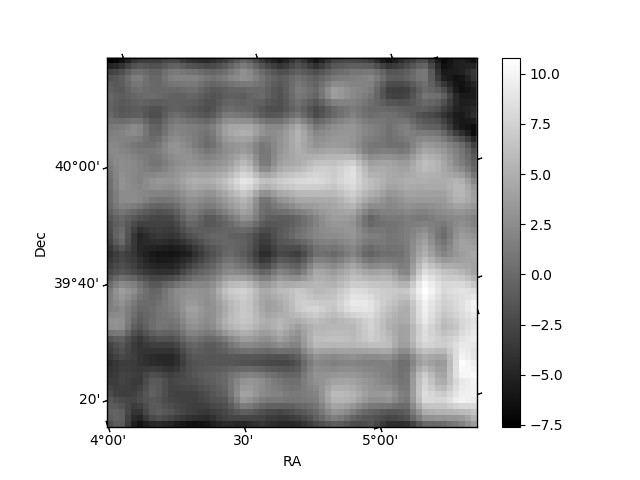
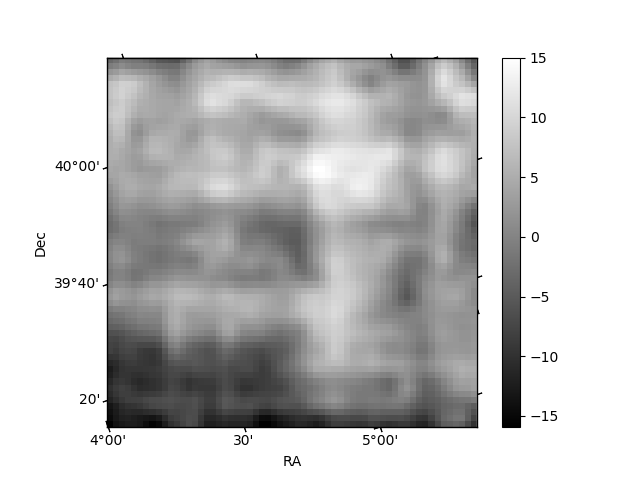
Histogram calculated using DETX and DETY for each event in the final _common_clean file
| Quadrant A | 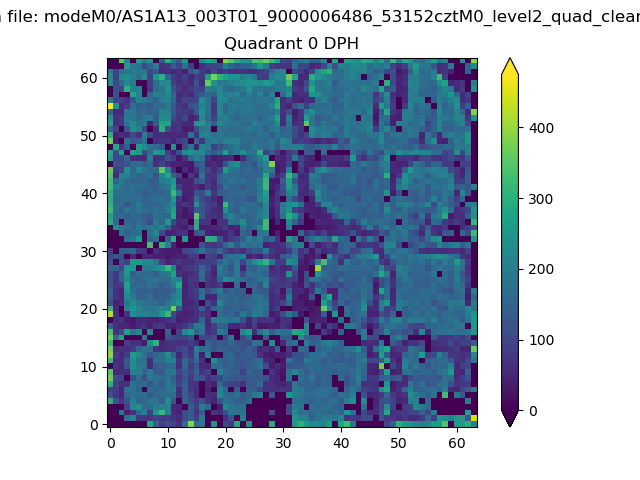 |
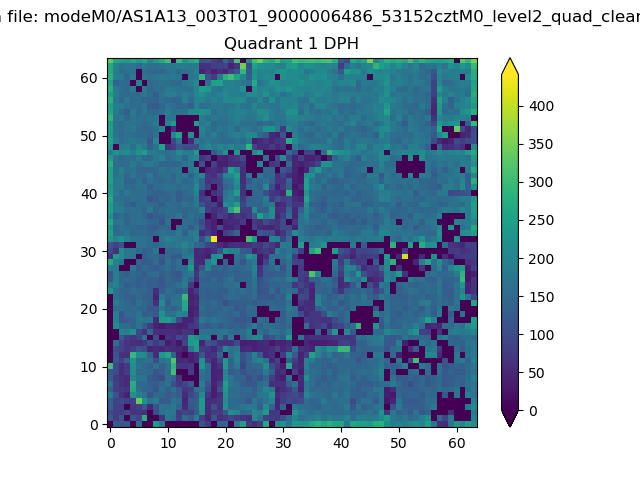 |
Quadrant B |
|---|---|---|---|
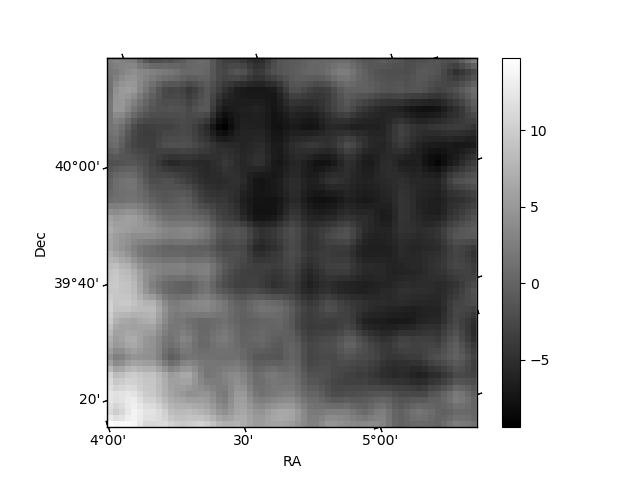
| Quadrant D | 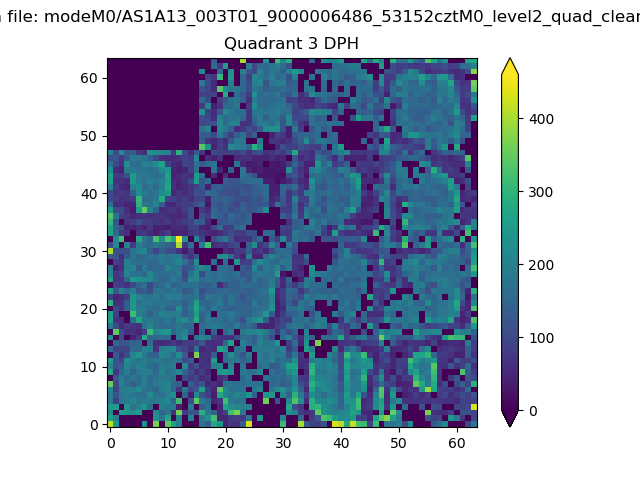 |
 |
Quadrant C |
| Plot type | Count rate plots | Images |
|---|---|---|
| Comparison with Poisson distribution Blue bars denote a histogram of data divided into 1 sec bins. Red curve is a Poisson curve with rate = median count rate of data. |
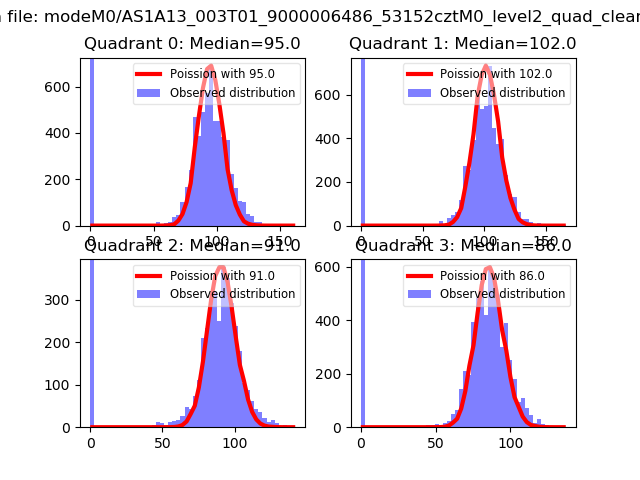 |
 |
| Quadrant-wise count rates Data is divided into 100 sec bins |
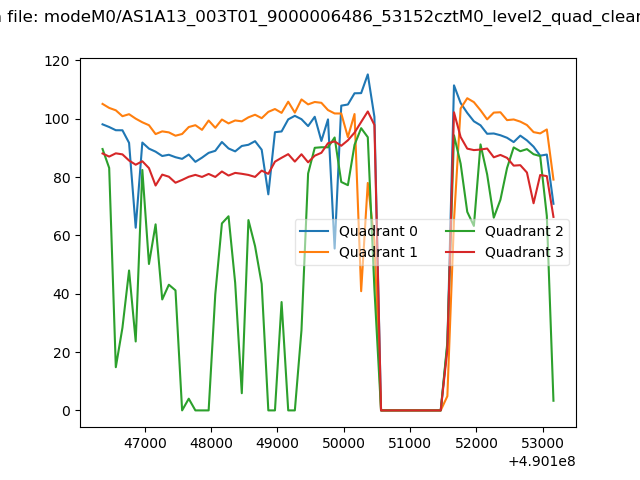 |
|
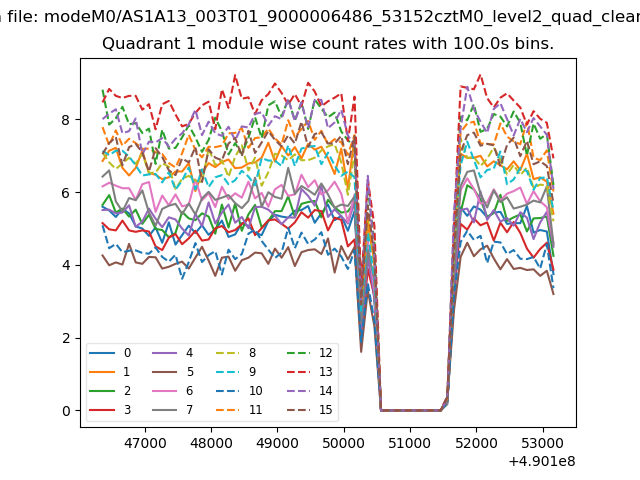
| Module-wise count rates for Quadrant A Data is divided into 100 sec bins |
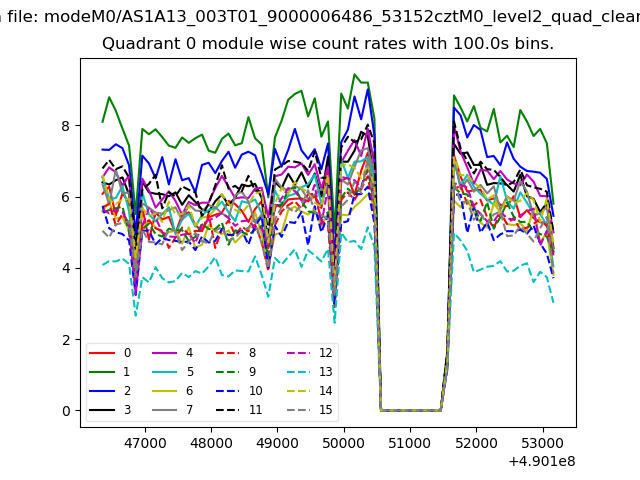 |
 |
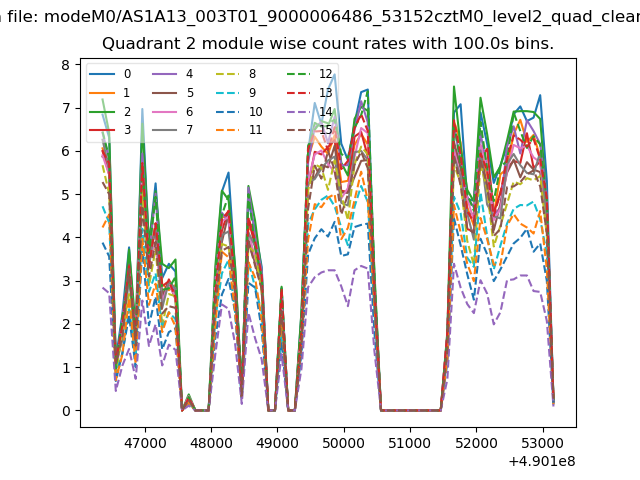
| Module-wise count rates for Quadrant B Data is divided into 100 sec bins |
 |
 |
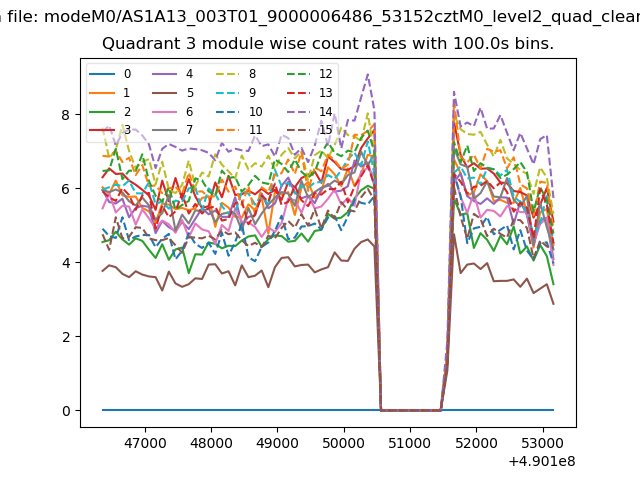
| Module-wise count rates for Quadrant C Data is divided into 100 sec bins |
 |
 |
| Module-wise count rates for Quadrant D Data is divided into 100 sec bins |
 |
 |
| Parameter | Plot |
|---|---|
| CZT HV Monitor | 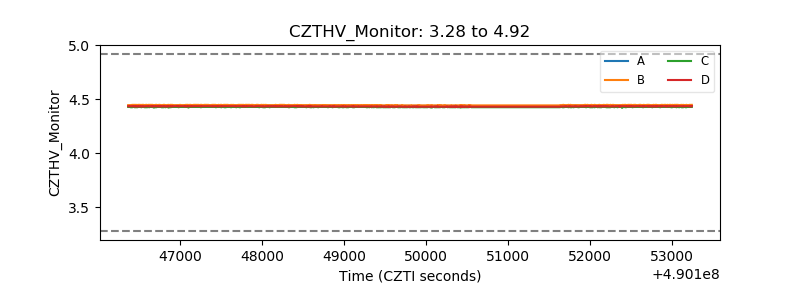 |
| D_VDD | 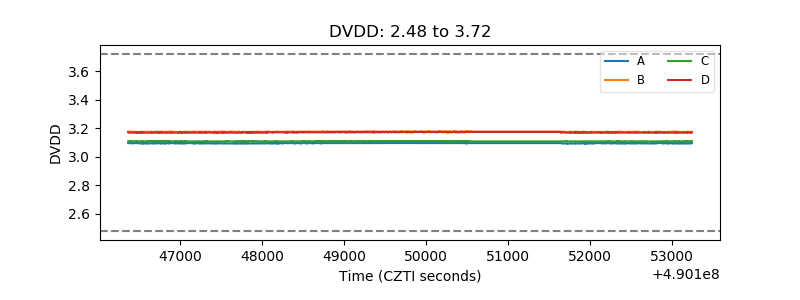 |
| Temperature 1 | 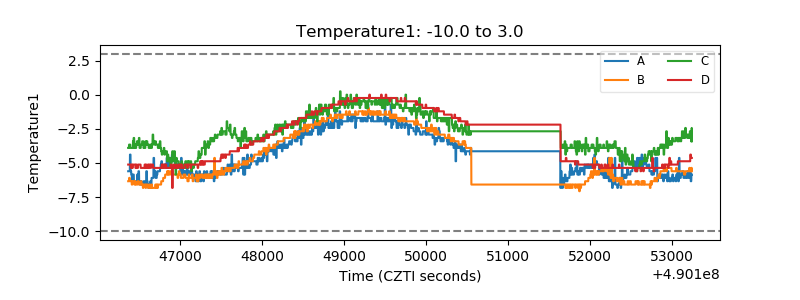 |
| Veto HV Monitor | 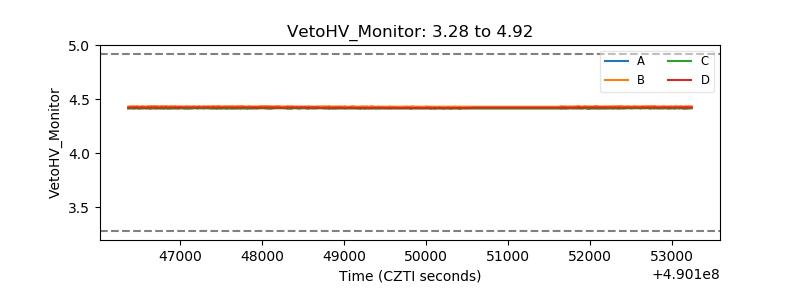 |
| Veto LLD | 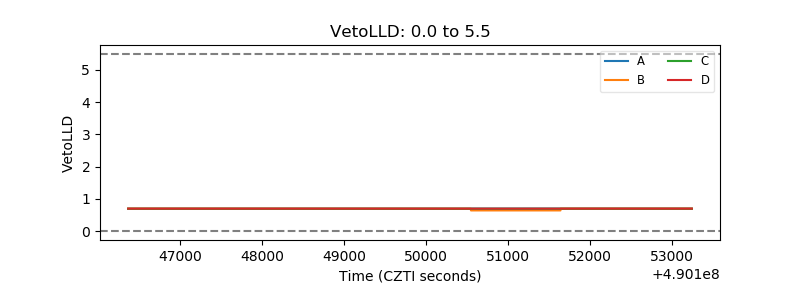 |
| Alpha Counter | 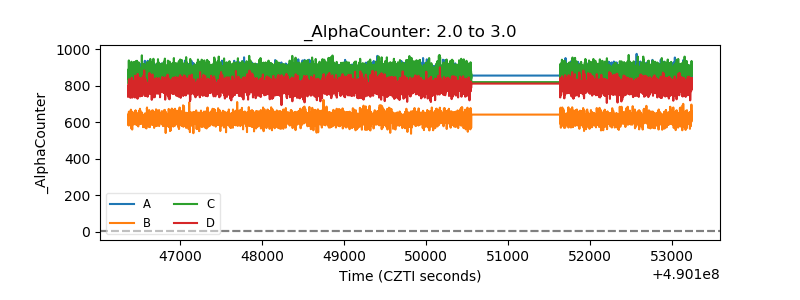 |
| _CPM_Rate | 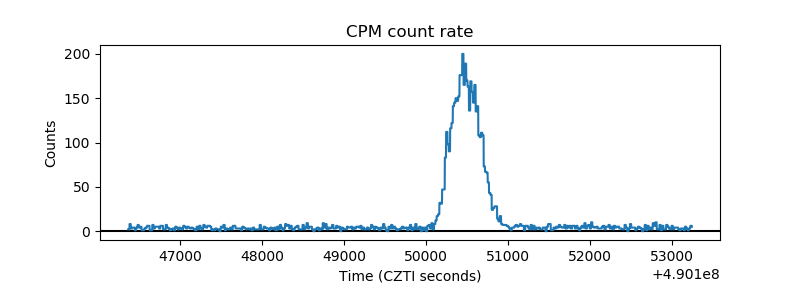 |
| CZT Counter | 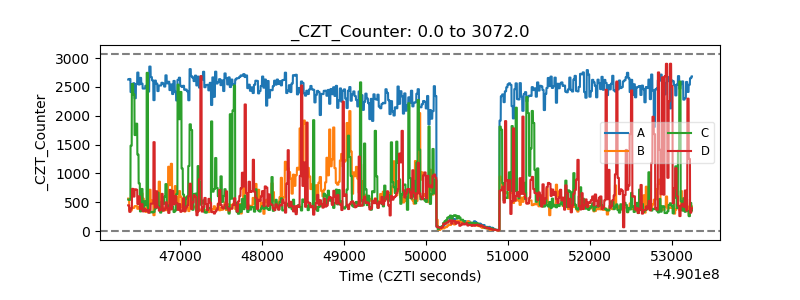 |
| +2.5 Volts monitor | 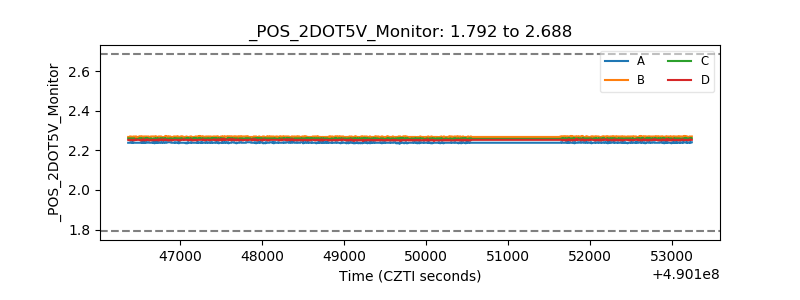 |
| +5 Volts monitor | 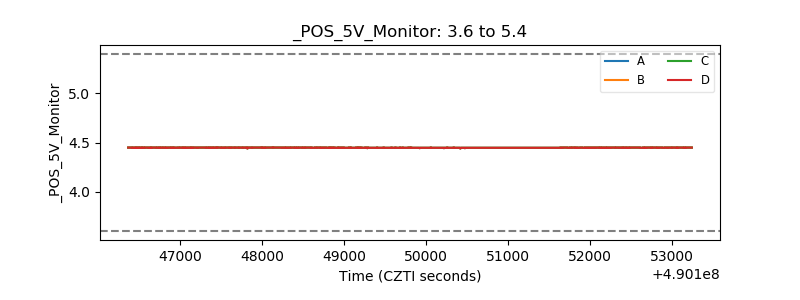 |
| _ROLL_ROT | 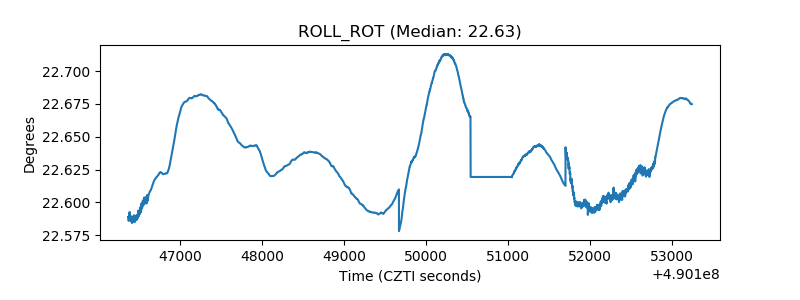 |
| _Roll_DEC | 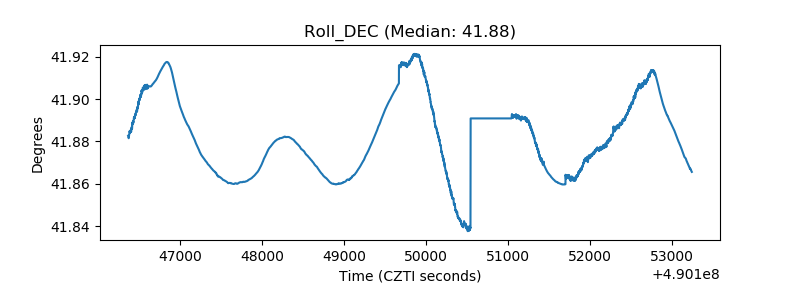 |
| _Roll_RA | 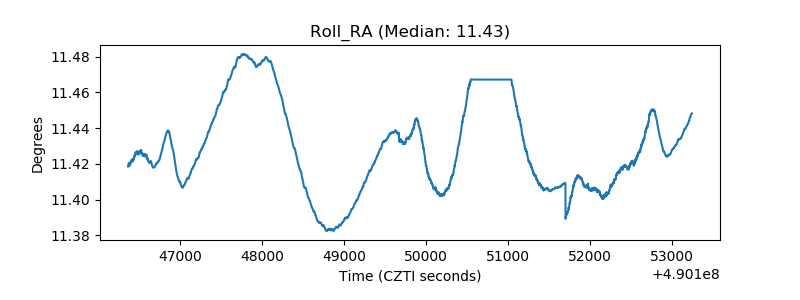 |
| Veto Counter | 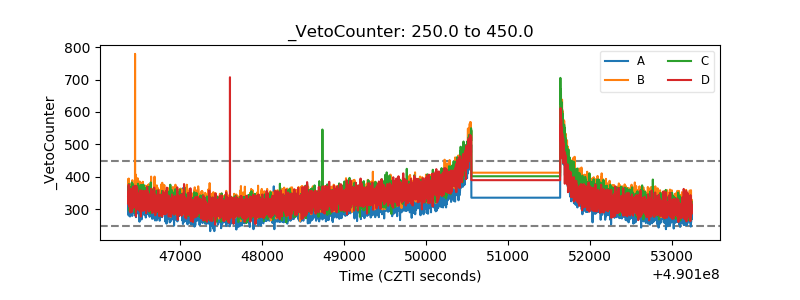 |