| Param | Original file | Final file |
|---|---|---|
| Filename | modeM0/AS1A13_003T01_9000006486_53156cztM0_level2.fits | modeM0/AS1A13_003T01_9000006486_53156cztM0_level2_quad_clean.evt |
| Size (bytes) | 767,122,560 | 94,343,040 |
| Size | 731.6 MB | 90.0 MB |
| Events in quadrant A | 5,134,089 | 649,177 |
| Events in quadrant B | 7,154,265 | 651,441 |
| Events in quadrant C | 11,272,208 | 440,603 |
| Events in quadrant D | 4,269,244 | 605,374 |
| Mode M0 | |||
|---|---|---|---|
| Quadrant | BADHDUFLAG | Total packets | Discarded packets |
| A | 0 | 20430 | 0 |
| B | 0 | 26433 | 0 |
| C | 0 | 38604 | 0 |
| D | 0 | 17952 | 0 |
| Mode SS | |||
|---|---|---|---|
| Quadrant | BADHDUFLAG | Total packets | Discarded packets |
| A | 0 | 146 | 0 |
| B | 0 | 146 | 0 |
| C | 0 | 146 | 0 |
| D | 0 | 146 | 0 |
| Quadrant | Total seconds | Saturated seconds | Saturation percentage |
|---|---|---|---|
| A | 7321 | 395 | 5.395438% |
| B | 7322 | 978 | 13.357006% |
| C | 7322 | 2559 | 34.949467% |
| D | 7322 | 108 | 1.475007% |
Noise dominated data is calculated using 1-second bins in cleaned event files. If a bin has >2000 counts, and if more than 50% of those come from <1% of pixels, then it is considered to be noise-dominated and hence unusable.
| Quadrant | # 1 sec bins | Bins with >0 counts | Bins with >2000 counts | High rate bins dominated by noise | Noise dominated (total time) | Noise dominated (detector-on time) | Marked lightcurve |
|---|---|---|---|---|---|---|---|
| A | 7321 | 7321 | 369 | 369 | 5.04% | 5.04% | 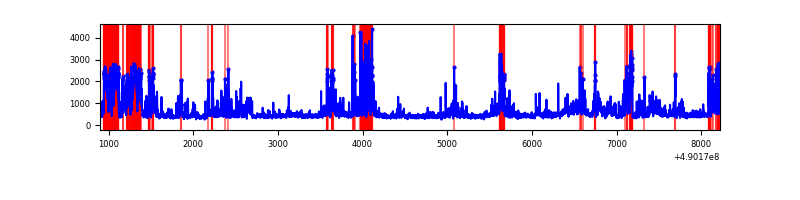 |
| B | 7322 | 7322 | 724 | 724 | 9.89% | 9.89% | 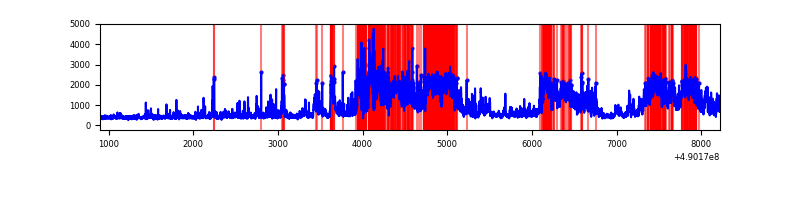 |
| C | 7322 | 7322 | 2407 | 2407 | 32.87% | 32.87% | 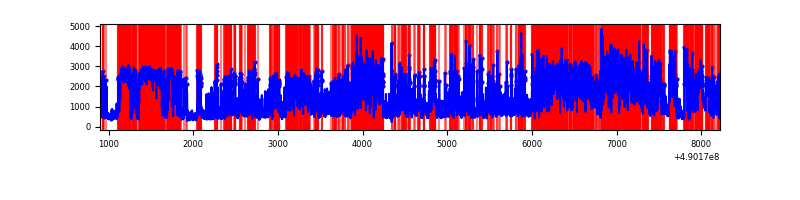 |
| D | 7322 | 7322 | 119 | 119 | 1.63% | 1.63% | 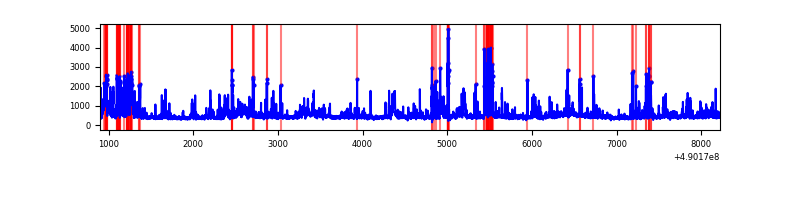 |
Top three noisy pixels from each quadrant. If the there are fewer than three noisy pixels in the level2.evt file, extra rows are filled as -1
| Pixel properties | Quadrant properties | ||||||
|---|---|---|---|---|---|---|---|
| Quadrant | DetID | PixID | Counts | Sigma | Mean | Median | Sigma |
| A | 12 | 3 | 1022904 | 5540.45 | 737 | 717 | 184.5 |
| A | 0 | 8 | 482579 | 2611.79 | 737 | 717 | 184.5 |
| A | 3 | 62 | 157152 | 847.91 | 737 | 717 | 184.5 |
| B | 10 | 254 | 3470701 | 22505.44 | 716 | 693 | 154.2 |
| B | 2 | 249 | 401359 | 2598.6 | 716 | 693 | 154.2 |
| B | 4 | 81 | 132748 | 856.47 | 716 | 693 | 154.2 |
| C | 1 | 241 | 3927731 | 22921.09 | 617 | 611 | 171.3 |
| C | 15 | 157 | 1793947 | 10467.01 | 617 | 611 | 171.3 |
| C | 15 | 224 | 1620599 | 9455.25 | 617 | 611 | 171.3 |
| D | 8 | 176 | 315233 | 1546.34 | 717 | 684 | 203.4 |
| D | 12 | 3 | 208847 | 1023.34 | 717 | 684 | 203.4 |
| D | 10 | 172 | 164208 | 803.89 | 717 | 684 | 203.4 |
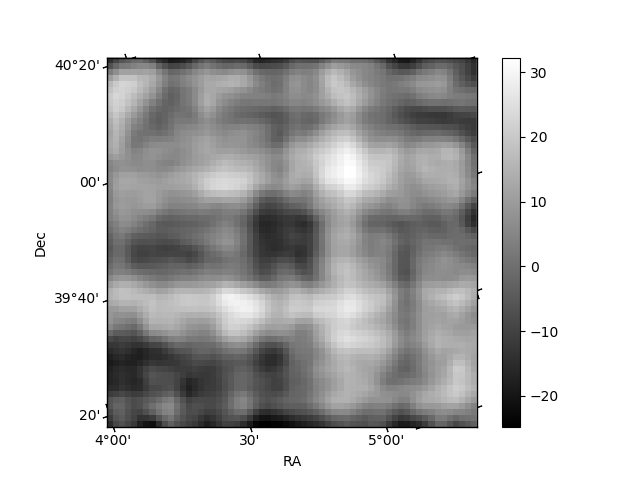
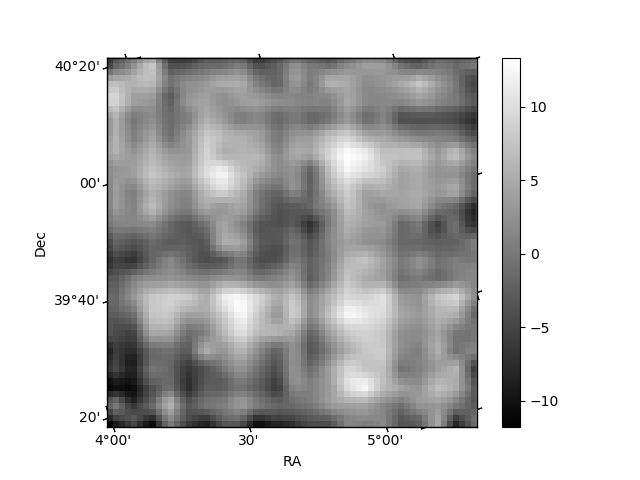
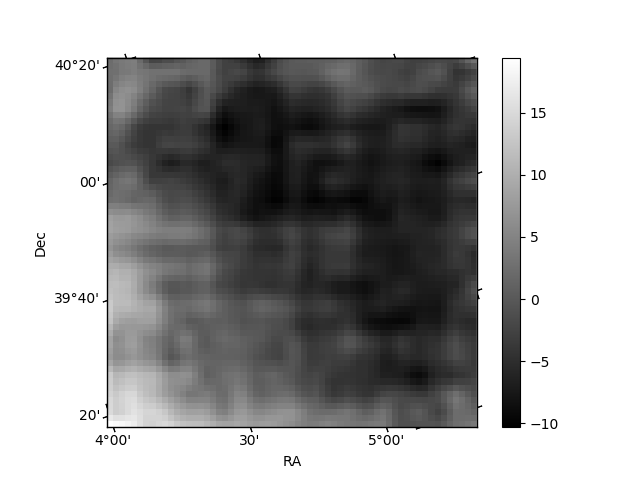
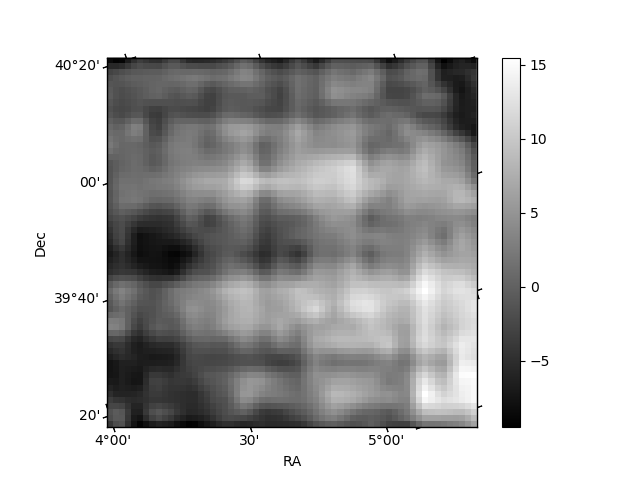
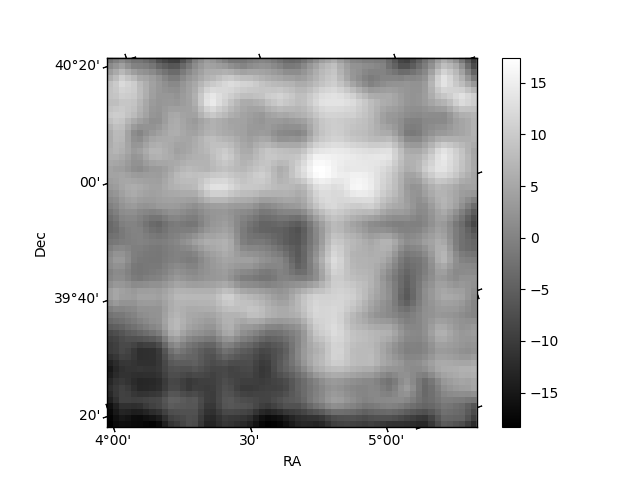
Histogram calculated using DETX and DETY for each event in the final _common_clean file
| Quadrant A | 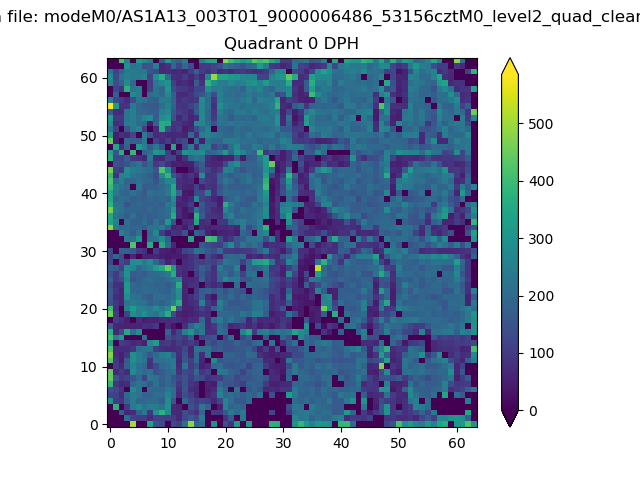 |
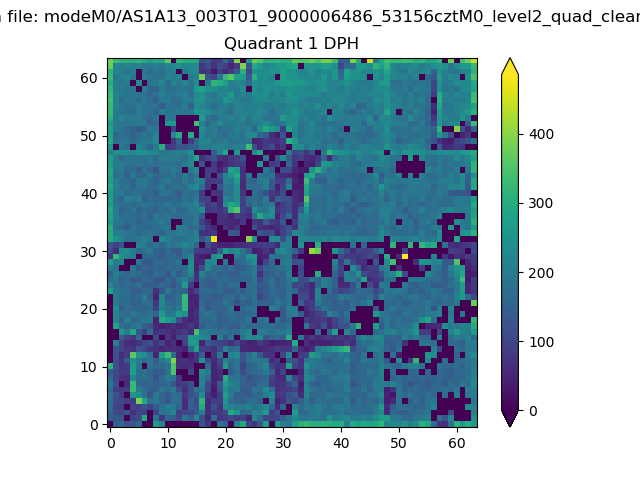 |
Quadrant B |
|---|---|---|---|
| Quadrant D | 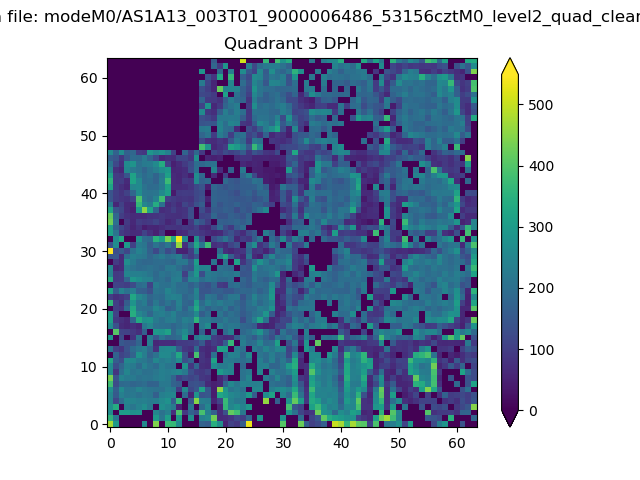 |
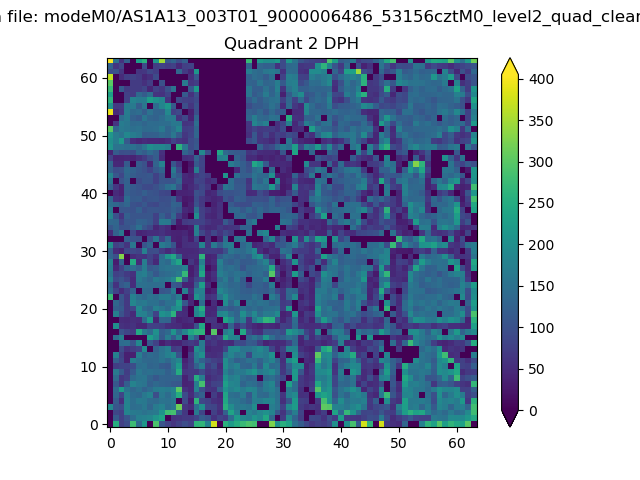 |
Quadrant C |
| Plot type | Count rate plots | Images |
|---|---|---|
| Comparison with Poisson distribution Blue bars denote a histogram of data divided into 1 sec bins. Red curve is a Poisson curve with rate = median count rate of data. |
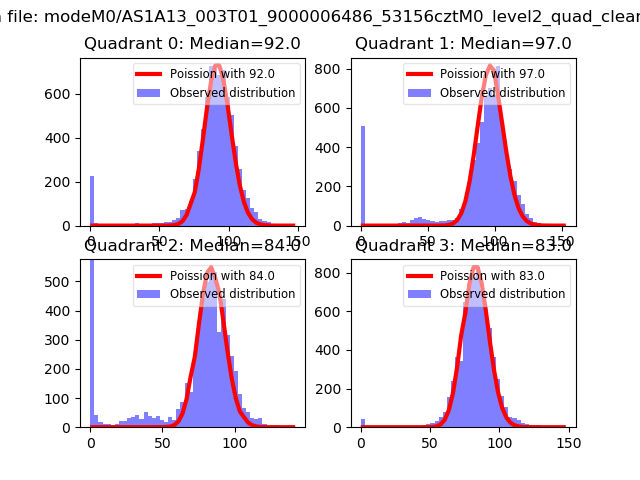 |
 |
| Quadrant-wise count rates Data is divided into 100 sec bins |
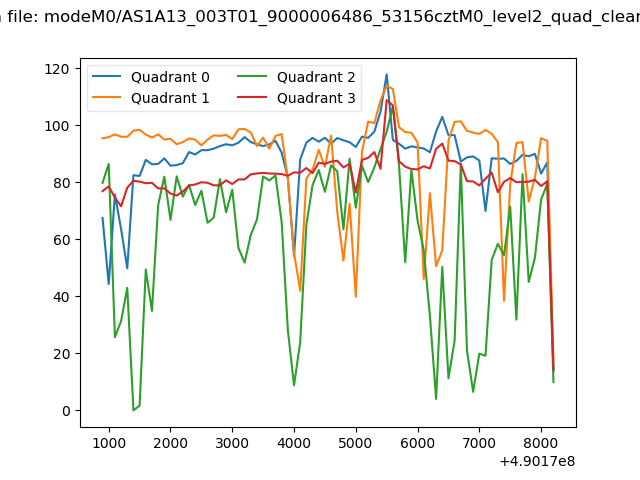 |
|
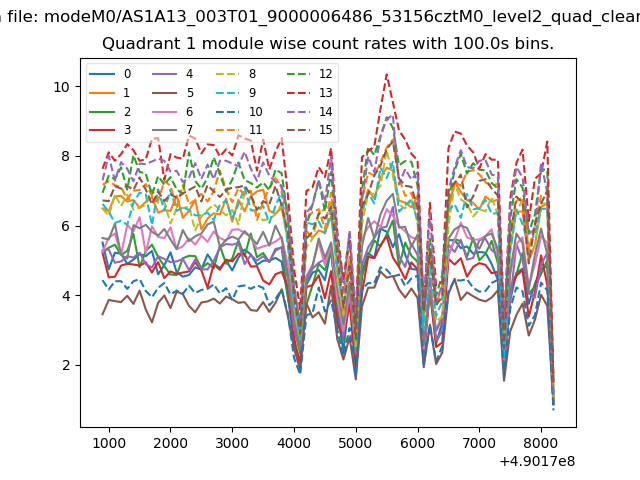
| Module-wise count rates for Quadrant A Data is divided into 100 sec bins |
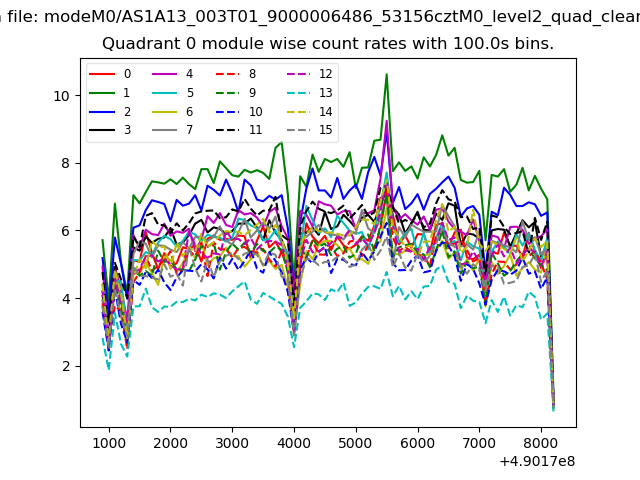 |
 |
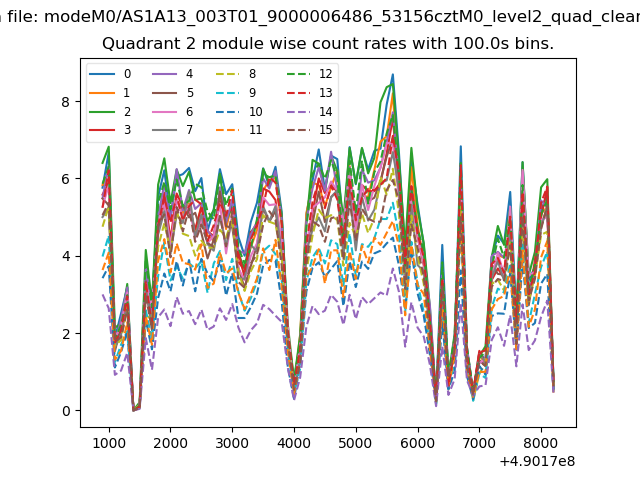
| Module-wise count rates for Quadrant B Data is divided into 100 sec bins |
 |
 |
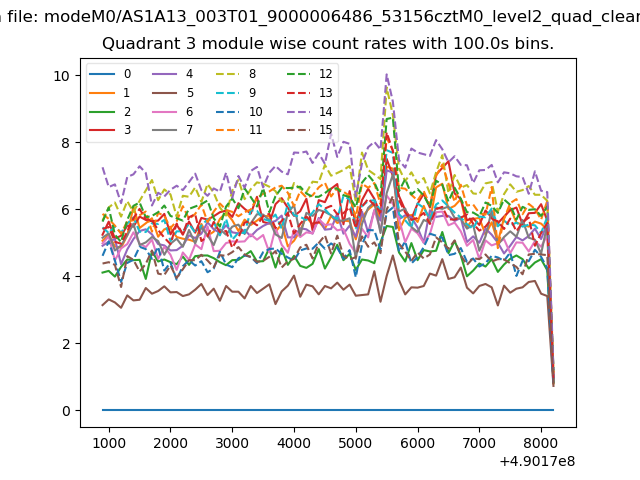
| Module-wise count rates for Quadrant C Data is divided into 100 sec bins |
 |
 |
| Module-wise count rates for Quadrant D Data is divided into 100 sec bins |
 |
 |
| Parameter | Plot |
|---|---|
| CZT HV Monitor | 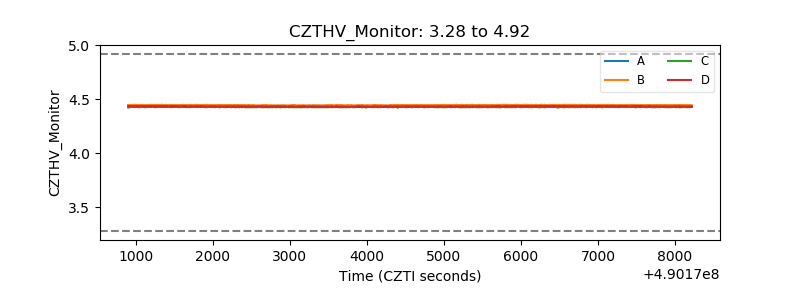 |
| D_VDD | 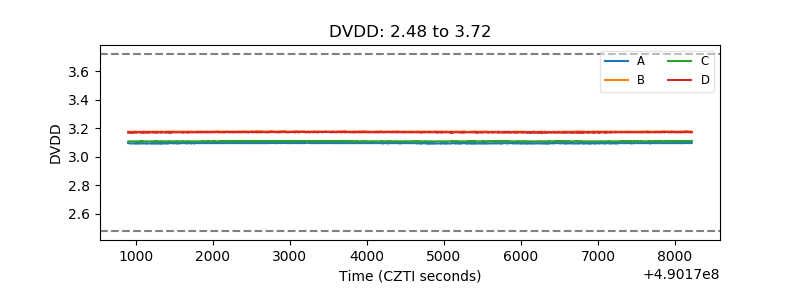 |
| Temperature 1 | 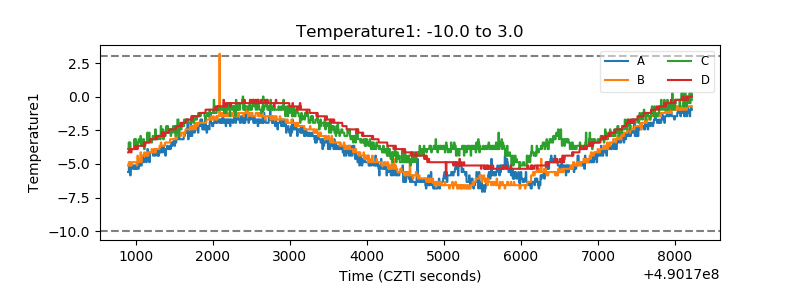 |
| Veto HV Monitor | 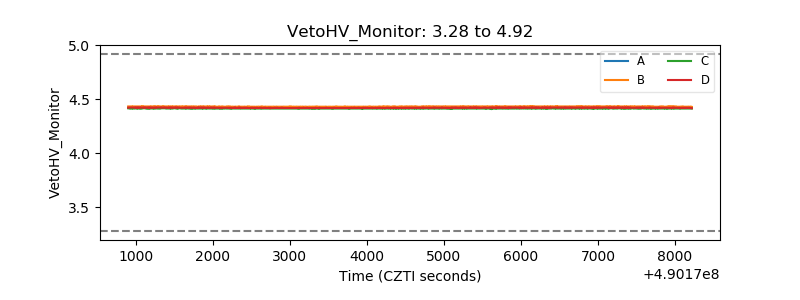 |
| Veto LLD | 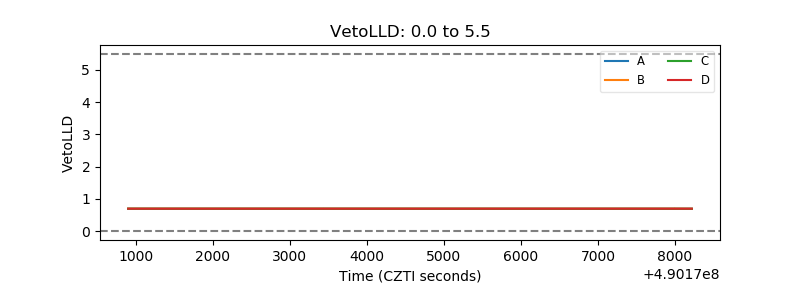 |
| Alpha Counter | 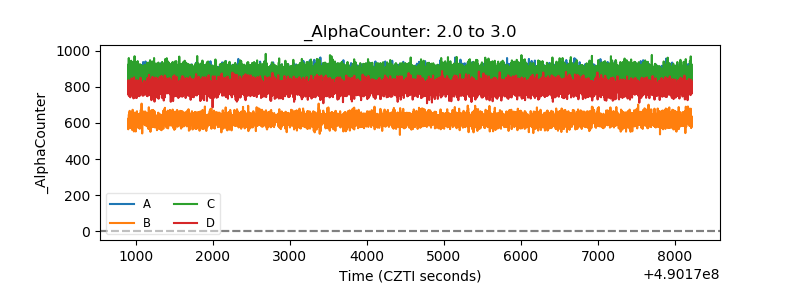 |
| _CPM_Rate | 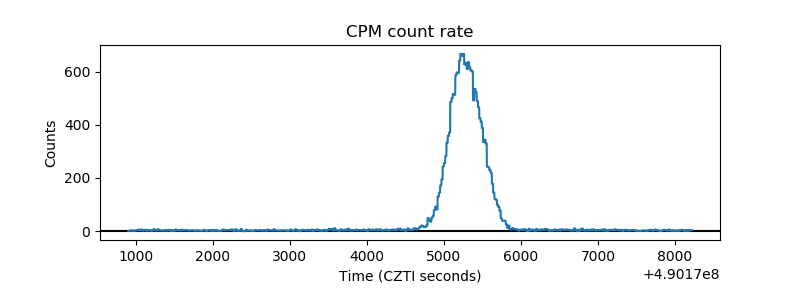 |
| CZT Counter | 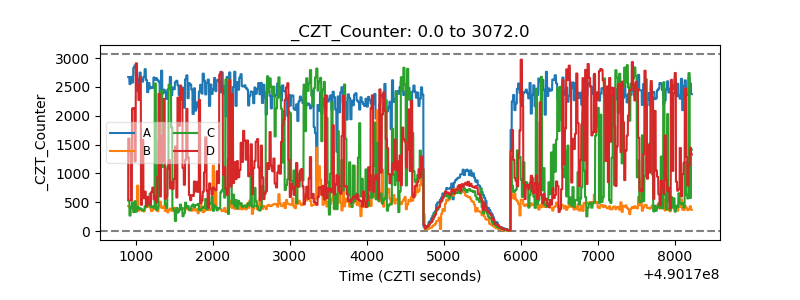 |
| +2.5 Volts monitor |  |
| +5 Volts monitor | 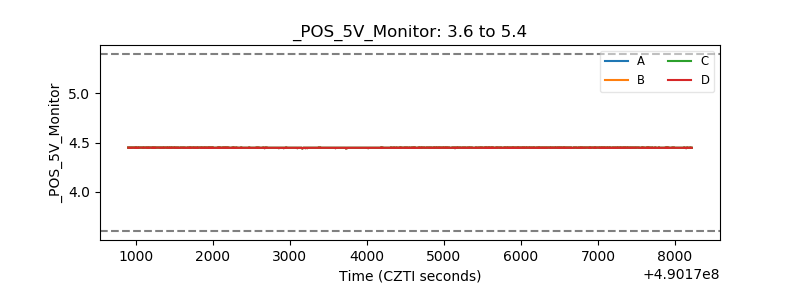 |
| _ROLL_ROT | 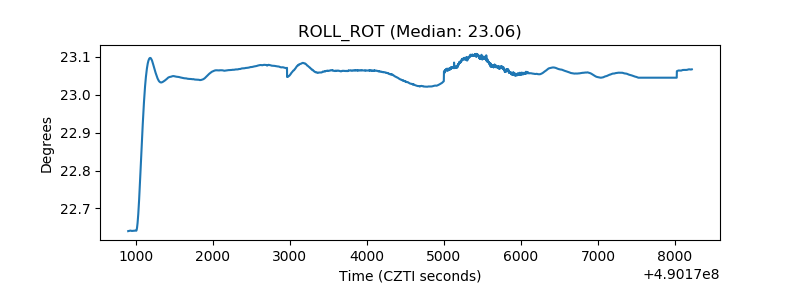 |
| _Roll_DEC | 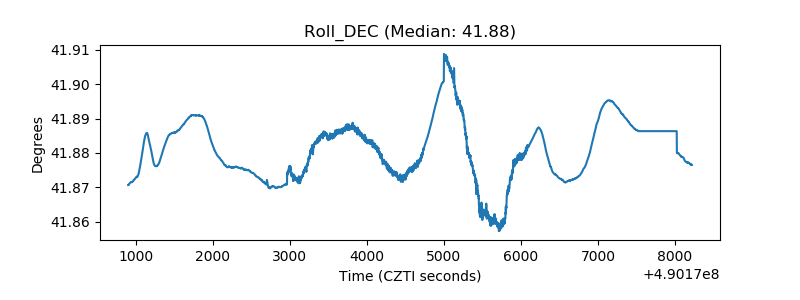 |
| _Roll_RA | 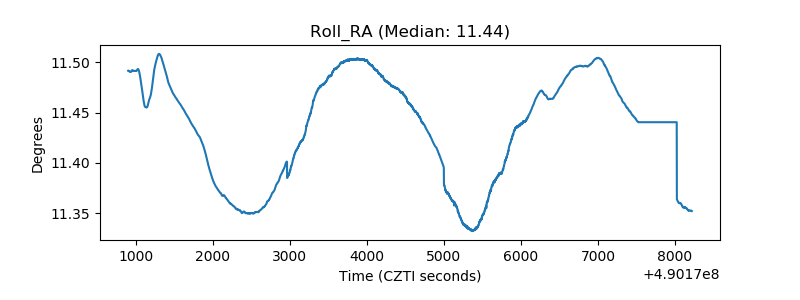 |
| Veto Counter | 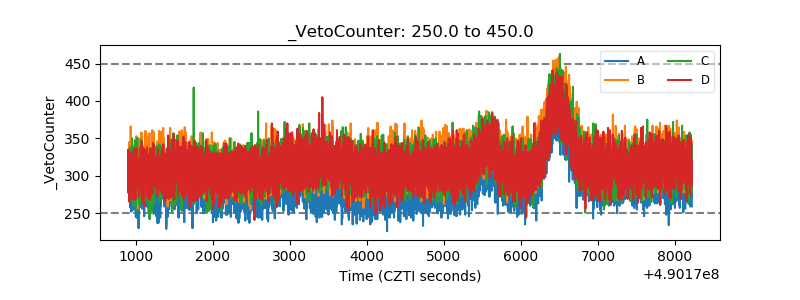 |