| Param | Original file | Final file |
|---|---|---|
| Filename | modeM0/AS1C09_011T07_9000006488cztM0_level2.fits | modeM0/AS1C09_011T07_9000006488cztM0_level2_quad_clean.evt |
| Size (bytes) | 5,110,672,320 | 2,746,987,200 |
| Size | 4.8 GB | 2.6 GB |
| Events in quadrant A | 20,306,052 | 5,207,202 |
| Events in quadrant B | 31,528,956 | 11,996,408 |
| Events in quadrant C | 27,907,898 | 7,851,428 |
| Events in quadrant D | 25,724,096 | 9,189,910 |
| Mode SS | |||
|---|---|---|---|
| Quadrant | BADHDUFLAG | Total packets | Discarded packets |
| A | 0 | 14488 | 0 |
| B | 0 | 14490 | 0 |
| C | 0 | 14484 | 0 |
| D | 0 | 14488 | 0 |
| Mode M9 | |||
|---|---|---|---|
| Quadrant | BADHDUFLAG | Total packets | Discarded packets |
| A | 0 | 910 | 0 |
| B | 0 | 911 | 0 |
| C | 0 | 911 | 0 |
| D | 0 | 911 | 0 |
| Mode M0 | |||
|---|---|---|---|
| Quadrant | BADHDUFLAG | Total packets | Discarded packets |
| A | 0 | 4373515 | 0 |
| B | 0 | 2076058 | 0 |
| C | 0 | 3312689 | 0 |
| D | 0 | 2778113 | 0 |
| Quadrant | Total seconds | Saturated seconds | Saturation percentage |
|---|---|---|---|
| A | 713909 | 436490 | 61.140846% |
| B | 714225 | 59198 | 8.288425% |
| C | 714156 | 203763 | 28.532001% |
| D | 714036 | 144416 | 20.225311% |
Noise dominated data is calculated using 1-second bins in cleaned event files. If a bin has >2000 counts, and if more than 50% of those come from <1% of pixels, then it is considered to be noise-dominated and hence unusable.
| Quadrant | # 1 sec bins | Bins with >0 counts | Bins with >2000 counts | High rate bins dominated by noise | Noise dominated (total time) | Noise dominated (detector-on time) | Marked lightcurve |
|---|---|---|---|---|---|---|---|
| A | 909697 | 690767 | 0 | 0 | 0.00% | 0.00% | 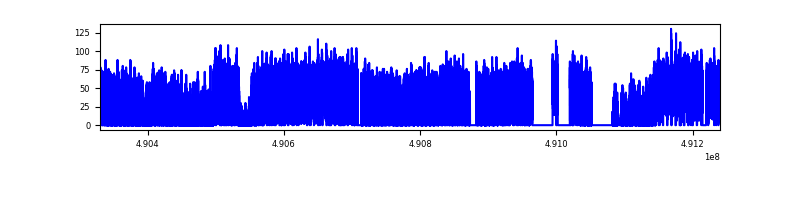 |
| B | 909697 | 713038 | 0 | 0 | 0.00% | 0.00% | 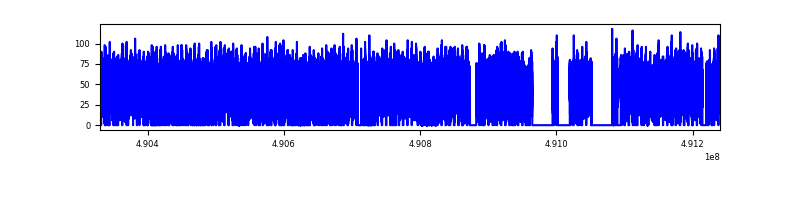 |
| C | 909697 | 709462 | 0 | 0 | 0.00% | 0.00% | 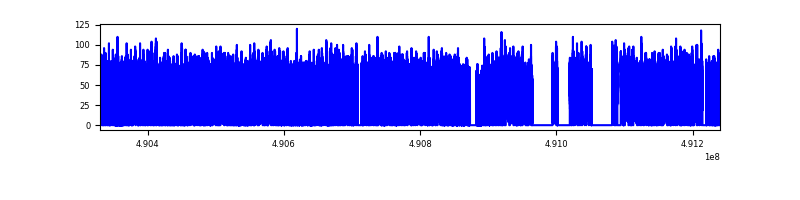 |
| D | 909697 | 704526 | 0 | 0 | 0.00% | 0.00% | 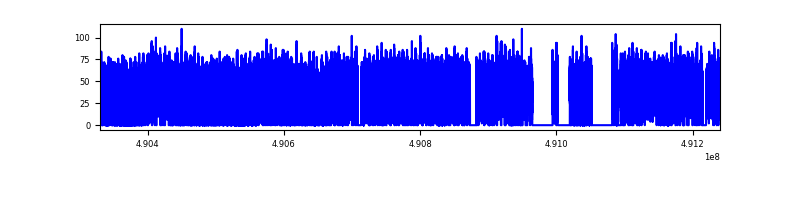 |
Top three noisy pixels from each quadrant. If the there are fewer than three noisy pixels in the level2.evt file, extra rows are filled as -1
| Pixel properties | Quadrant properties | ||||||
|---|---|---|---|---|---|---|---|
| Quadrant | DetID | PixID | Counts | Sigma | Mean | Median | Sigma |
| A | 14 | 188 | 23935 | 10.59 | 5366 | 4974 | 1790.8 |
| A | 9 | 255 | 20130 | 8.46 | 5366 | 4974 | 1790.8 |
| A | 14 | 204 | 19556 | 8.14 | 5366 | 4974 | 1790.8 |
| B | 2 | 9 | 37025 | 14.87 | 8398 | 7994 | 1952.0 |
| B | 2 | 8 | 33110 | 12.87 | 8398 | 7994 | 1952.0 |
| B | 9 | 173 | 26315 | 9.39 | 8398 | 7994 | 1952.0 |
| C | 2 | 31 | 22597 | 6.14 | 7508 | 6875 | 2561.6 |
| C | 3 | 203 | 22219 | 5.99 | 7508 | 6875 | 2561.6 |
| C | 15 | 175 | 22175 | 5.97 | 7508 | 6875 | 2561.6 |
| D | 6 | 218 | 34335 | 11.11 | 7400 | 6573 | 2498.4 |
| D | 15 | 11 | 25864 | 7.72 | 7400 | 6573 | 2498.4 |
| D | 6 | 207 | 24049 | 6.99 | 7400 | 6573 | 2498.4 |
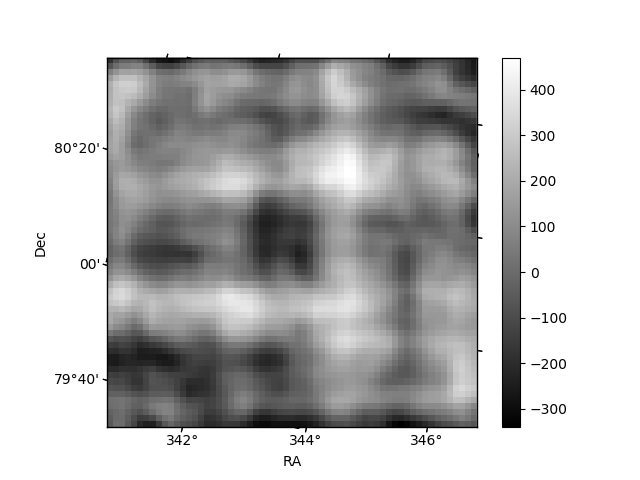
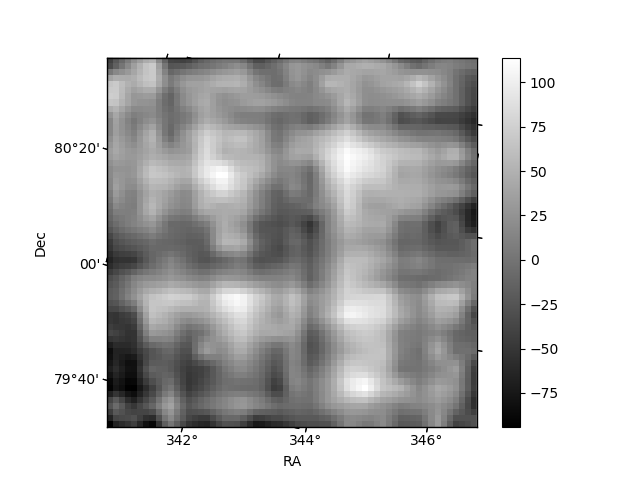
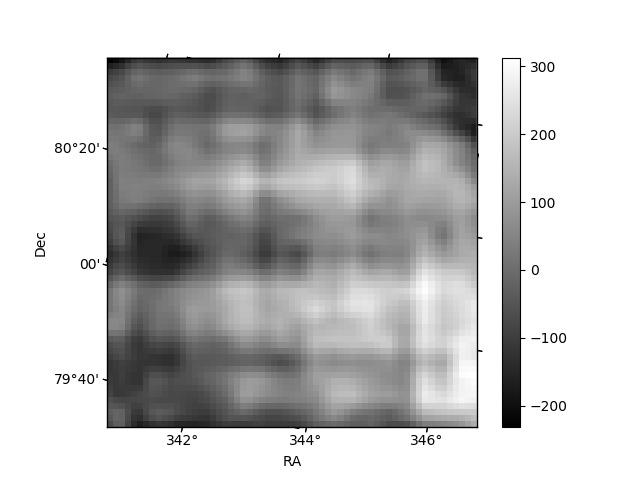
Histogram calculated using DETX and DETY for each event in the final _common_clean file
| Quadrant A | 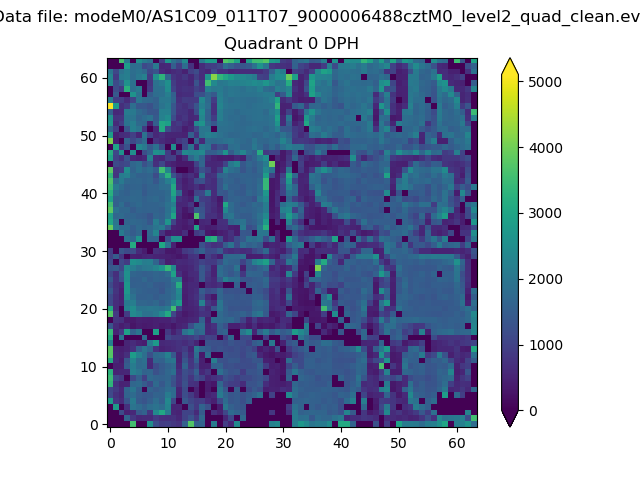 |
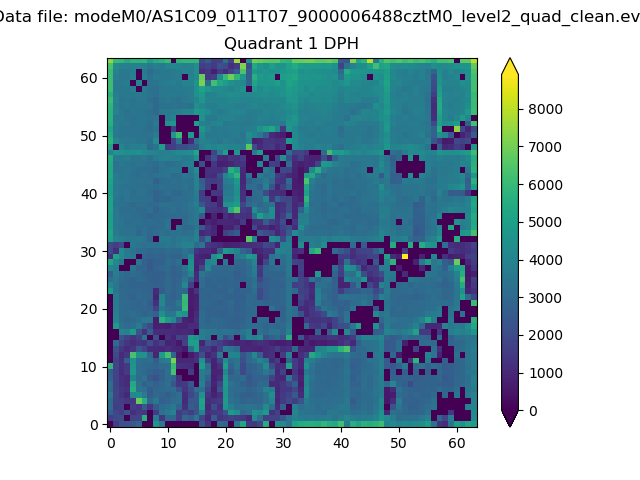 |
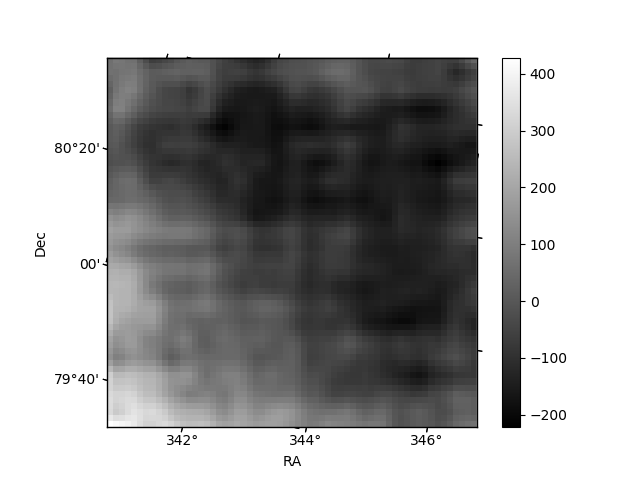
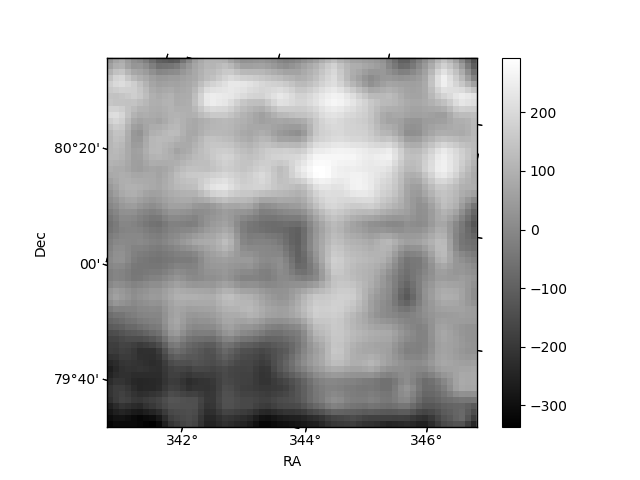
Quadrant B |
|---|---|---|---|
| Quadrant D | 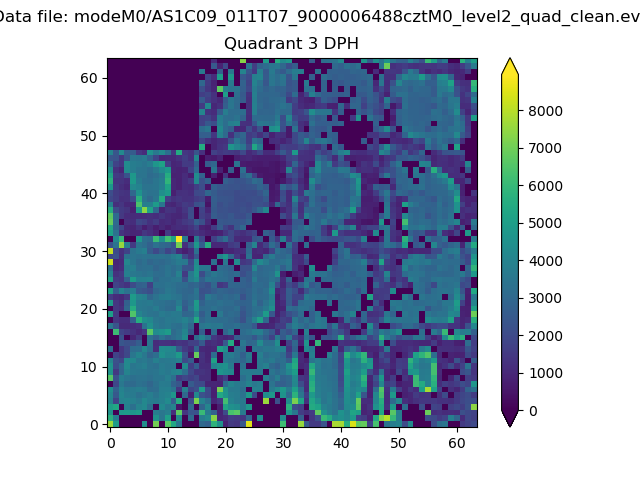 |
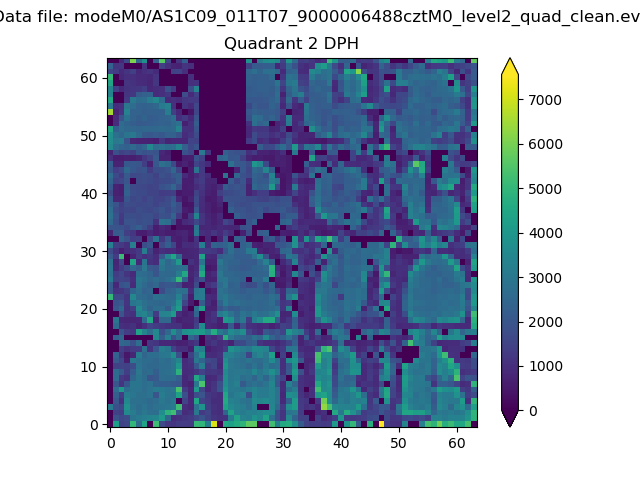 |
Quadrant C |
| Plot type | Count rate plots | Images |
|---|---|---|
| Comparison with Poisson distribution Blue bars denote a histogram of data divided into 1 sec bins. Red curve is a Poisson curve with rate = median count rate of data. |
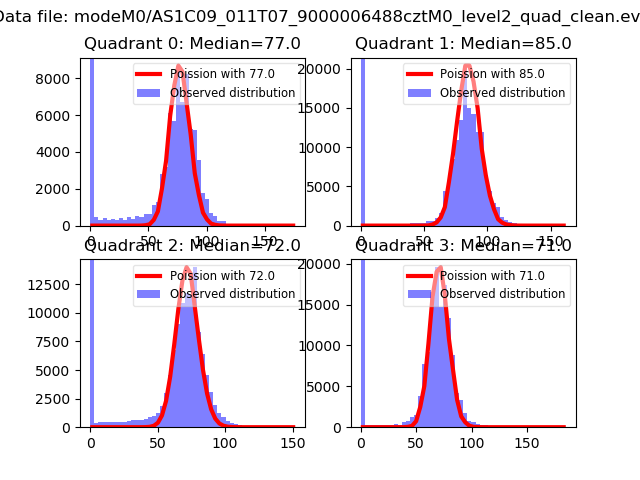 |
 |
| Quadrant-wise count rates Data is divided into 100 sec bins |
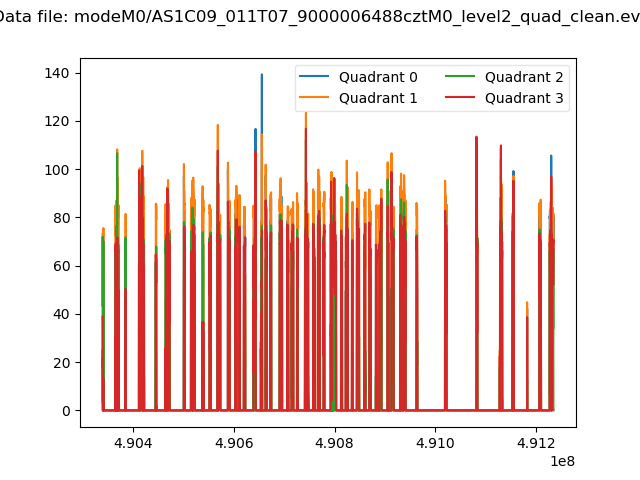 |
|
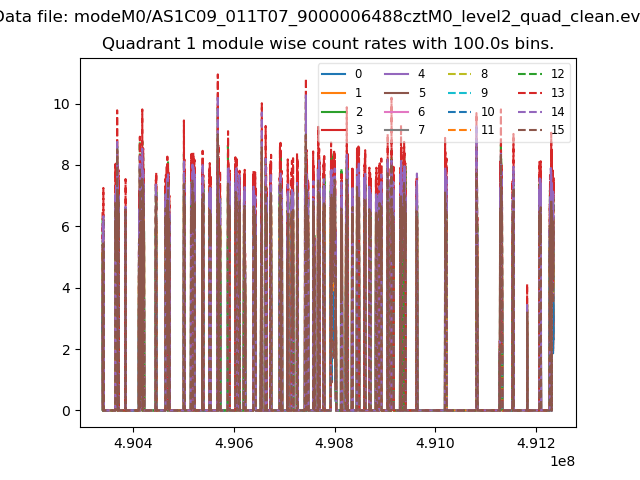
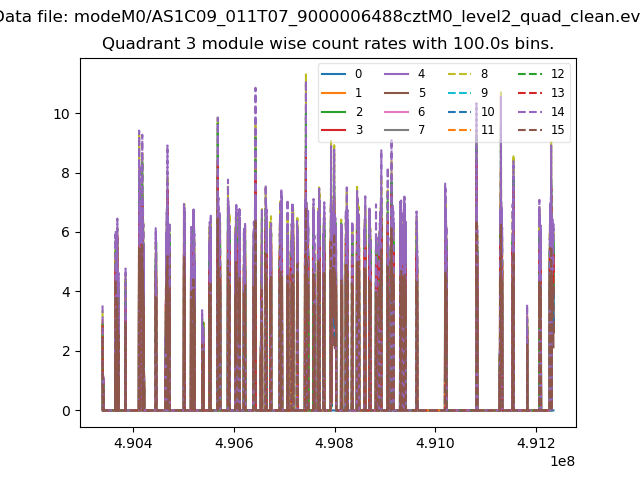
| Module-wise count rates for Quadrant A Data is divided into 100 sec bins |
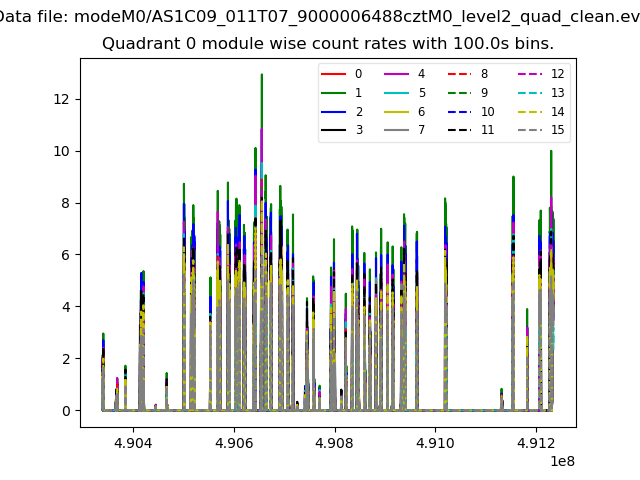 |
 |
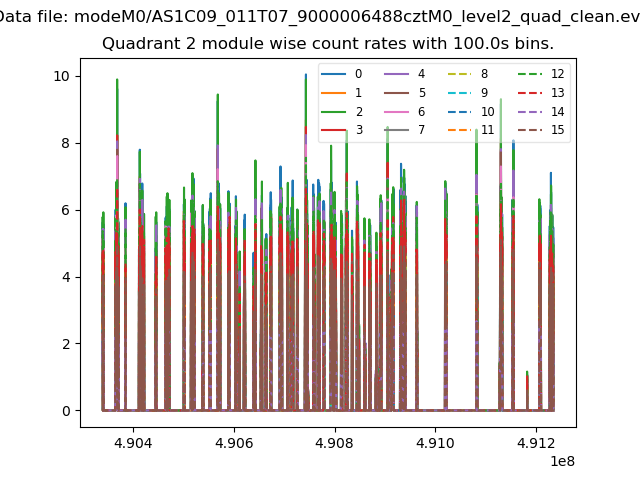
| Module-wise count rates for Quadrant B Data is divided into 100 sec bins |
 |
 |
| Module-wise count rates for Quadrant C Data is divided into 100 sec bins |
 |
 |
| Module-wise count rates for Quadrant D Data is divided into 100 sec bins |
 |
 |
| Parameter | Plot |
|---|---|
| CZT HV Monitor | 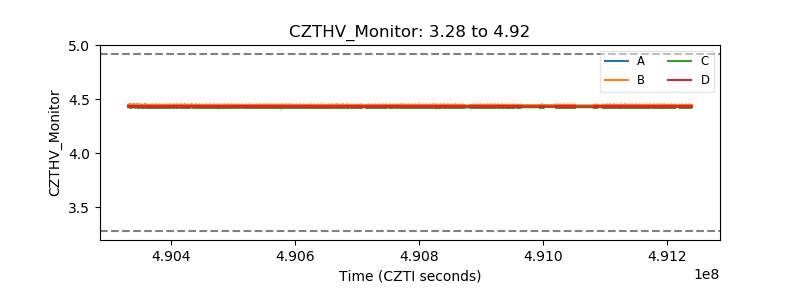 |
| D_VDD | 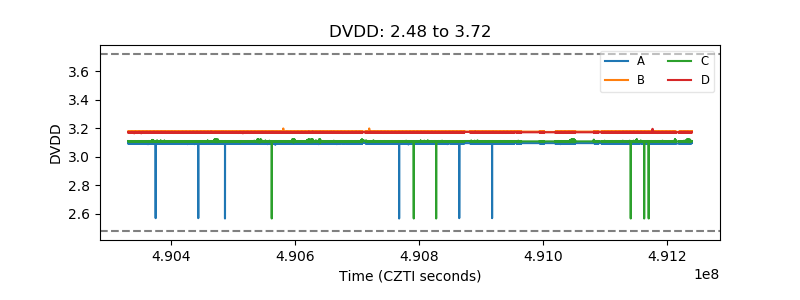 |
| Temperature 1 | 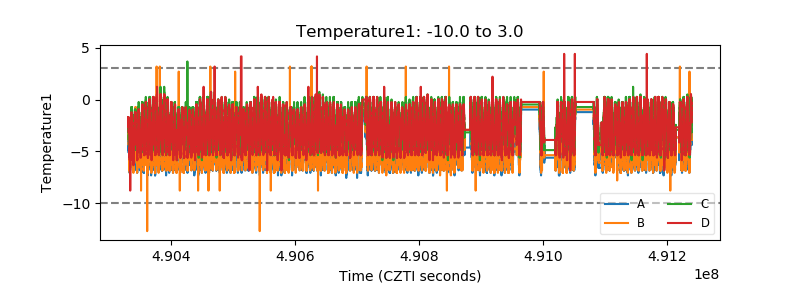 |
| Veto HV Monitor | 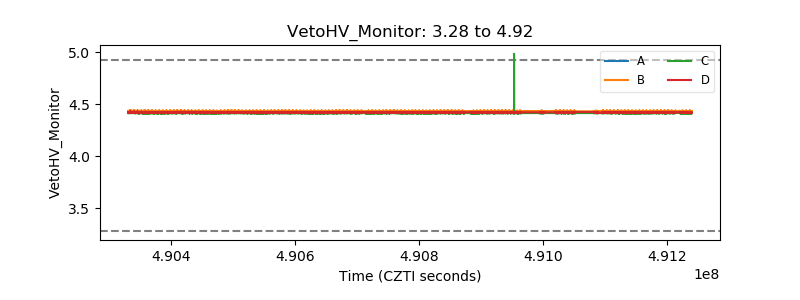 |
| Veto LLD | 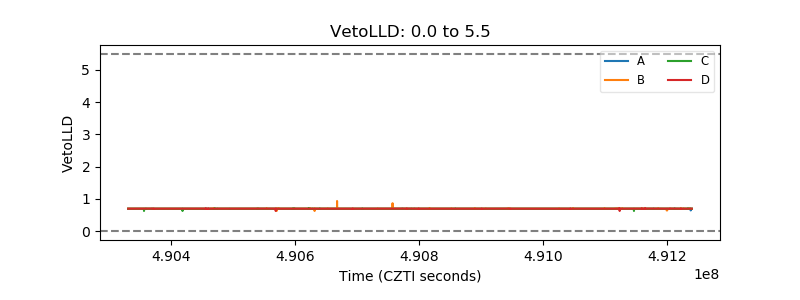 |
| Alpha Counter | 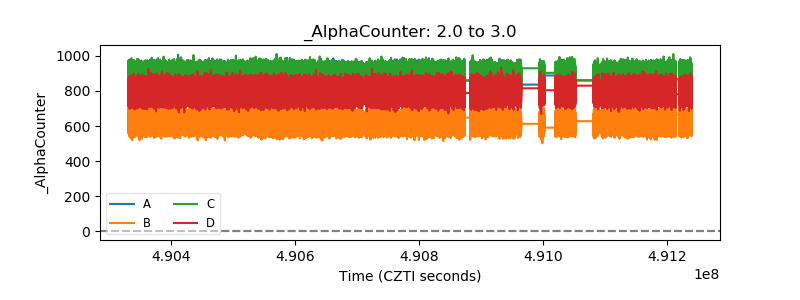 |
| _CPM_Rate | 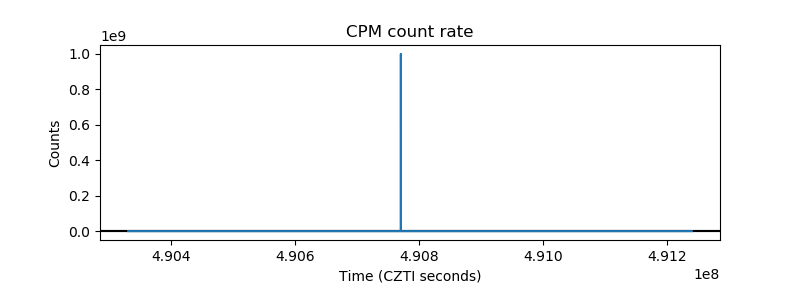 |
| CZT Counter | 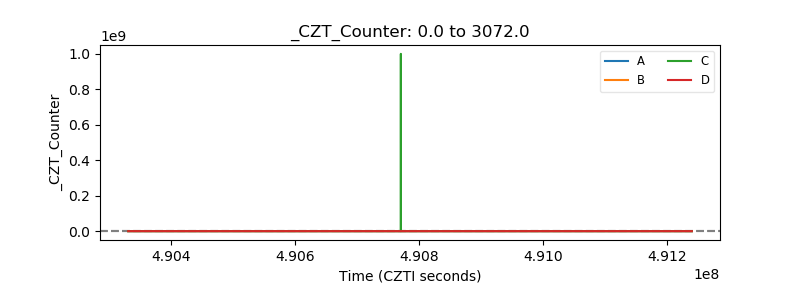 |
| +2.5 Volts monitor | 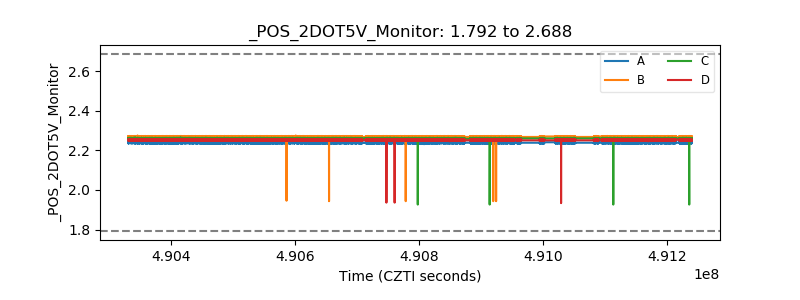 |
| +5 Volts monitor | 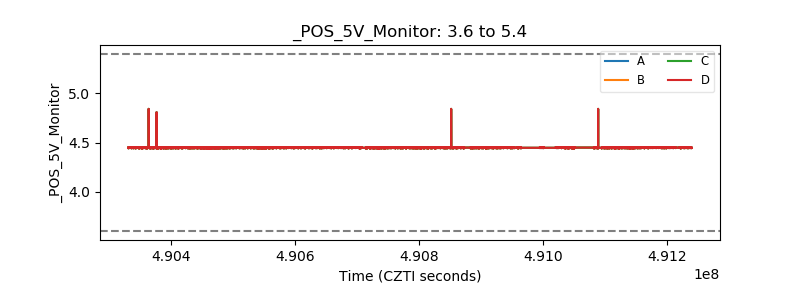 |
| _ROLL_ROT | 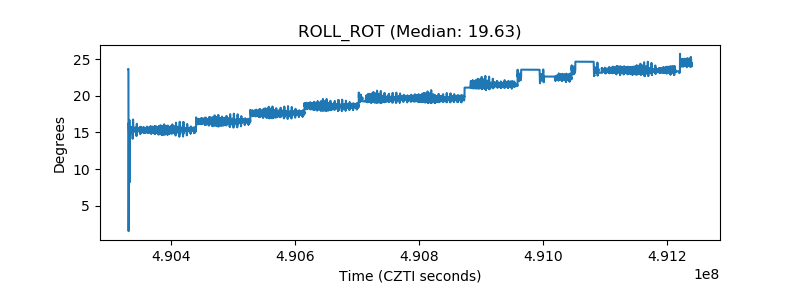 |
| _Roll_DEC | 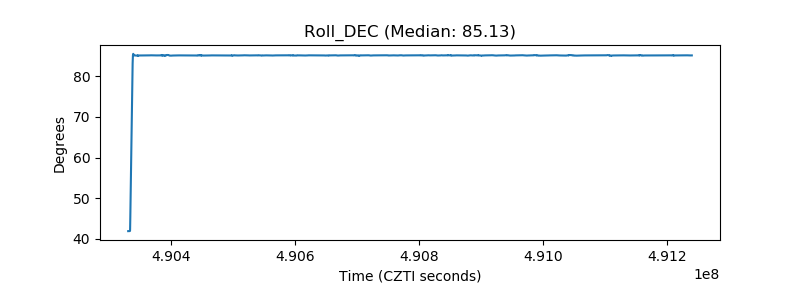 |
| _Roll_RA | 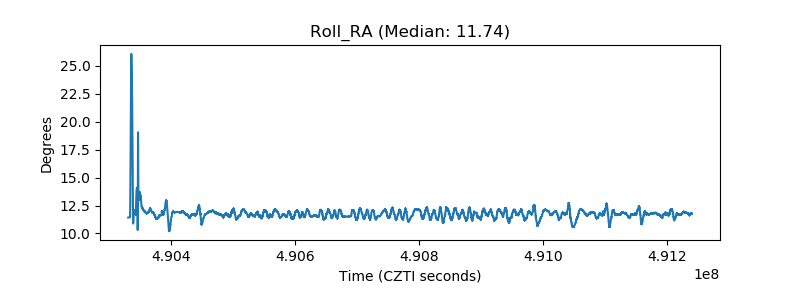 |
| Veto Counter | 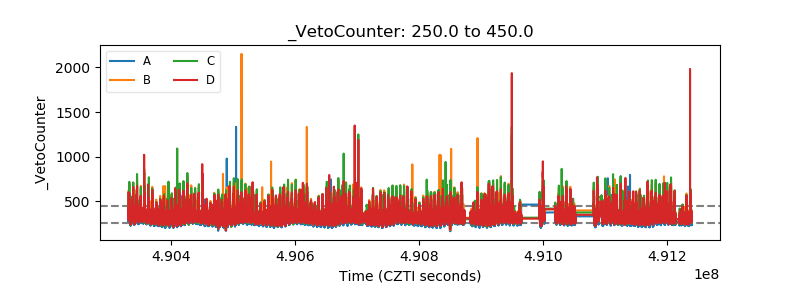 |