| Param | Original file | Final file |
|---|---|---|
| Filename | modeM0/AS1C09_011T07_9000006488_53004cztM0_level2.fits | modeM0/AS1C09_011T07_9000006488_53004cztM0_level2_quad_clean.evt |
| Size (bytes) | 978,382,080 | 58,648,320 |
| Size | 933.1 MB | 55.9 MB |
| Events in quadrant A | 13,385,998 | 93,239 |
| Events in quadrant B | 5,249,188 | 573,716 |
| Events in quadrant C | 6,555,600 | 440,095 |
| Events in quadrant D | 10,588,954 | 272,146 |
| Mode SS | |||
|---|---|---|---|
| Quadrant | BADHDUFLAG | Total packets | Discarded packets |
| A | 0 | 114 | 0 |
| B | 0 | 114 | 0 |
| C | 0 | 114 | 0 |
| D | 0 | 114 | 0 |
| Mode M9 | |||
|---|---|---|---|
| Quadrant | BADHDUFLAG | Total packets | Discarded packets |
| A | 0 | 12 | 0 |
| B | 0 | 12 | 0 |
| C | 0 | 12 | 0 |
| D | 0 | 12 | 0 |
| Mode M0 | |||
|---|---|---|---|
| Quadrant | BADHDUFLAG | Total packets | Discarded packets |
| A | 0 | 43599 | 5 |
| B | 0 | 19517 | 1 |
| C | 0 | 23348 | 1 |
| D | 0 | 35408 | 1 |
| Quadrant | Total seconds | Saturated seconds | Saturation percentage |
|---|---|---|---|
| A | 5668 | 4958 | 87.473536% |
| B | 5669 | 306 | 5.397777% |
| C | 5669 | 1055 | 18.609984% |
| D | 5669 | 2947 | 51.984477% |
Noise dominated data is calculated using 1-second bins in cleaned event files. If a bin has >2000 counts, and if more than 50% of those come from <1% of pixels, then it is considered to be noise-dominated and hence unusable.
| Quadrant | # 1 sec bins | Bins with >0 counts | Bins with >2000 counts | High rate bins dominated by noise | Noise dominated (total time) | Noise dominated (detector-on time) | Marked lightcurve |
|---|---|---|---|---|---|---|---|
| A | 6808 | 5668 | 4280 | 4280 | 62.87% | 75.51% | 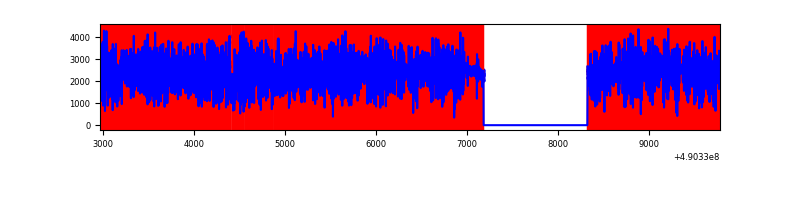 |
| B | 6809 | 5670 | 246 | 246 | 3.61% | 4.34% | 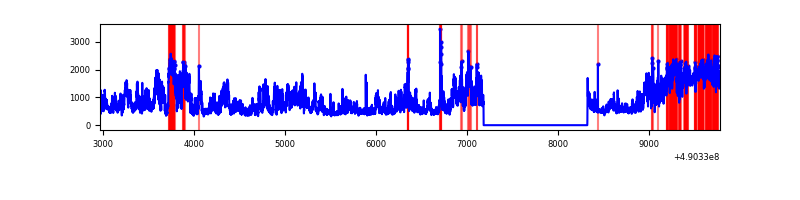 |
| C | 6809 | 5670 | 951 | 951 | 13.97% | 16.77% | 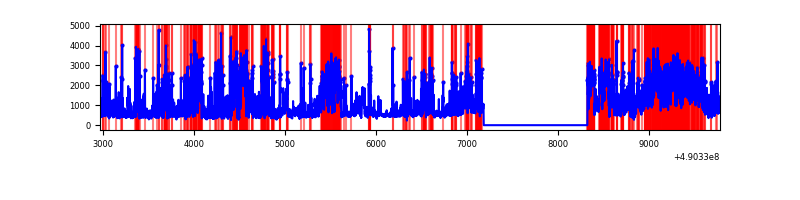 |
| D | 6809 | 5670 | 2422 | 2422 | 35.57% | 42.72% | 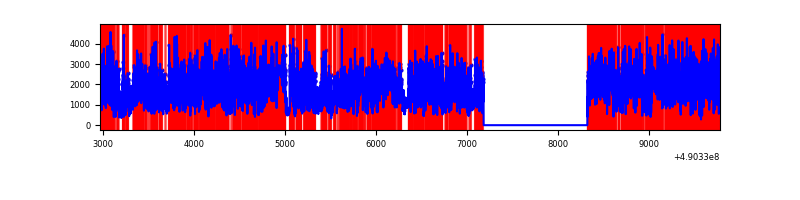 |
Top three noisy pixels from each quadrant. If the there are fewer than three noisy pixels in the level2.evt file, extra rows are filled as -1
| Pixel properties | Quadrant properties | ||||||
|---|---|---|---|---|---|---|---|
| Quadrant | DetID | PixID | Counts | Sigma | Mean | Median | Sigma |
| A | 9 | 191 | 10907506 | 127576.91 | 337 | 327 | 85.5 |
| A | 15 | 190 | 543122 | 6348.86 | 337 | 327 | 85.5 |
| A | 0 | 8 | 305018 | 3563.85 | 337 | 327 | 85.5 |
| B | 10 | 254 | 2763684 | 22797.63 | 570 | 553 | 121.2 |
| B | 4 | 81 | 51448 | 419.92 | 570 | 553 | 121.2 |
| B | 5 | 172 | 48043 | 391.82 | 570 | 553 | 121.2 |
| C | 9 | 38 | 1495614 | 10239.77 | 522 | 515 | 146.0 |
| C | 15 | 224 | 927245 | 6347.08 | 522 | 515 | 146.0 |
| C | 1 | 241 | 860561 | 5890.36 | 522 | 515 | 146.0 |
| D | 2 | 62 | 5217438 | 40285.07 | 443 | 423 | 129.5 |
| D | 8 | 176 | 1868164 | 14422.44 | 443 | 423 | 129.5 |
| D | 11 | 176 | 830784 | 6411.93 | 443 | 423 | 129.5 |
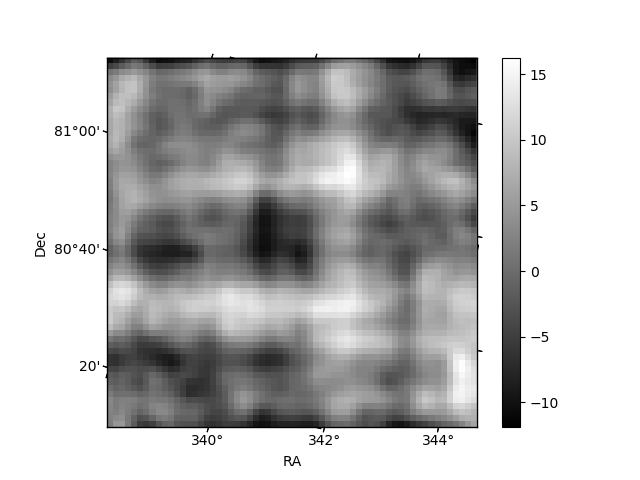
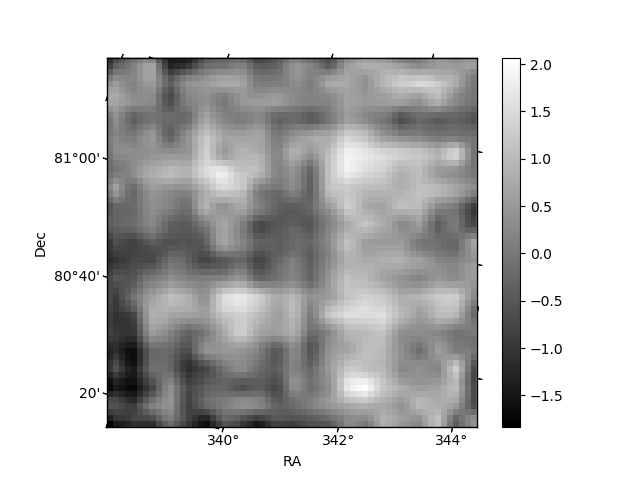
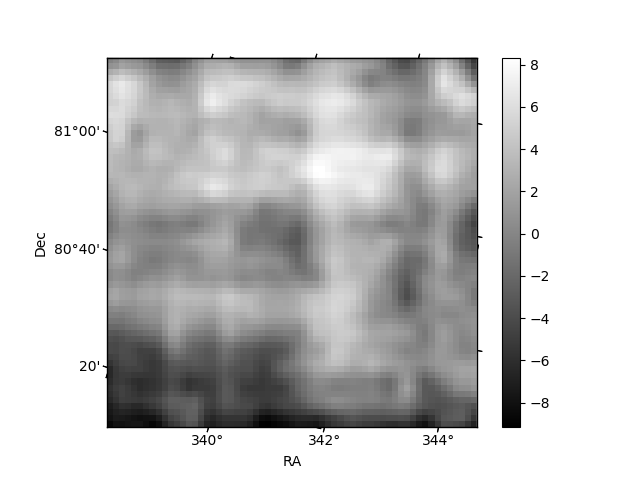
Histogram calculated using DETX and DETY for each event in the final _common_clean file
| Quadrant A | 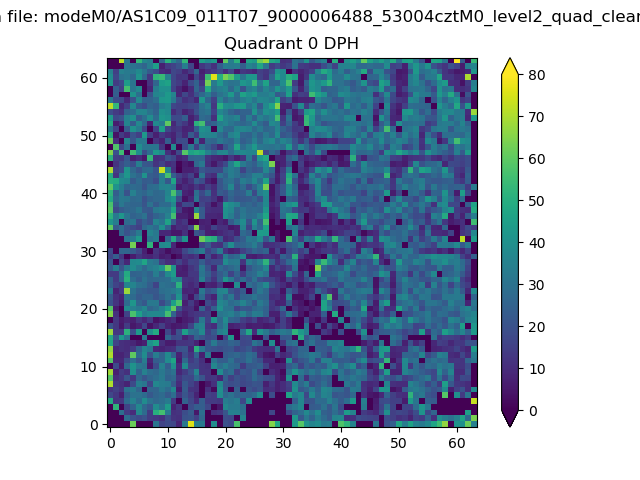 |
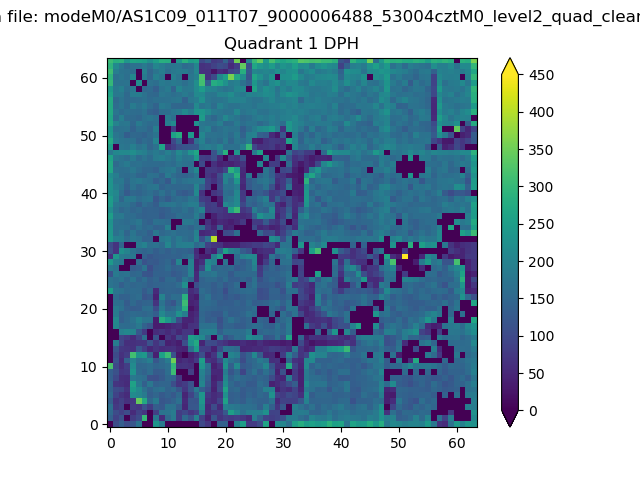 |
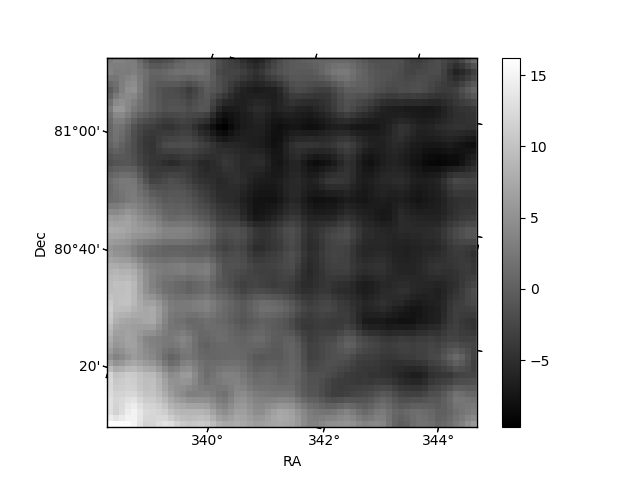
Quadrant B |
|---|---|---|---|
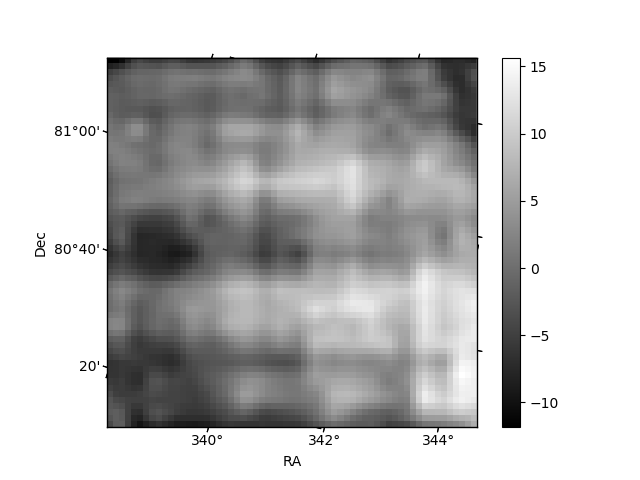
| Quadrant D | 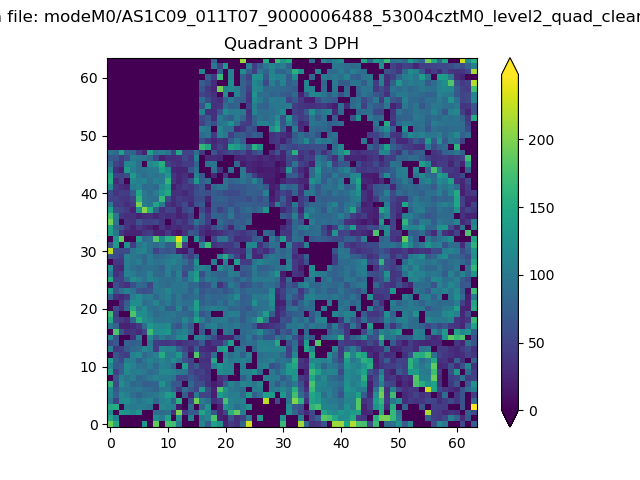 |
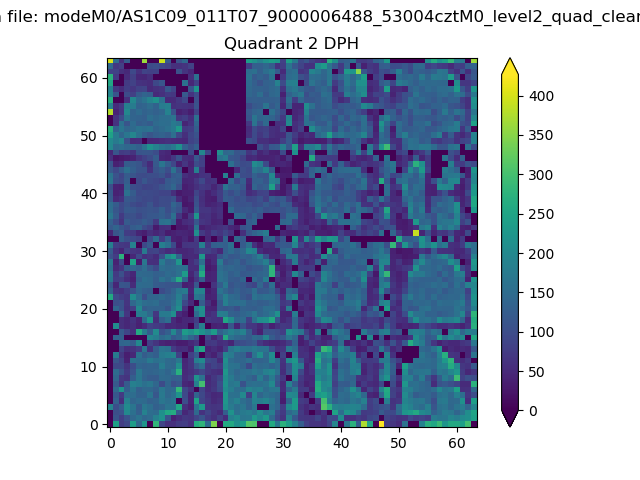 |
Quadrant C |
| Plot type | Count rate plots | Images |
|---|---|---|
| Comparison with Poisson distribution Blue bars denote a histogram of data divided into 1 sec bins. Red curve is a Poisson curve with rate = median count rate of data. |
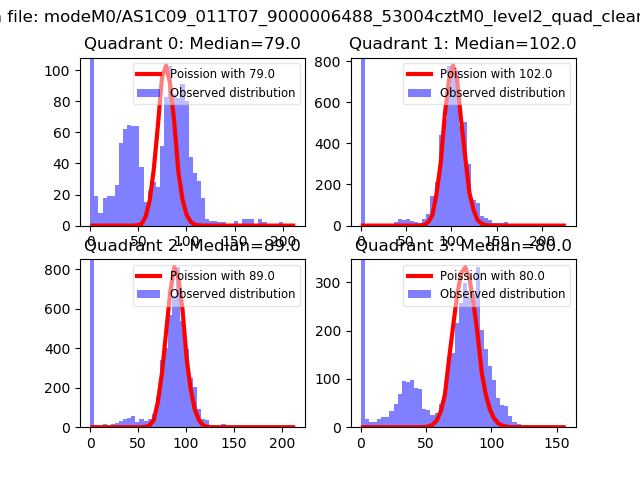 |
 |
| Quadrant-wise count rates Data is divided into 100 sec bins |
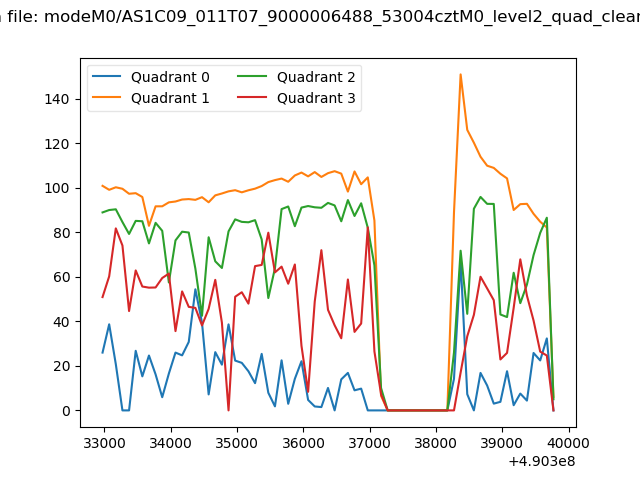 |
|
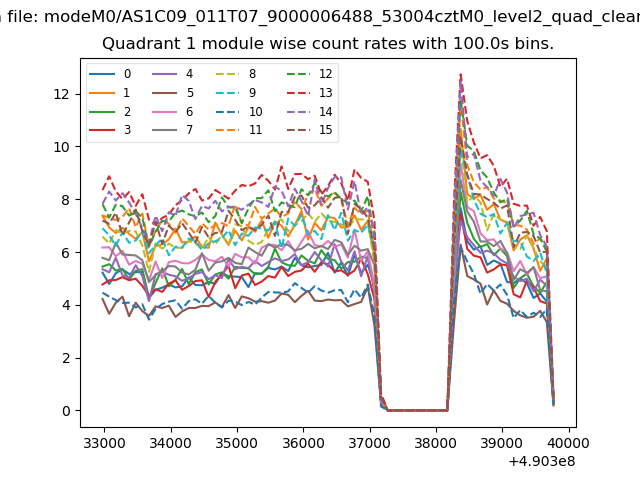
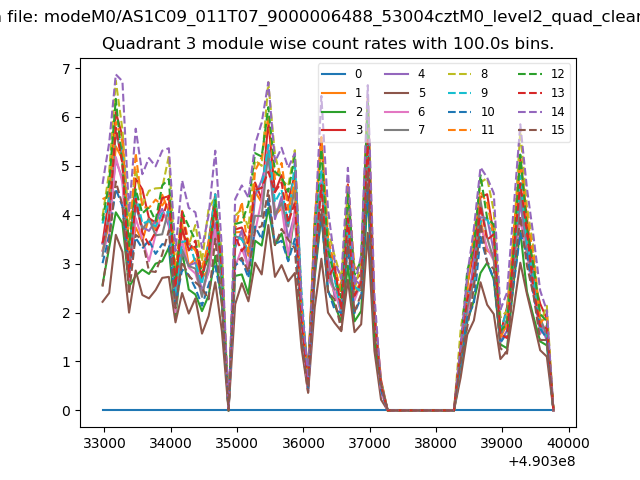
| Module-wise count rates for Quadrant A Data is divided into 100 sec bins |
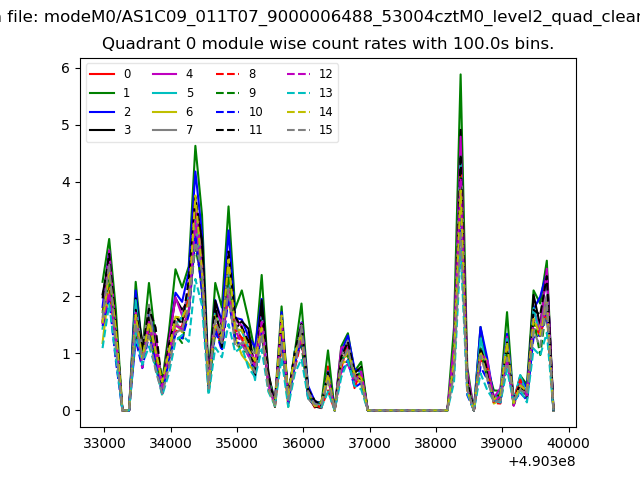 |
 |
| Module-wise count rates for Quadrant B Data is divided into 100 sec bins |
 |
 |
| Module-wise count rates for Quadrant C Data is divided into 100 sec bins |
 |
 |
| Module-wise count rates for Quadrant D Data is divided into 100 sec bins |
 |
 |
| Parameter | Plot |
|---|---|
| CZT HV Monitor | 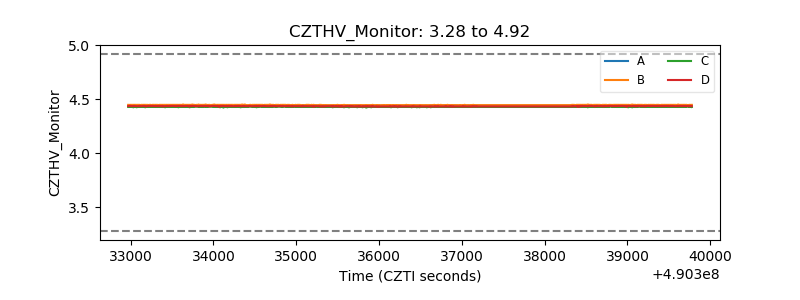 |
| D_VDD | 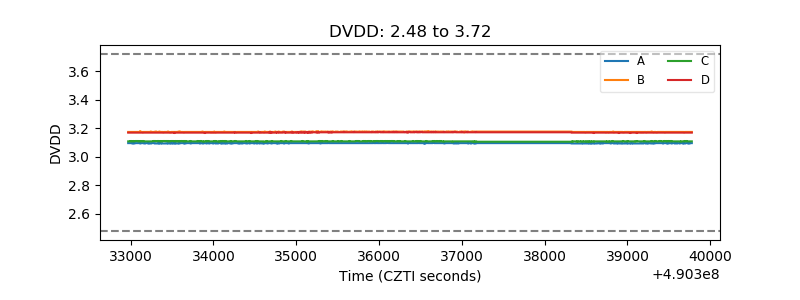 |
| Temperature 1 |  |
| Veto HV Monitor | 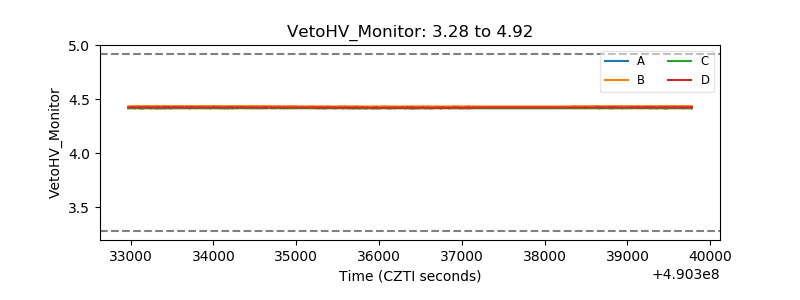 |
| Veto LLD | 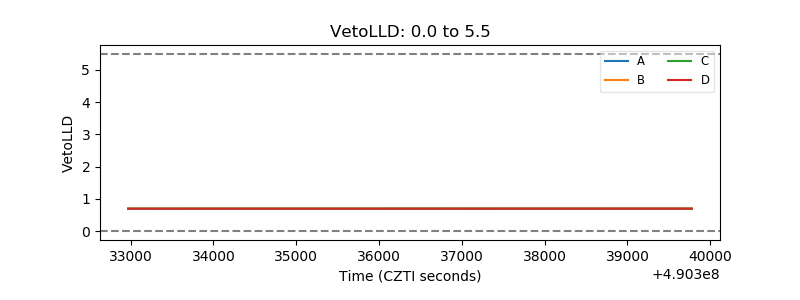 |
| Alpha Counter | 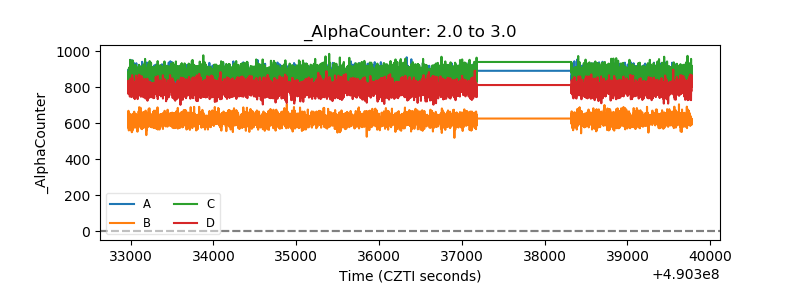 |
| _CPM_Rate | 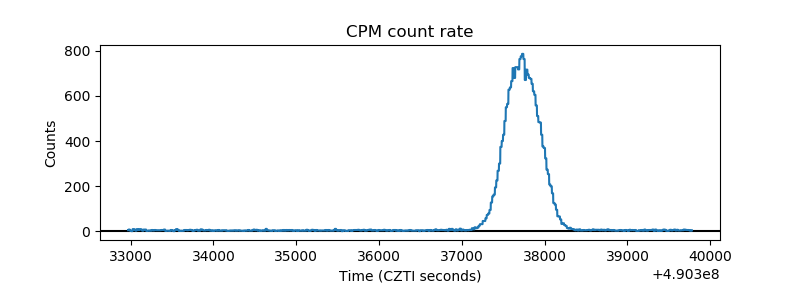 |
| CZT Counter | 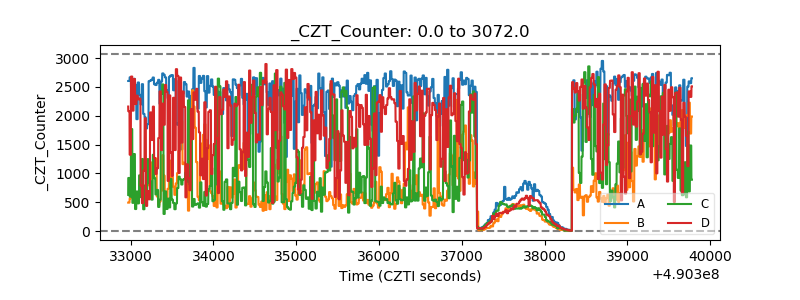 |
| +2.5 Volts monitor |  |
| +5 Volts monitor | 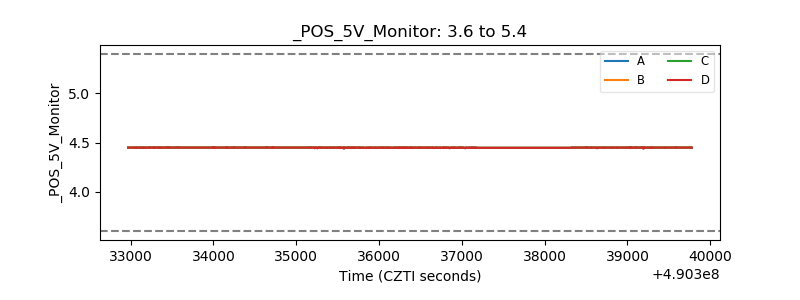 |
| _ROLL_ROT | 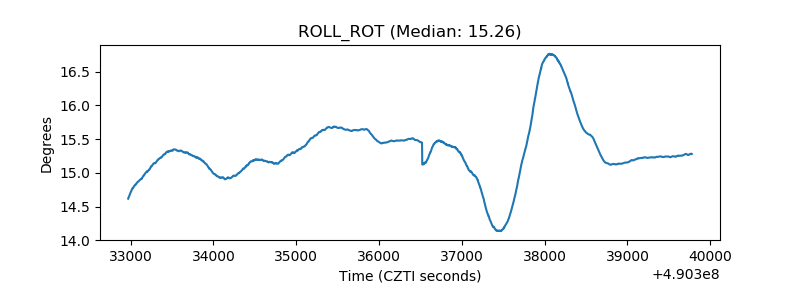 |
| _Roll_DEC | 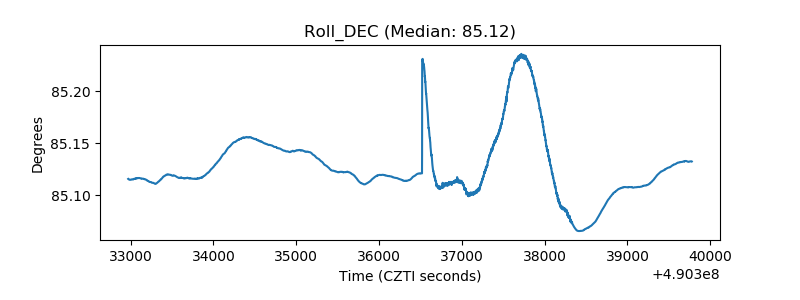 |
| _Roll_RA | 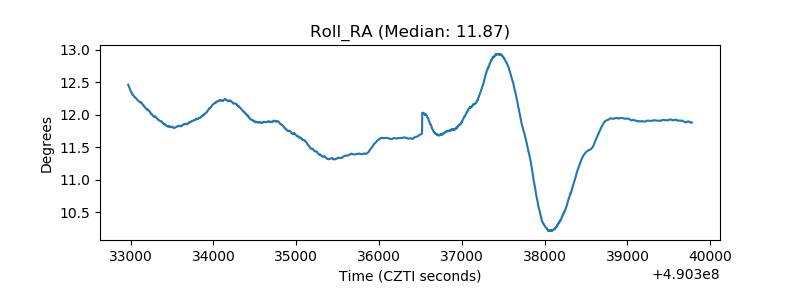 |
| Veto Counter | 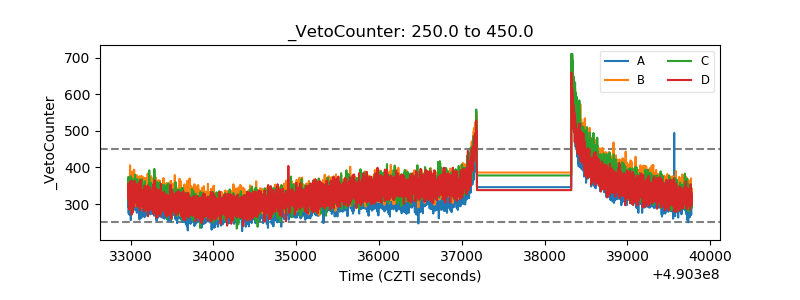 |