| Param | Original file | Final file |
|---|---|---|
| Filename | modeM0/AS1C09_011T07_9000006488_53005cztM0_level2.fits | modeM0/AS1C09_011T07_9000006488_53005cztM0_level2_quad_clean.evt |
| Size (bytes) | 1,149,960,960 | 48,602,880 |
| Size | 1.1 GB | 46.4 MB |
| Events in quadrant A | 13,642,688 | 48,325 |
| Events in quadrant B | 8,805,035 | 464,595 |
| Events in quadrant C | 8,622,021 | 357,674 |
| Events in quadrant D | 11,069,321 | 209,198 |
| Mode SS | |||
|---|---|---|---|
| Quadrant | BADHDUFLAG | Total packets | Discarded packets |
| A | 0 | 115 | 1 |
| B | 0 | 116 | 0 |
| C | 0 | 116 | 0 |
| D | 0 | 116 | 2 |
| Mode M9 | |||
|---|---|---|---|
| Quadrant | BADHDUFLAG | Total packets | Discarded packets |
| A | 0 | 11 | 0 |
| B | 0 | 11 | 0 |
| C | 0 | 11 | 0 |
| D | 0 | 11 | 0 |
| Mode M0 | |||
|---|---|---|---|
| Quadrant | BADHDUFLAG | Total packets | Discarded packets |
| A | 0 | 44864 | 559 |
| B | 0 | 30400 | 338 |
| C | 0 | 29929 | 409 |
| D | 0 | 37255 | 567 |
| Quadrant | Total seconds | Saturated seconds | Saturation percentage |
|---|---|---|---|
| A | 5585 | 5177 | 92.694718% |
| B | 5593 | 1659 | 29.662078% |
| C | 5591 | 1979 | 35.396172% |
| D | 5571 | 3581 | 64.279304% |
Noise dominated data is calculated using 1-second bins in cleaned event files. If a bin has >2000 counts, and if more than 50% of those come from <1% of pixels, then it is considered to be noise-dominated and hence unusable.
| Quadrant | # 1 sec bins | Bins with >0 counts | Bins with >2000 counts | High rate bins dominated by noise | Noise dominated (total time) | Noise dominated (detector-on time) | Marked lightcurve |
|---|---|---|---|---|---|---|---|
| A | 6780 | 5612 | 4759 | 4759 | 70.19% | 84.80% | 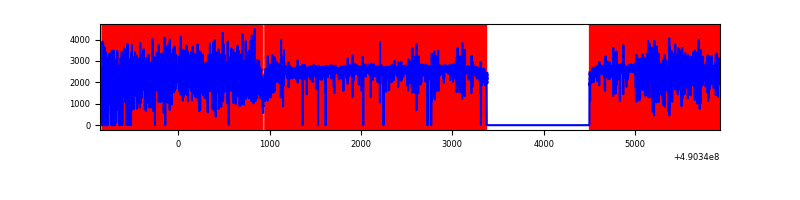 |
| B | 6784 | 5640 | 1534 | 1534 | 22.61% | 27.20% | 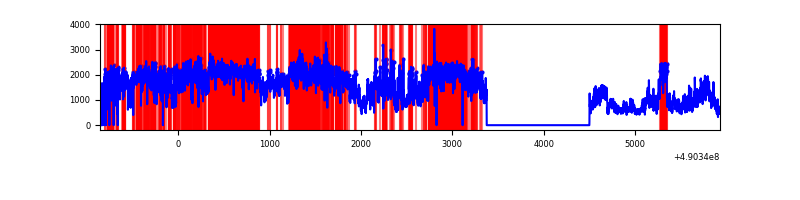 |
| C | 6785 | 5637 | 1600 | 1600 | 23.58% | 28.38% | 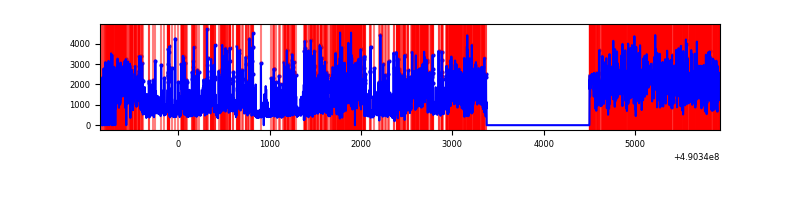 |
| D | 6784 | 5631 | 2814 | 2814 | 41.48% | 49.97% | 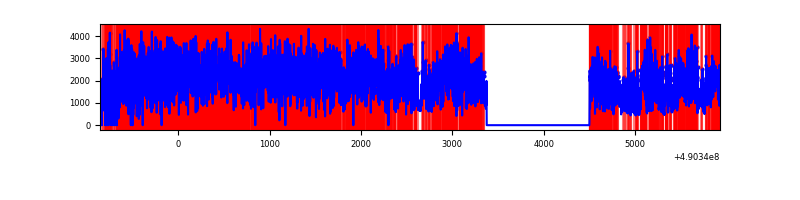 |
Top three noisy pixels from each quadrant. If the there are fewer than three noisy pixels in the level2.evt file, extra rows are filled as -1
| Pixel properties | Quadrant properties | ||||||
|---|---|---|---|---|---|---|---|
| Quadrant | DetID | PixID | Counts | Sigma | Mean | Median | Sigma |
| A | 9 | 191 | 11932872 | 189800.2 | 246 | 239 | 62.9 |
| A | 15 | 190 | 529660 | 8420.96 | 246 | 239 | 62.9 |
| A | 0 | 8 | 63636 | 1008.39 | 246 | 239 | 62.9 |
| B | 10 | 254 | 6324529 | 54311.22 | 548 | 531 | 116.4 |
| B | 10 | 128 | 105397 | 900.6 | 548 | 531 | 116.4 |
| B | 4 | 81 | 64517 | 549.52 | 548 | 531 | 116.4 |
| C | 9 | 38 | 2995872 | 22274.47 | 484 | 479 | 134.5 |
| C | 15 | 224 | 1853115 | 13776.65 | 484 | 479 | 134.5 |
| C | 12 | 254 | 881879 | 6554.31 | 484 | 479 | 134.5 |
| D | 2 | 62 | 5456988 | 46110.18 | 405 | 385 | 118.3 |
| D | 8 | 176 | 3156130 | 26667.14 | 405 | 385 | 118.3 |
| D | 7 | 253 | 179037 | 1509.67 | 405 | 385 | 118.3 |
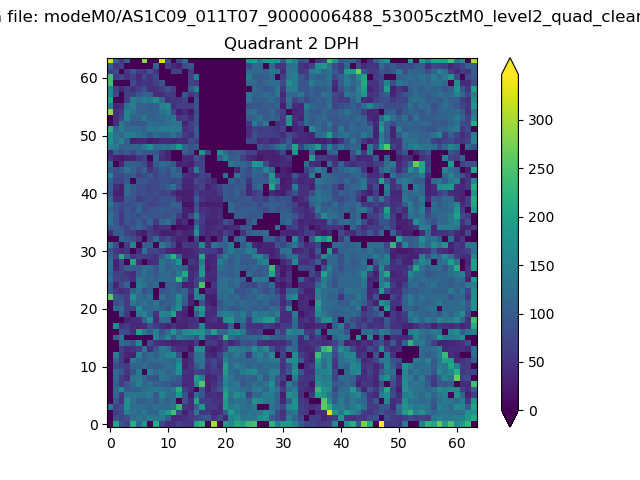
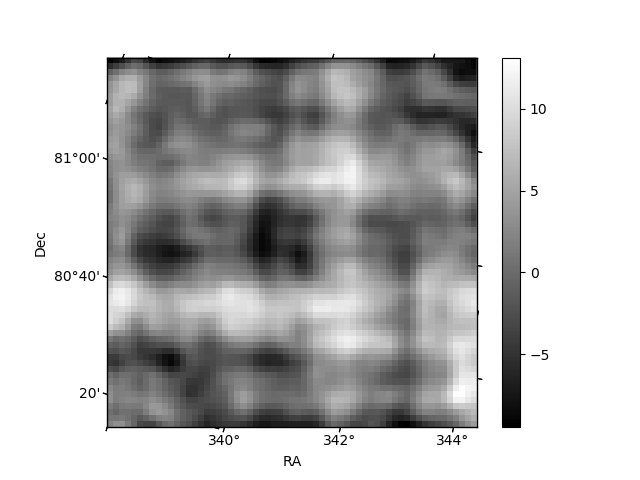
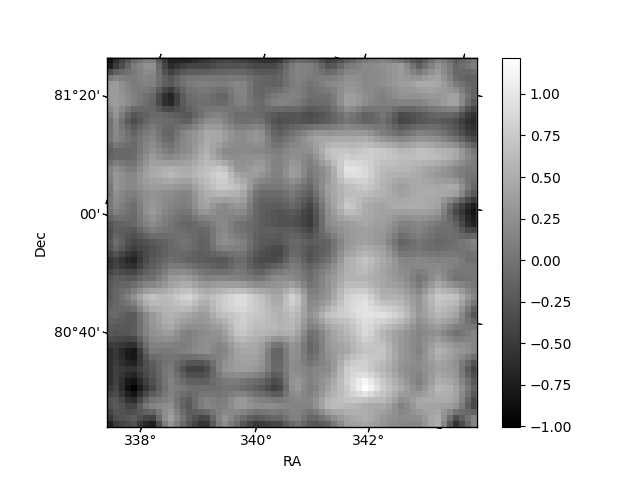
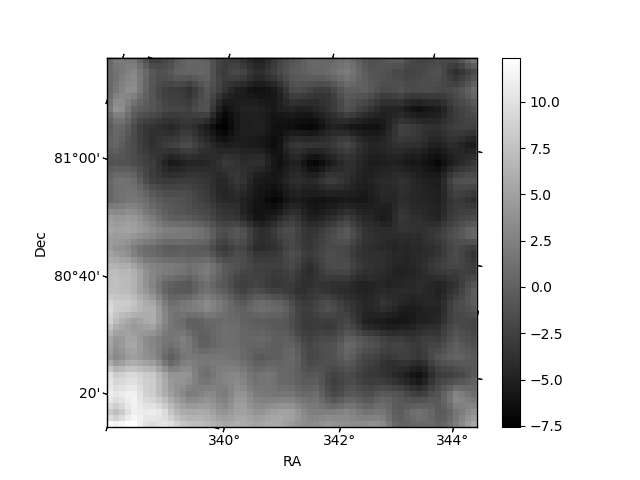
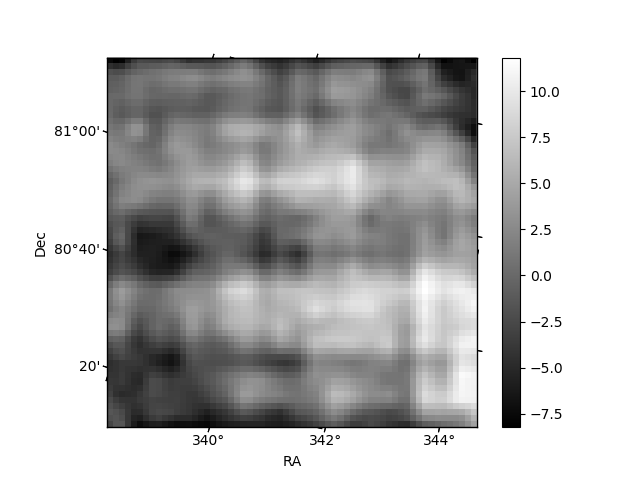
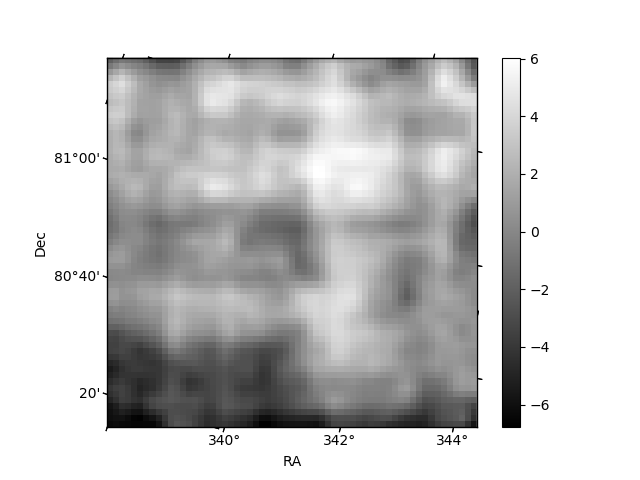
Histogram calculated using DETX and DETY for each event in the final _common_clean file
| Quadrant A | 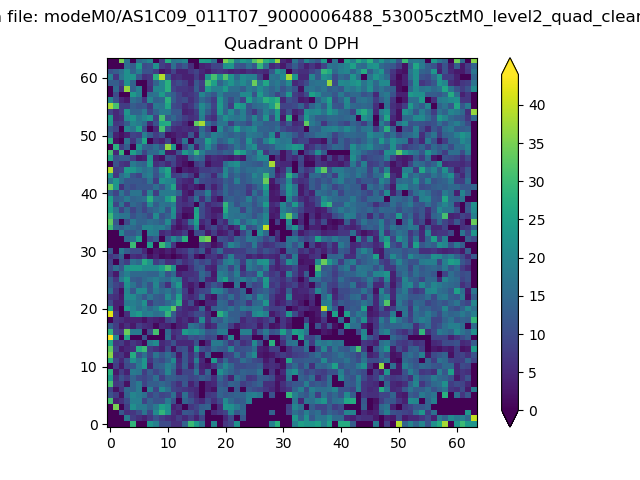 |
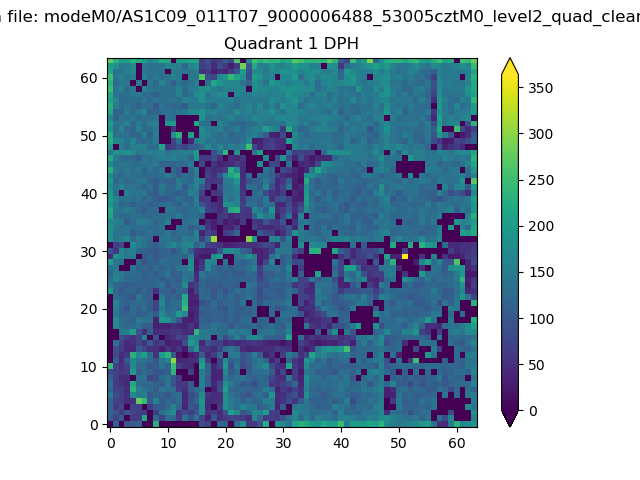 |
Quadrant B |
|---|---|---|---|
| Quadrant D | 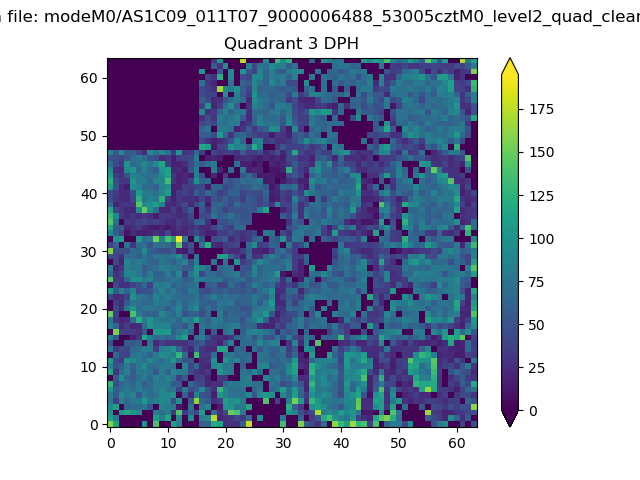 |
 |
Quadrant C |
| Plot type | Count rate plots | Images |
|---|---|---|
| Comparison with Poisson distribution Blue bars denote a histogram of data divided into 1 sec bins. Red curve is a Poisson curve with rate = median count rate of data. |
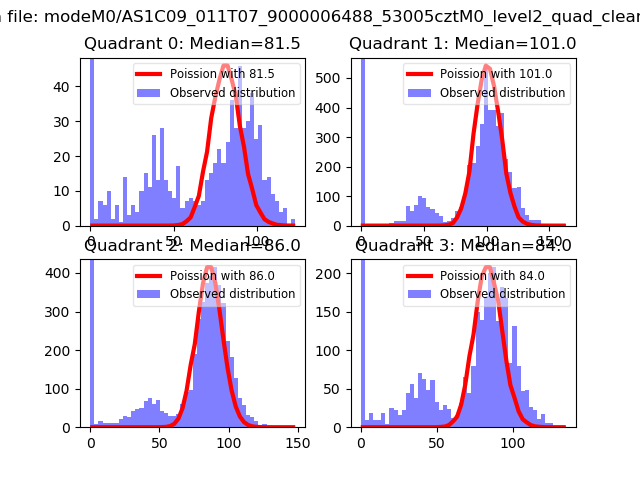 |
 |
| Quadrant-wise count rates Data is divided into 100 sec bins |
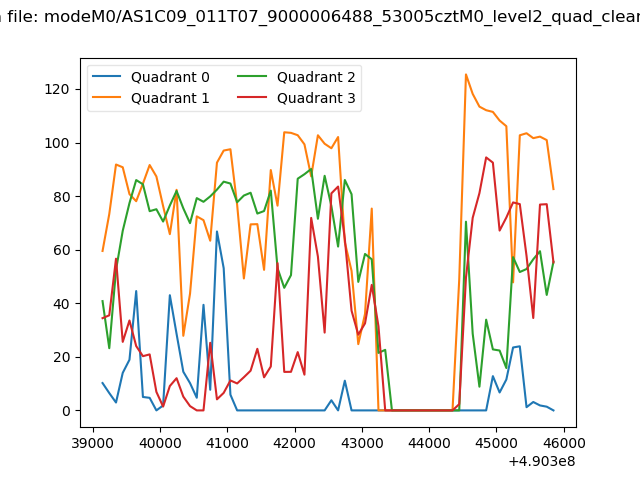 |
|
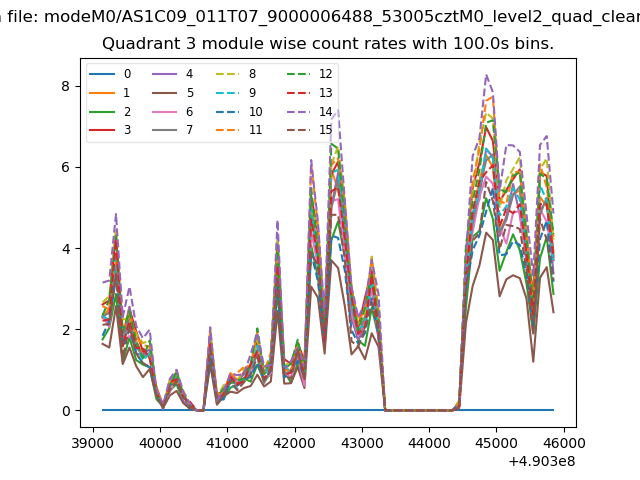
| Module-wise count rates for Quadrant A Data is divided into 100 sec bins |
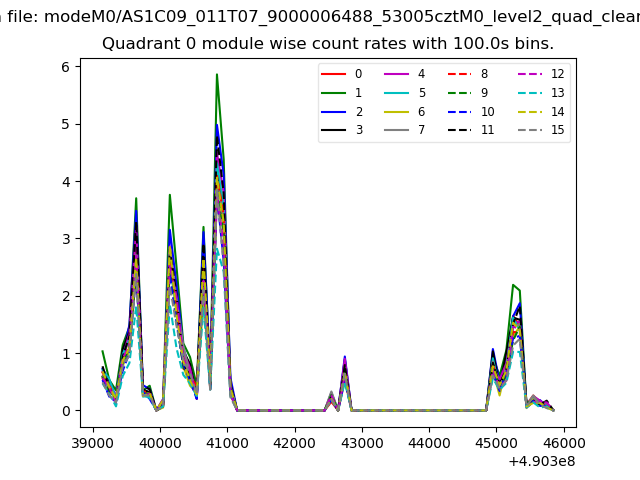 |
 |
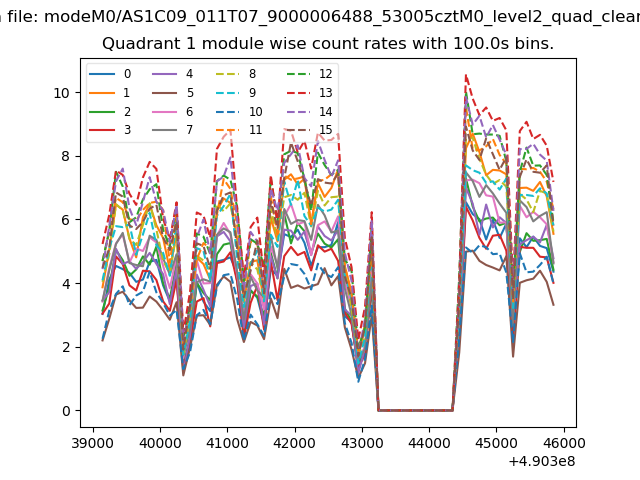
| Module-wise count rates for Quadrant B Data is divided into 100 sec bins |
 |
 |
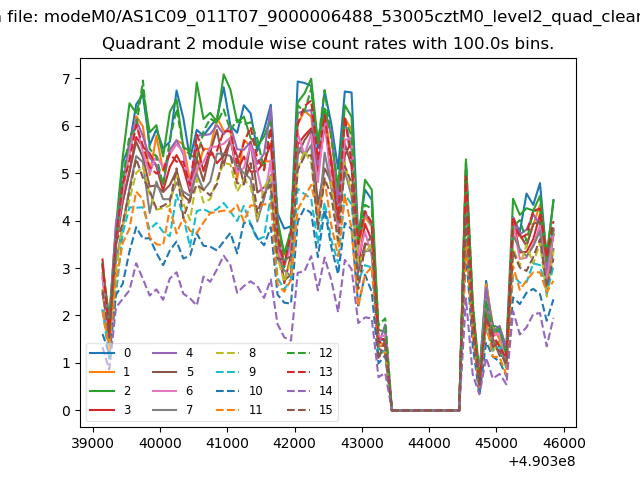
| Module-wise count rates for Quadrant C Data is divided into 100 sec bins |
 |
 |
| Module-wise count rates for Quadrant D Data is divided into 100 sec bins |
 |
 |
| Parameter | Plot |
|---|---|
| CZT HV Monitor | 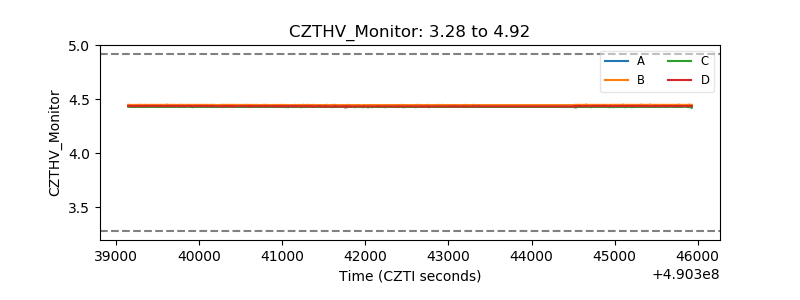 |
| D_VDD | 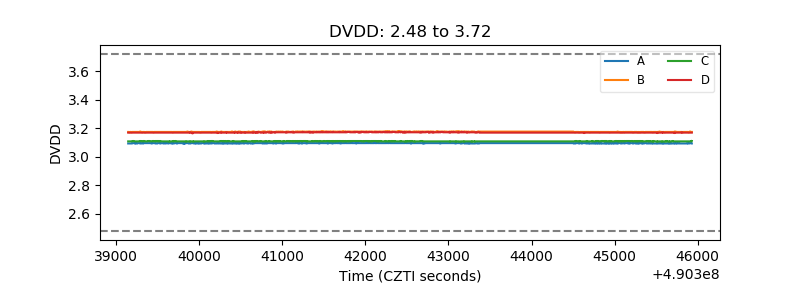 |
| Temperature 1 | 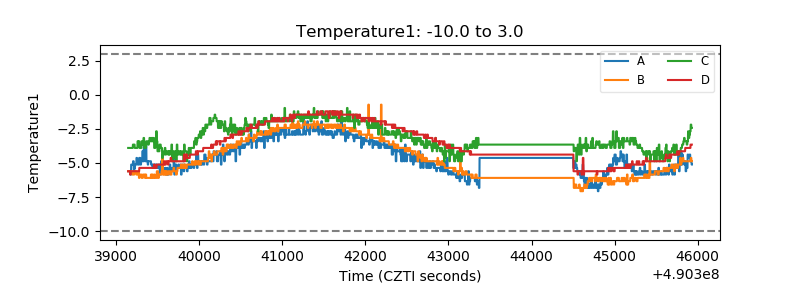 |
| Veto HV Monitor | 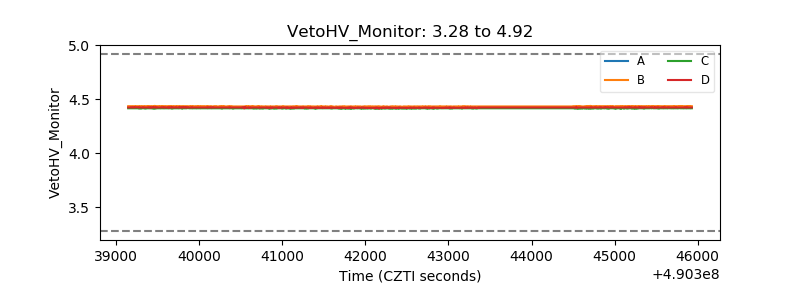 |
| Veto LLD | 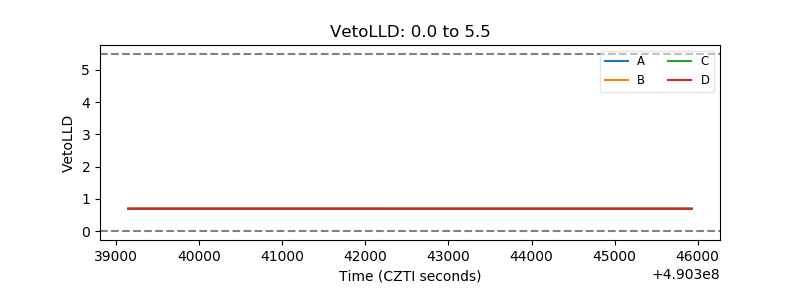 |
| Alpha Counter | 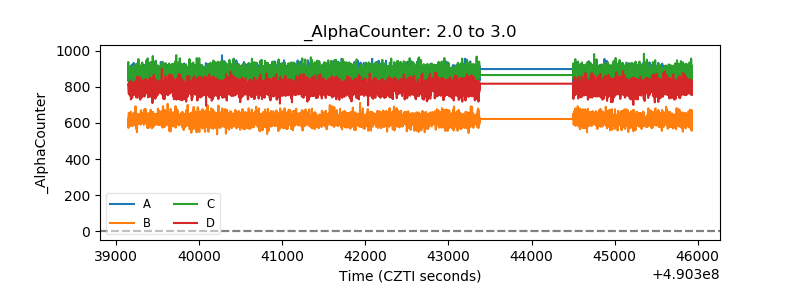 |
| _CPM_Rate | 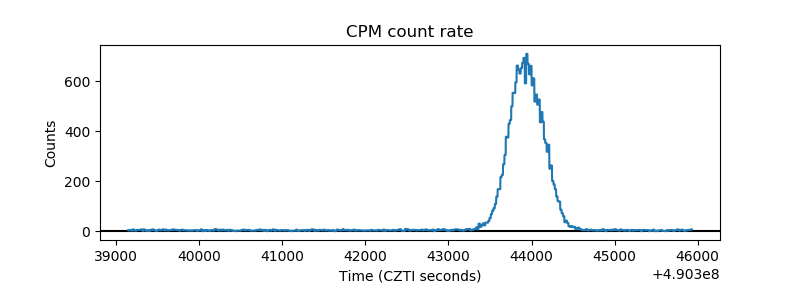 |
| CZT Counter |  |
| +2.5 Volts monitor |  |
| +5 Volts monitor |  |
| _ROLL_ROT | 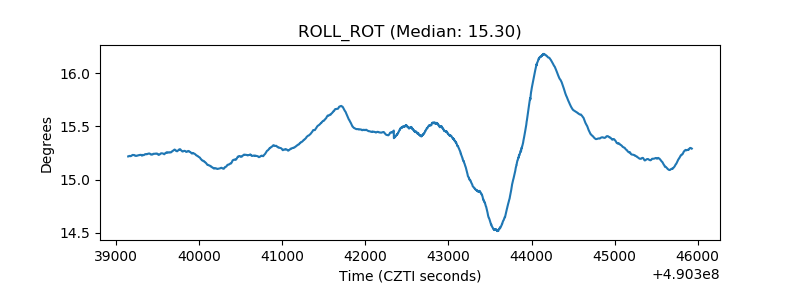 |
| _Roll_DEC | 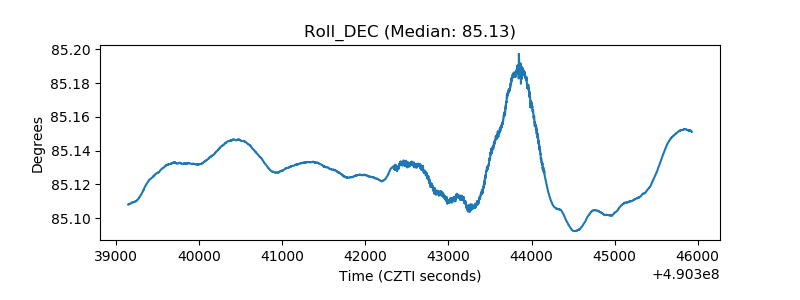 |
| _Roll_RA | 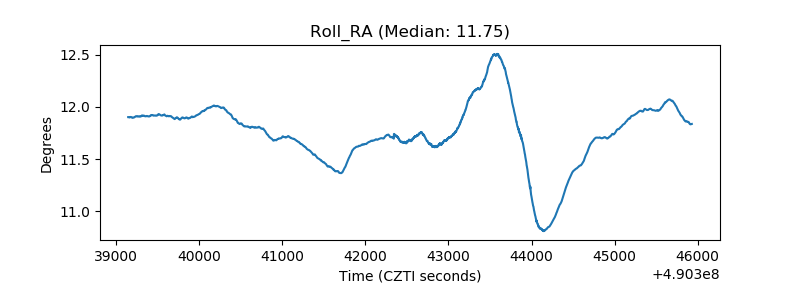 |
| Veto Counter | 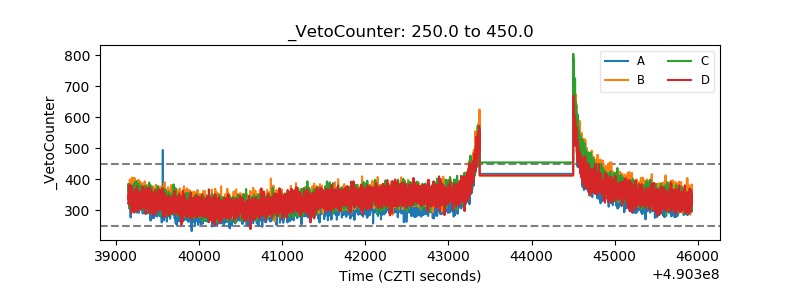 |