| Param | Original file | Final file |
|---|---|---|
| Filename | modeM0/AS1C09_011T07_9000006488_53006cztM0_level2.fits | modeM0/AS1C09_011T07_9000006488_53006cztM0_level2_quad_clean.evt |
| Size (bytes) | 1,137,623,040 | 58,250,880 |
| Size | 1.1 GB | 55.6 MB |
| Events in quadrant A | 15,188,009 | 29,547 |
| Events in quadrant B | 4,992,488 | 621,059 |
| Events in quadrant C | 9,793,035 | 391,108 |
| Events in quadrant D | 11,665,081 | 292,782 |
| Mode SS | |||
|---|---|---|---|
| Quadrant | BADHDUFLAG | Total packets | Discarded packets |
| A | 0 | 124 | 0 |
| B | 0 | 124 | 0 |
| C | 0 | 124 | 0 |
| D | 0 | 124 | 0 |
| Mode M9 | |||
|---|---|---|---|
| Quadrant | BADHDUFLAG | Total packets | Discarded packets |
| A | 0 | 12 | 0 |
| B | 0 | 12 | 0 |
| C | 0 | 12 | 0 |
| D | 0 | 12 | 0 |
| Mode M0 | |||
|---|---|---|---|
| Quadrant | BADHDUFLAG | Total packets | Discarded packets |
| A | 0 | 49344 | 1 |
| B | 0 | 19132 | 1 |
| C | 0 | 33340 | 6 |
| D | 0 | 38933 | 1 |
| Quadrant | Total seconds | Saturated seconds | Saturation percentage |
|---|---|---|---|
| A | 6143 | 5930 | 96.532639% |
| B | 6143 | 241 | 3.923165% |
| C | 6142 | 2273 | 37.007489% |
| D | 6142 | 3180 | 51.774666% |
Noise dominated data is calculated using 1-second bins in cleaned event files. If a bin has >2000 counts, and if more than 50% of those come from <1% of pixels, then it is considered to be noise-dominated and hence unusable.
| Quadrant | # 1 sec bins | Bins with >0 counts | Bins with >2000 counts | High rate bins dominated by noise | Noise dominated (total time) | Noise dominated (detector-on time) | Marked lightcurve |
|---|---|---|---|---|---|---|---|
| A | 7297 | 6142 | 5323 | 5323 | 72.95% | 86.67% | 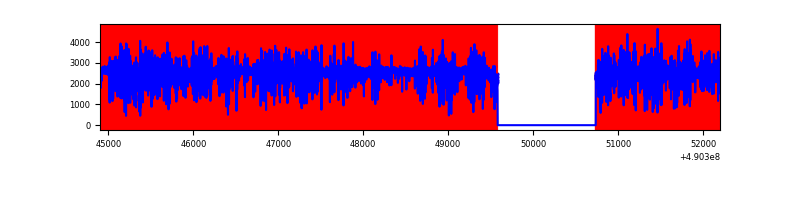 |
| B | 7298 | 6144 | 112 | 112 | 1.53% | 1.82% | 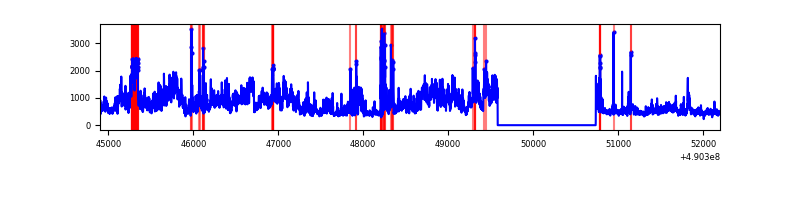 |
| C | 7296 | 6142 | 1914 | 1914 | 26.23% | 31.16% | 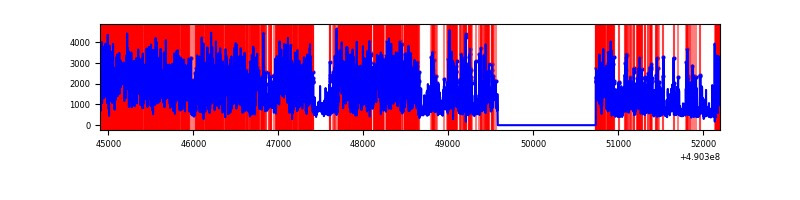 |
| D | 7297 | 6142 | 2793 | 2793 | 38.28% | 45.47% | 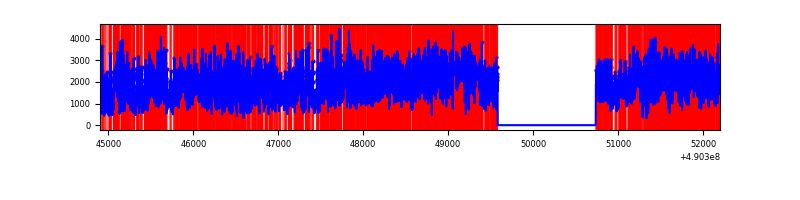 |
Top three noisy pixels from each quadrant. If the there are fewer than three noisy pixels in the level2.evt file, extra rows are filled as -1
| Pixel properties | Quadrant properties | ||||||
|---|---|---|---|---|---|---|---|
| Quadrant | DetID | PixID | Counts | Sigma | Mean | Median | Sigma |
| A | 9 | 191 | 13180969 | 191468.59 | 271 | 264 | 68.8 |
| A | 15 | 190 | 336136 | 4879.02 | 271 | 264 | 68.8 |
| A | 4 | 238 | 182753 | 2650.91 | 271 | 264 | 68.8 |
| B | 10 | 254 | 2075763 | 15639.02 | 625 | 604 | 132.7 |
| B | 5 | 185 | 209068 | 1571.05 | 625 | 604 | 132.7 |
| B | 4 | 81 | 70336 | 525.52 | 625 | 604 | 132.7 |
| C | 9 | 38 | 4253923 | 28707.82 | 535 | 530 | 148.2 |
| C | 15 | 224 | 1208494 | 8153.02 | 535 | 530 | 148.2 |
| C | 12 | 254 | 997292 | 6727.54 | 535 | 530 | 148.2 |
| D | 2 | 62 | 6282747 | 44382.97 | 488 | 466 | 141.5 |
| D | 12 | 17 | 1613174 | 11393.43 | 488 | 466 | 141.5 |
| D | 8 | 176 | 798115 | 5635.22 | 488 | 466 | 141.5 |
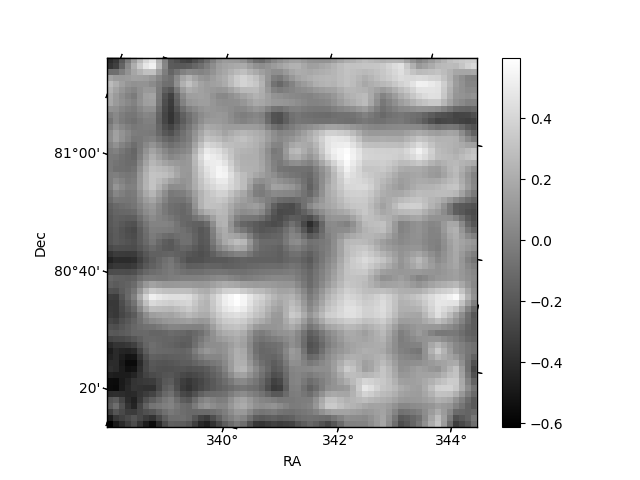
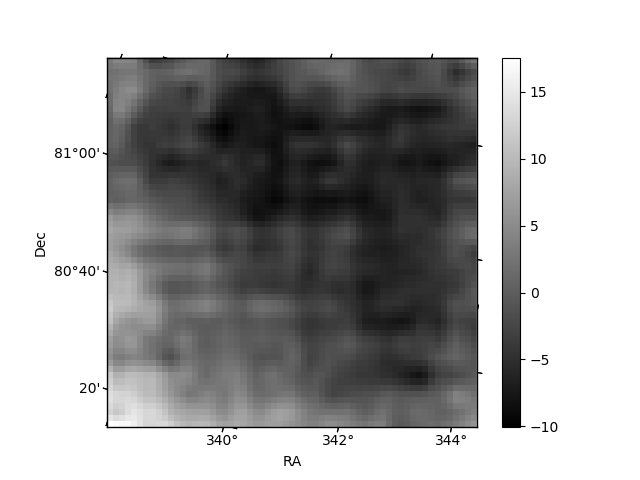
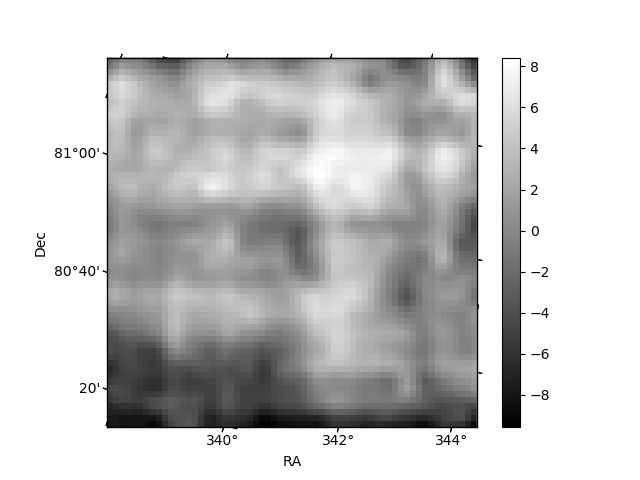
Histogram calculated using DETX and DETY for each event in the final _common_clean file
| Quadrant A | 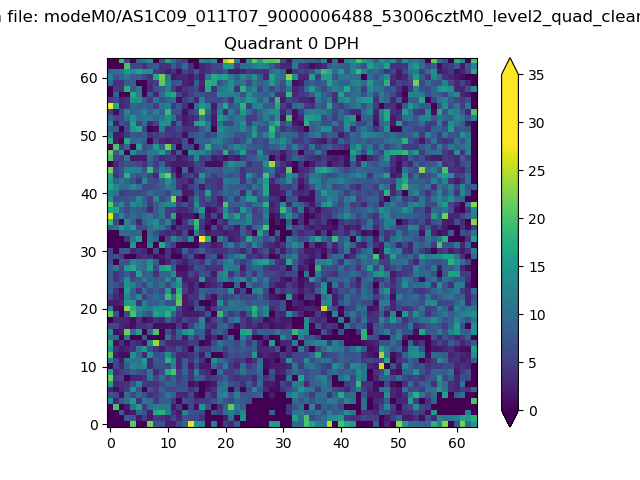 |
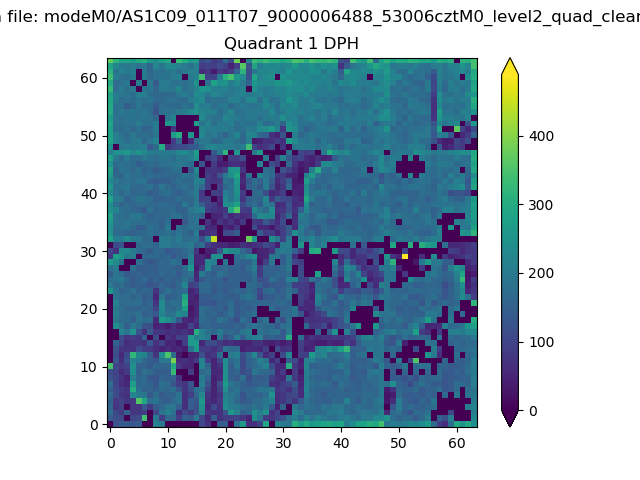 |
Quadrant B |
|---|---|---|---|
| Quadrant D | 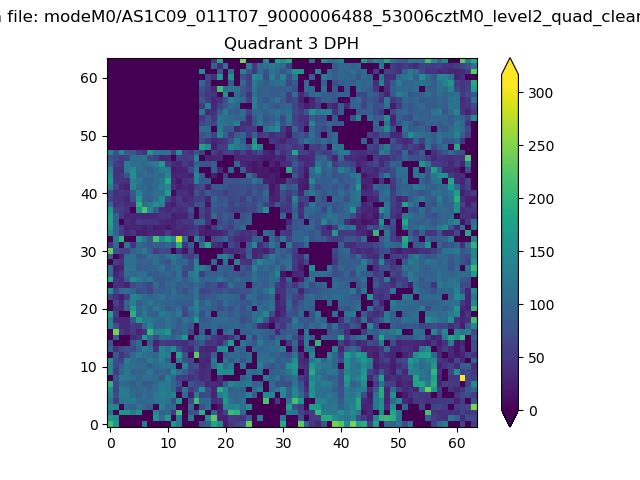 |
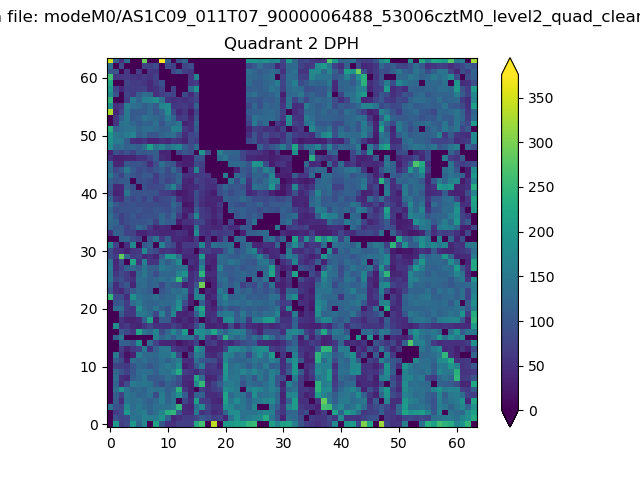 |
Quadrant C |
| Plot type | Count rate plots | Images |
|---|---|---|
| Comparison with Poisson distribution Blue bars denote a histogram of data divided into 1 sec bins. Red curve is a Poisson curve with rate = median count rate of data. |
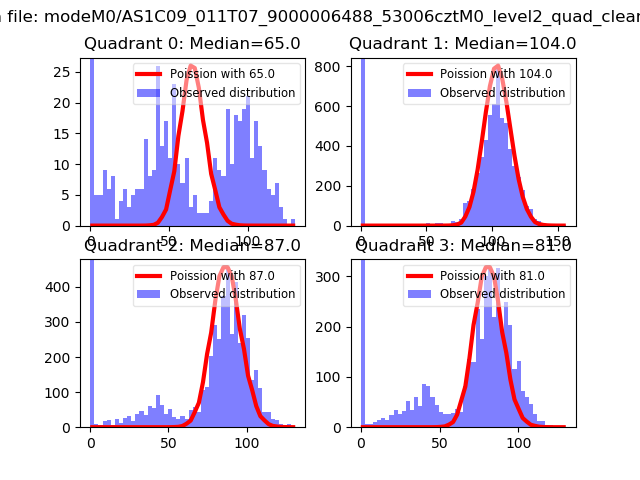 |
 |
| Quadrant-wise count rates Data is divided into 100 sec bins |
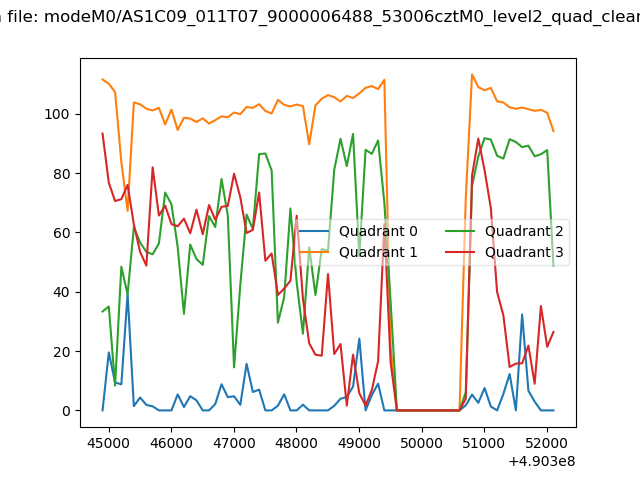 |
|
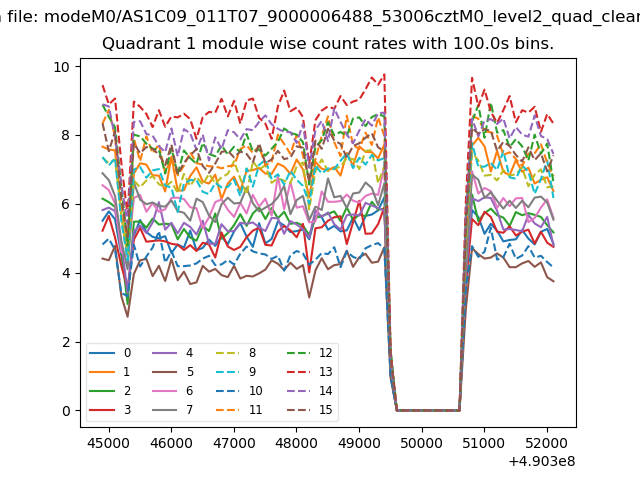
| Module-wise count rates for Quadrant A Data is divided into 100 sec bins |
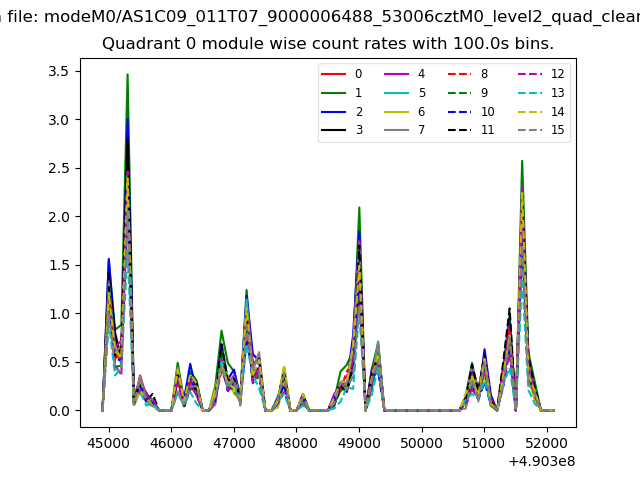 |
 |
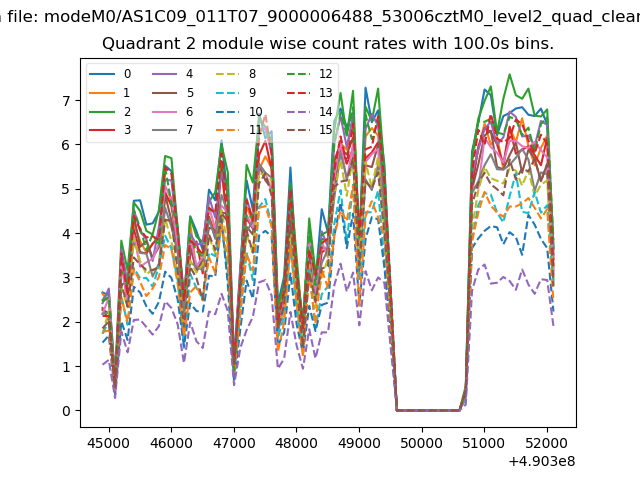
| Module-wise count rates for Quadrant B Data is divided into 100 sec bins |
 |
 |
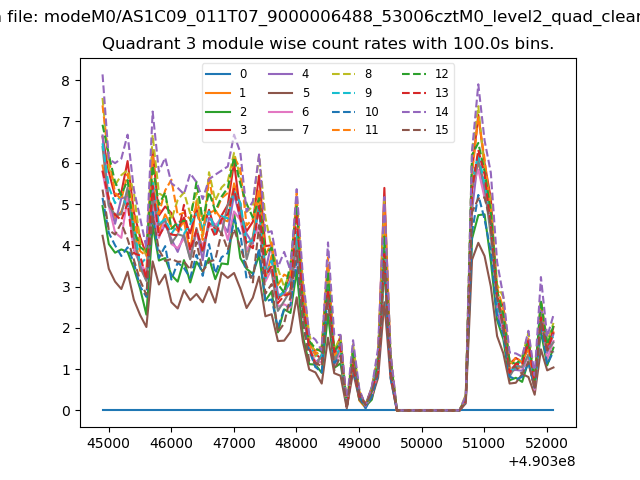
| Module-wise count rates for Quadrant C Data is divided into 100 sec bins |
 |
 |
| Module-wise count rates for Quadrant D Data is divided into 100 sec bins |
 |
 |
| Parameter | Plot |
|---|---|
| CZT HV Monitor | 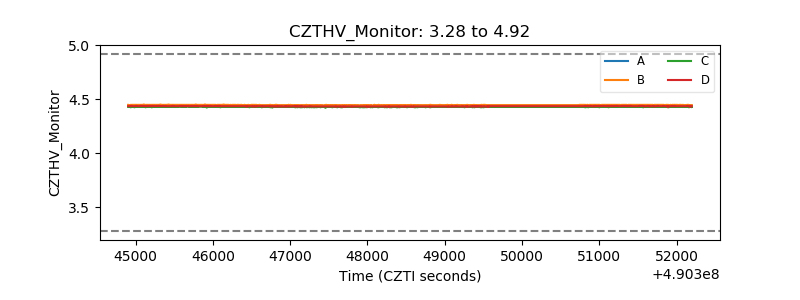 |
| D_VDD | 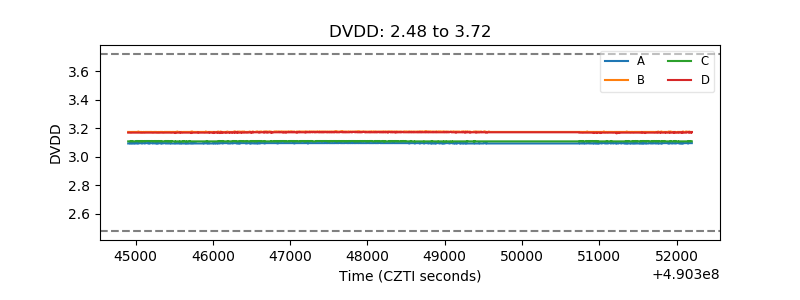 |
| Temperature 1 | 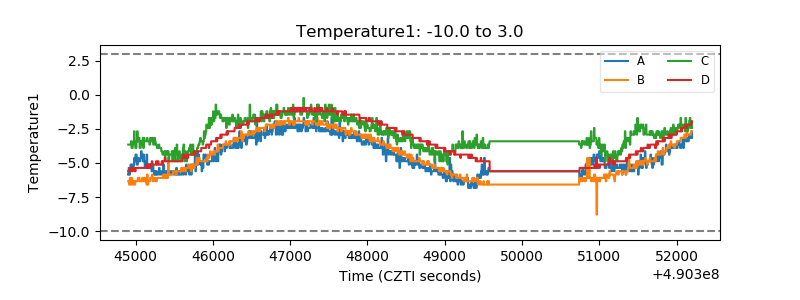 |
| Veto HV Monitor | 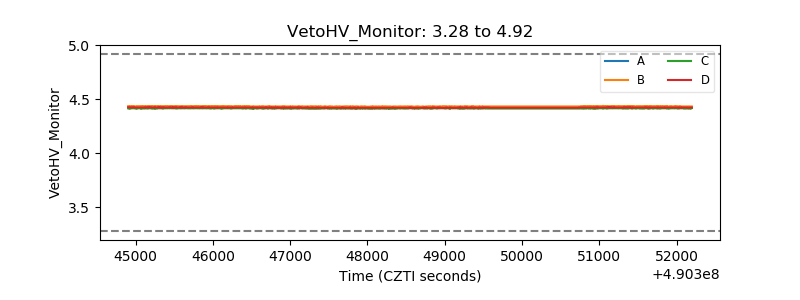 |
| Veto LLD | 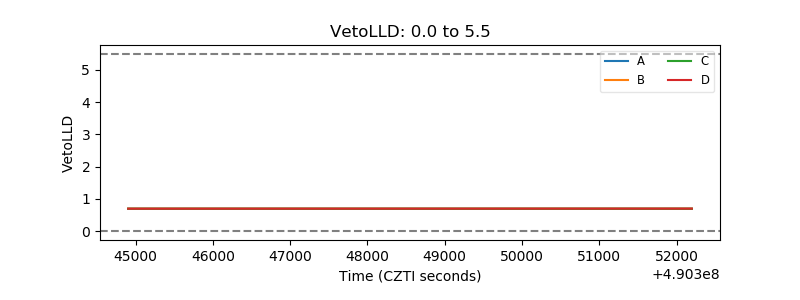 |
| Alpha Counter |  |
| _CPM_Rate | 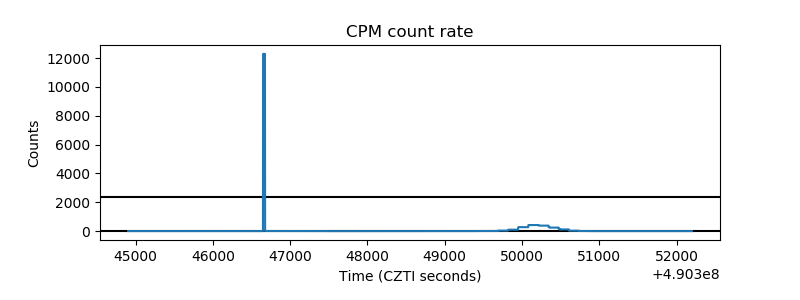 |
| CZT Counter | 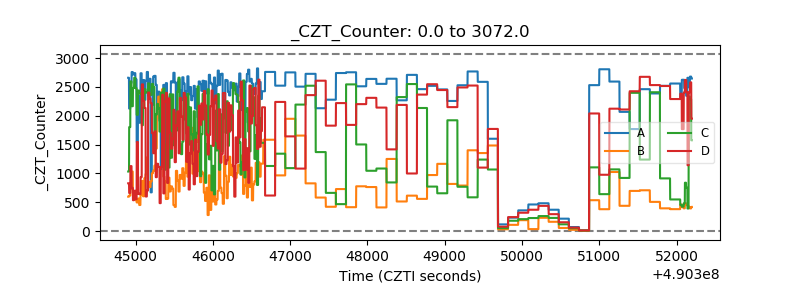 |
| +2.5 Volts monitor | 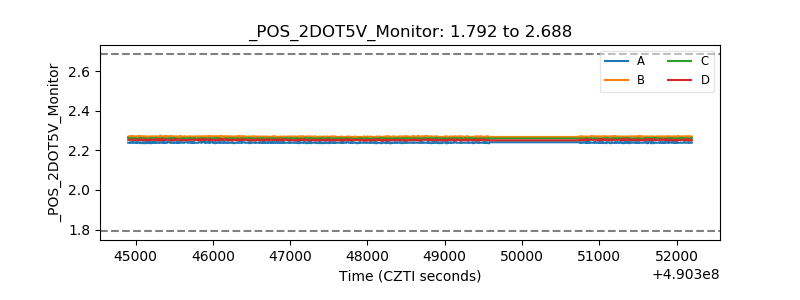 |
| +5 Volts monitor | 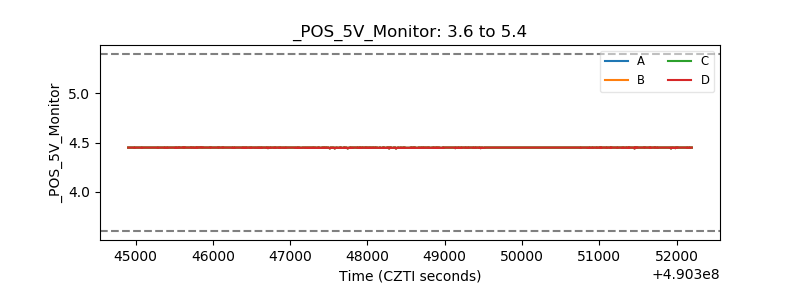 |
| _ROLL_ROT | 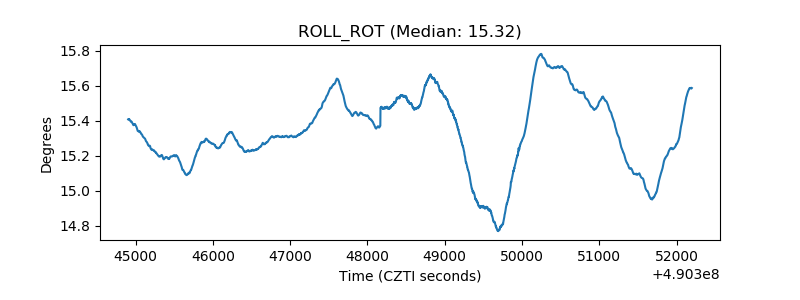 |
| _Roll_DEC | 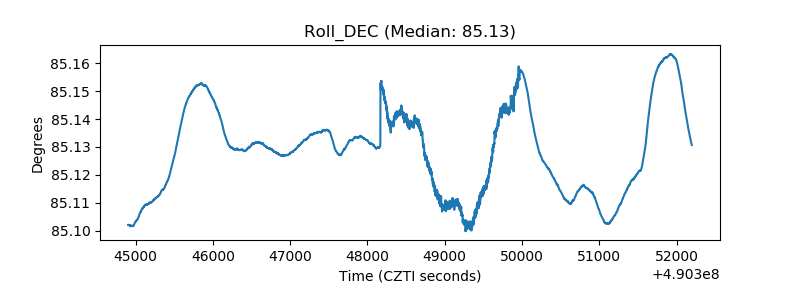 |
| _Roll_RA | 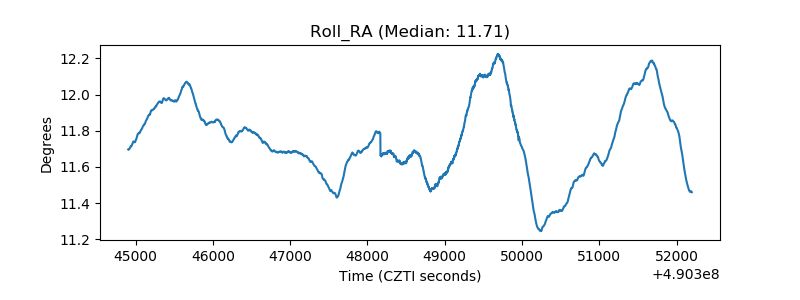 |
| Veto Counter | 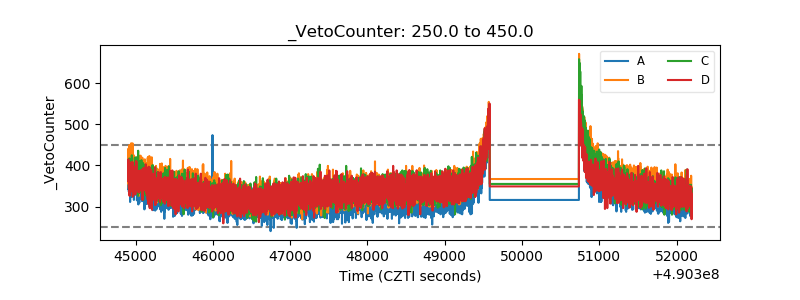 |