| Param | Original file | Final file |
|---|---|---|
| Filename | modeM0/AS1C09_011T07_9000006488_53007cztM0_level2.fits | modeM0/AS1C09_011T07_9000006488_53007cztM0_level2_quad_clean.evt |
| Size (bytes) | 1,041,226,560 | 53,205,120 |
| Size | 993.0 MB | 50.7 MB |
| Events in quadrant A | 14,653,546 | 14,201 |
| Events in quadrant B | 3,806,807 | 584,328 |
| Events in quadrant C | 9,285,097 | 316,700 |
| Events in quadrant D | 10,344,922 | 285,401 |
| Mode SS | |||
|---|---|---|---|
| Quadrant | BADHDUFLAG | Total packets | Discarded packets |
| A | 0 | 120 | 0 |
| B | 0 | 120 | 0 |
| C | 0 | 120 | 0 |
| D | 0 | 118 | 0 |
| Mode M9 | |||
|---|---|---|---|
| Quadrant | BADHDUFLAG | Total packets | Discarded packets |
| A | 0 | 10 | 0 |
| B | 0 | 10 | 0 |
| C | 0 | 10 | 0 |
| D | 0 | 10 | 0 |
| Mode M0 | |||
|---|---|---|---|
| Quadrant | BADHDUFLAG | Total packets | Discarded packets |
| A | 0 | 47618 | 84 |
| B | 0 | 15353 | 11 |
| C | 0 | 31714 | 75 |
| D | 0 | 34889 | 86 |
| Quadrant | Total seconds | Saturated seconds | Saturation percentage |
|---|---|---|---|
| A | 5866 | 5763 | 98.244119% |
| B | 5870 | 240 | 4.088586% |
| C | 5861 | 2690 | 45.896605% |
| D | 5859 | 2801 | 47.806793% |
Noise dominated data is calculated using 1-second bins in cleaned event files. If a bin has >2000 counts, and if more than 50% of those come from <1% of pixels, then it is considered to be noise-dominated and hence unusable.
| Quadrant | # 1 sec bins | Bins with >0 counts | Bins with >2000 counts | High rate bins dominated by noise | Noise dominated (total time) | Noise dominated (detector-on time) | Marked lightcurve |
|---|---|---|---|---|---|---|---|
| A | 6831 | 5866 | 5347 | 5347 | 78.28% | 91.15% | 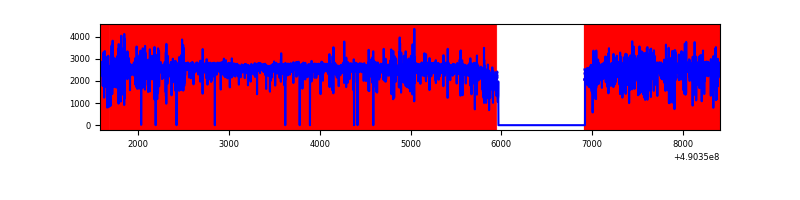 |
| B | 6832 | 5874 | 20 | 20 | 0.29% | 0.34% | 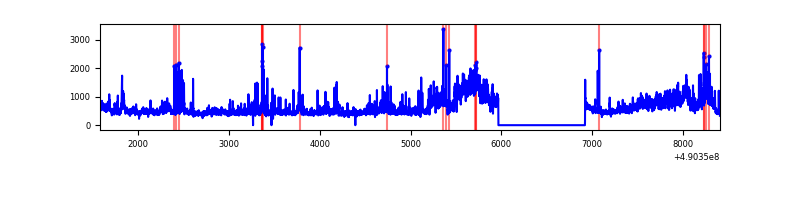 |
| C | 6832 | 5873 | 1927 | 1927 | 28.21% | 32.81% | 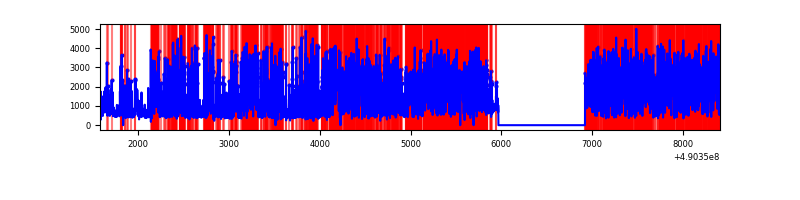 |
| D | 6832 | 5872 | 2367 | 2367 | 34.65% | 40.31% | 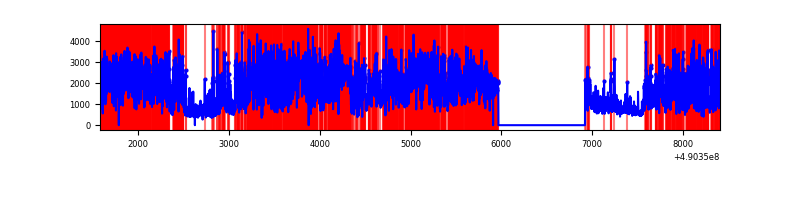 |
Top three noisy pixels from each quadrant. If the there are fewer than three noisy pixels in the level2.evt file, extra rows are filled as -1
| Pixel properties | Quadrant properties | ||||||
|---|---|---|---|---|---|---|---|
| Quadrant | DetID | PixID | Counts | Sigma | Mean | Median | Sigma |
| A | 9 | 191 | 12143873 | 219201.76 | 214 | 209 | 55.4 |
| A | 15 | 190 | 867665 | 15658.2 | 214 | 209 | 55.4 |
| A | 4 | 238 | 316541 | 5710.02 | 214 | 209 | 55.4 |
| B | 10 | 254 | 1003918 | 7855.45 | 602 | 581 | 127.7 |
| B | 10 | 247 | 115482 | 899.6 | 602 | 581 | 127.7 |
| B | 5 | 172 | 44184 | 341.38 | 602 | 581 | 127.7 |
| C | 7 | 80 | 4416446 | 35750.37 | 446 | 441 | 123.5 |
| C | 15 | 224 | 1635684 | 13238.33 | 446 | 441 | 123.5 |
| C | 12 | 254 | 818040 | 6618.98 | 446 | 441 | 123.5 |
| D | 12 | 17 | 2395523 | 18305.13 | 453 | 431 | 130.8 |
| D | 2 | 62 | 2273413 | 17371.87 | 453 | 431 | 130.8 |
| D | 8 | 176 | 2270631 | 17350.61 | 453 | 431 | 130.8 |
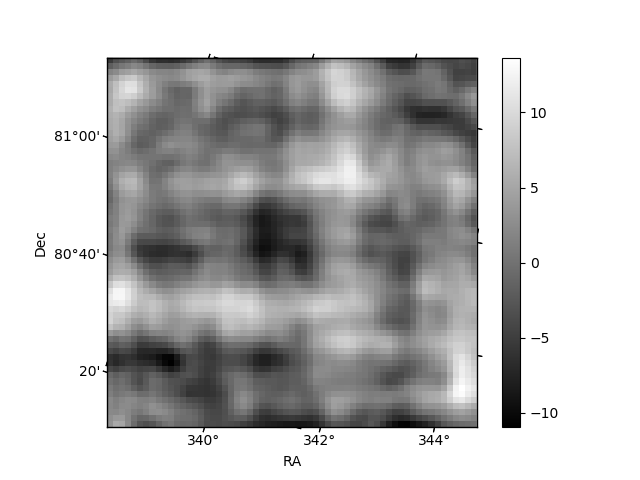
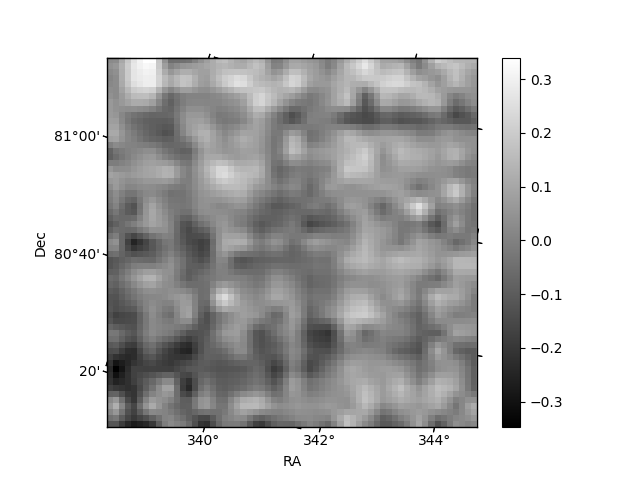
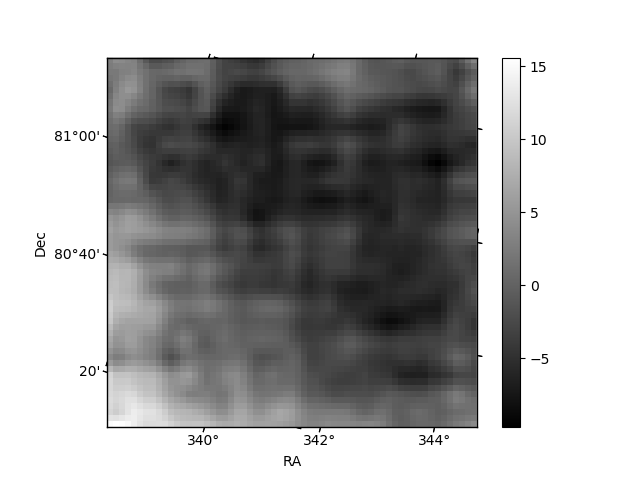
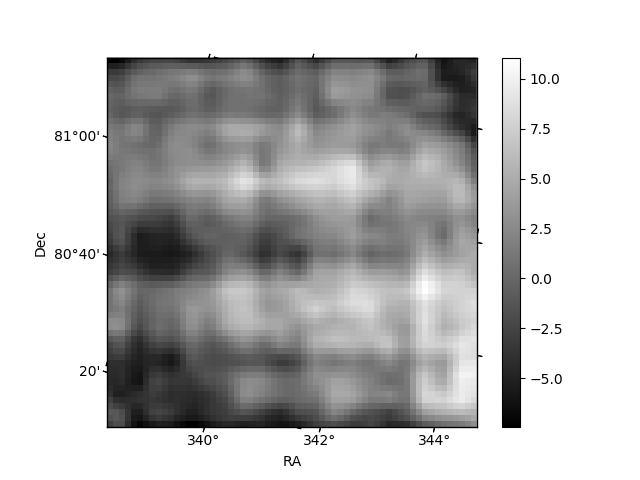
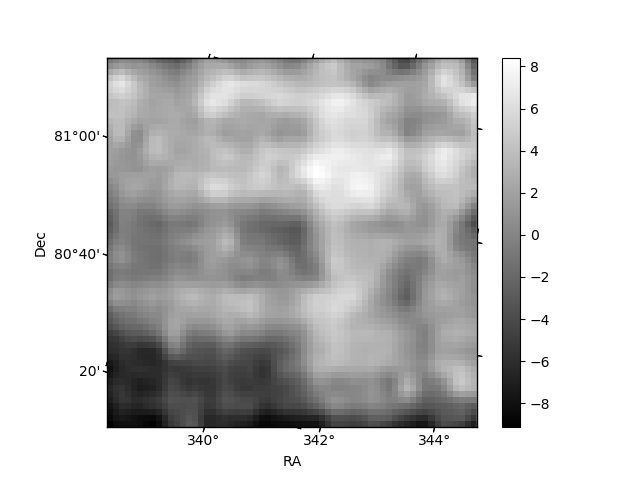
Histogram calculated using DETX and DETY for each event in the final _common_clean file
| Quadrant A | 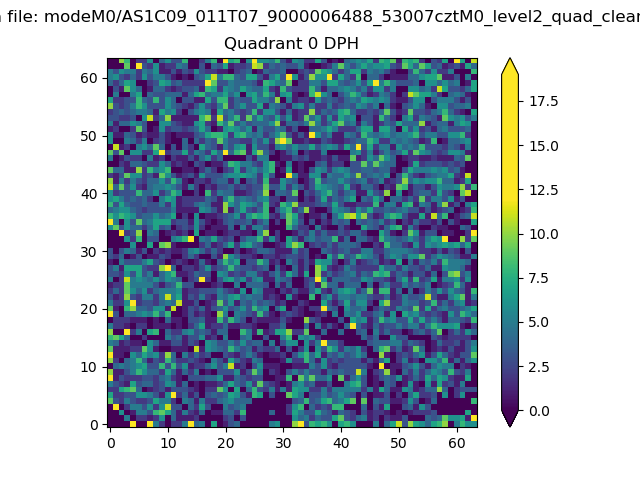 |
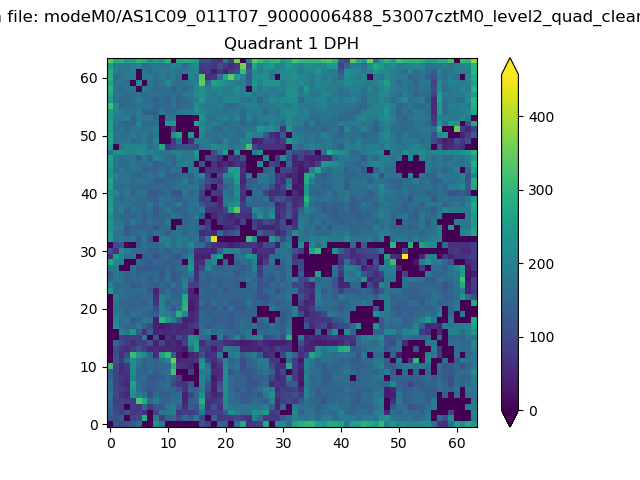 |
Quadrant B |
|---|---|---|---|
| Quadrant D | 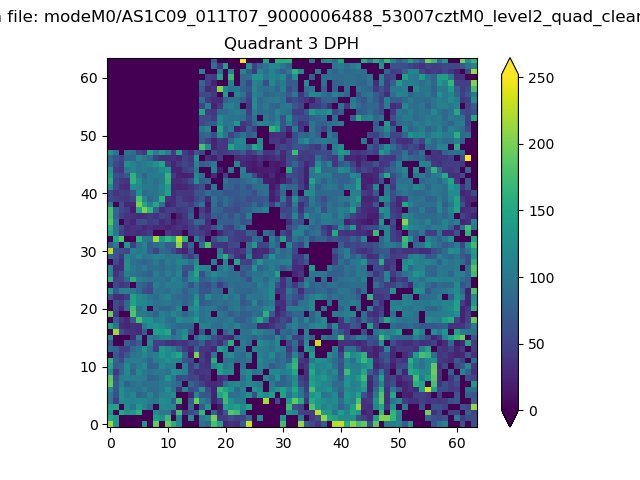 |
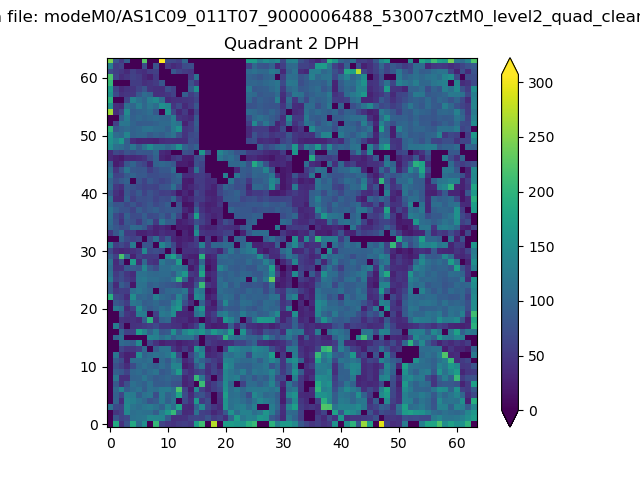 |
Quadrant C |
| Plot type | Count rate plots | Images |
|---|---|---|
| Comparison with Poisson distribution Blue bars denote a histogram of data divided into 1 sec bins. Red curve is a Poisson curve with rate = median count rate of data. |
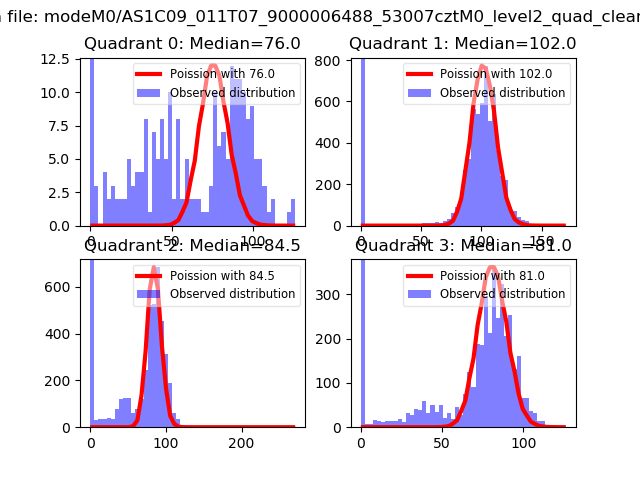 |
 |
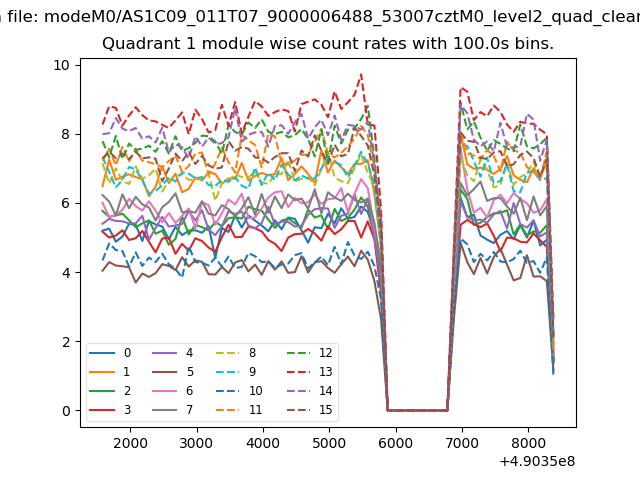
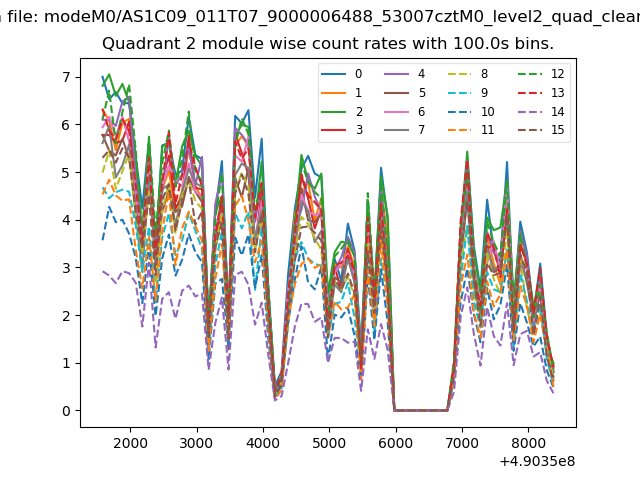
| Quadrant-wise count rates Data is divided into 100 sec bins |
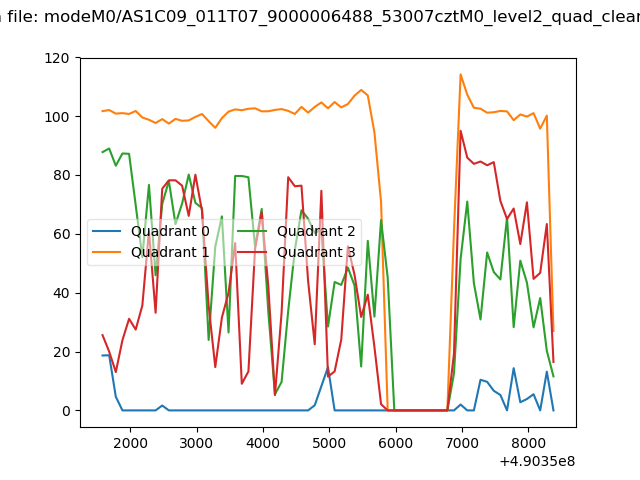 |
|
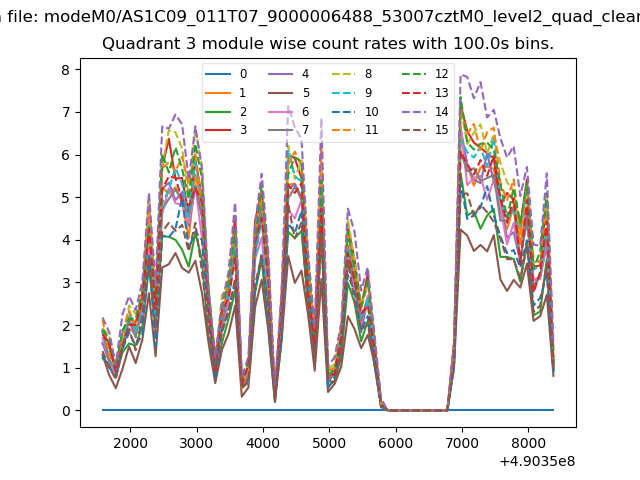
| Module-wise count rates for Quadrant A Data is divided into 100 sec bins |
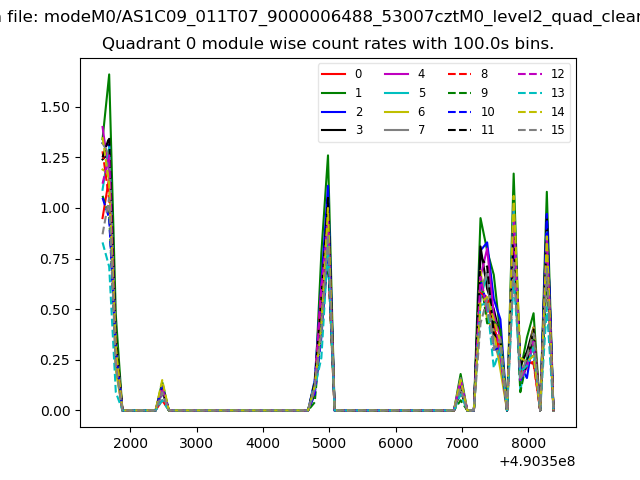 |
 |
| Module-wise count rates for Quadrant B Data is divided into 100 sec bins |
 |
 |
| Module-wise count rates for Quadrant C Data is divided into 100 sec bins |
 |
 |
| Module-wise count rates for Quadrant D Data is divided into 100 sec bins |
 |
 |
| Parameter | Plot |
|---|---|
| CZT HV Monitor | 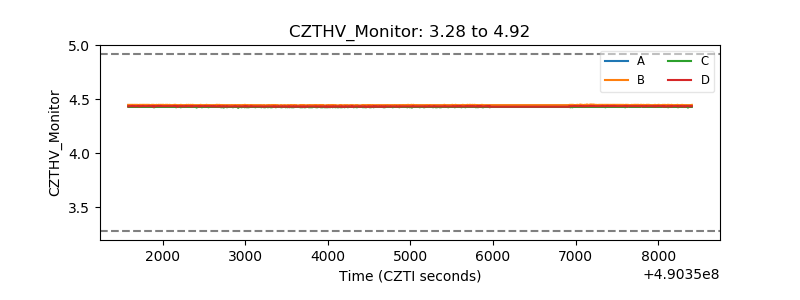 |
| D_VDD | 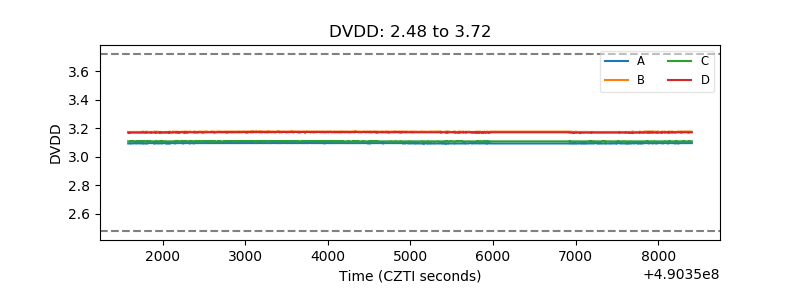 |
| Temperature 1 | 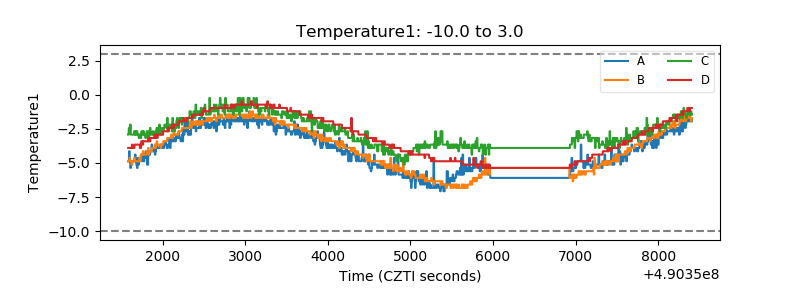 |
| Veto HV Monitor | 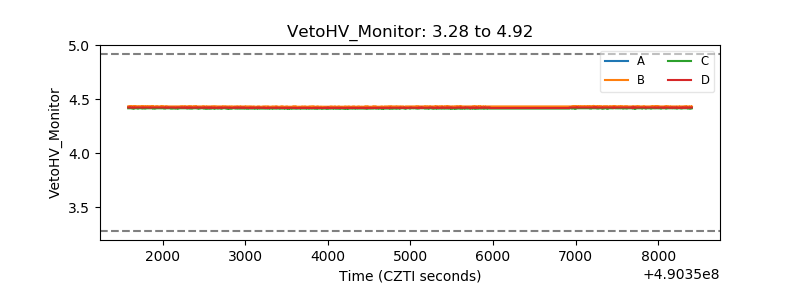 |
| Veto LLD | 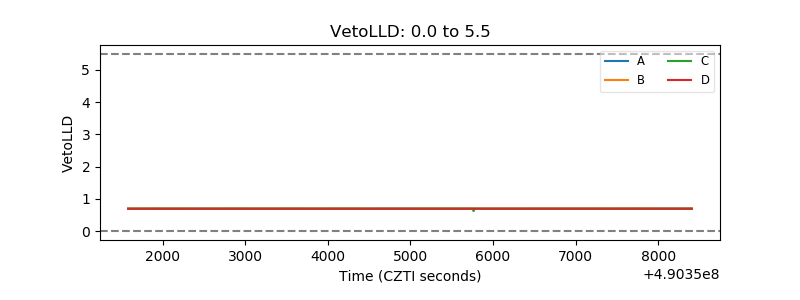 |
| Alpha Counter | 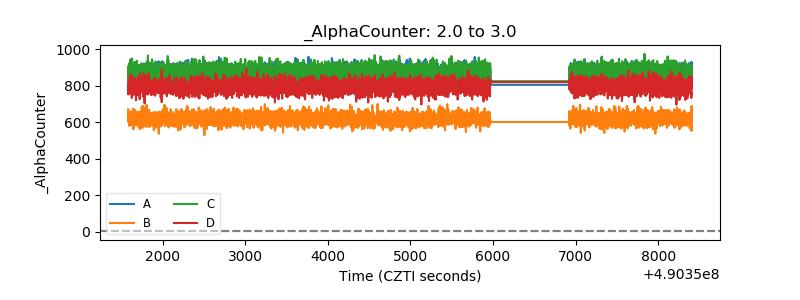 |
| _CPM_Rate | 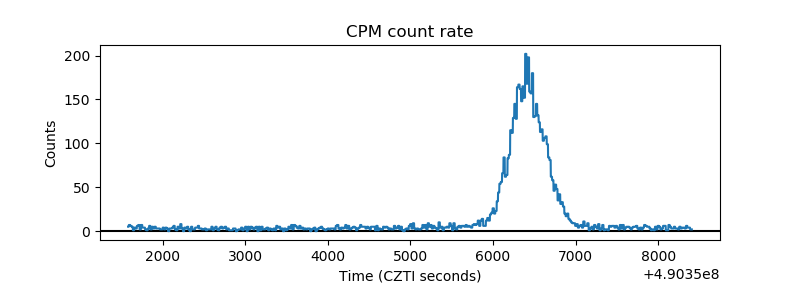 |
| CZT Counter | 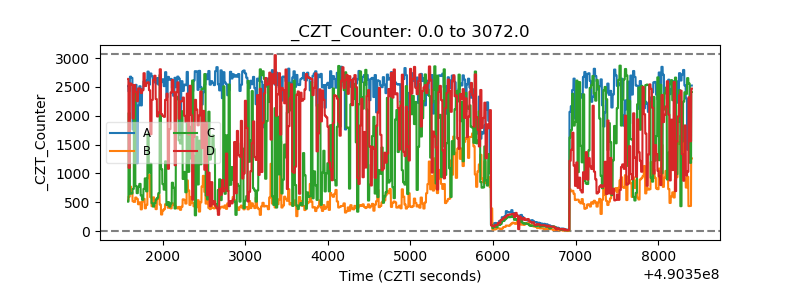 |
| +2.5 Volts monitor |  |
| +5 Volts monitor |  |
| _ROLL_ROT | 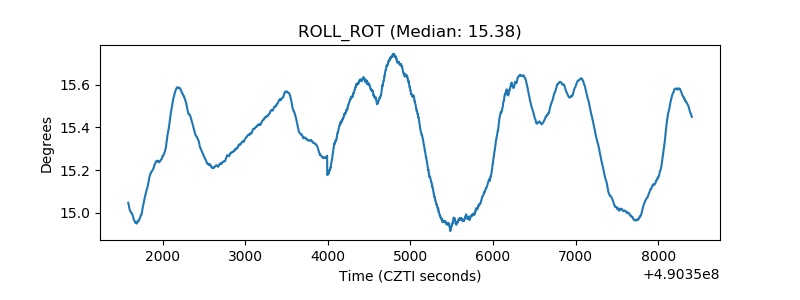 |
| _Roll_DEC | 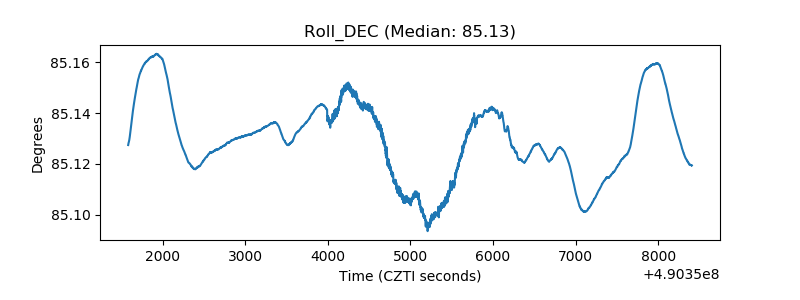 |
| _Roll_RA | 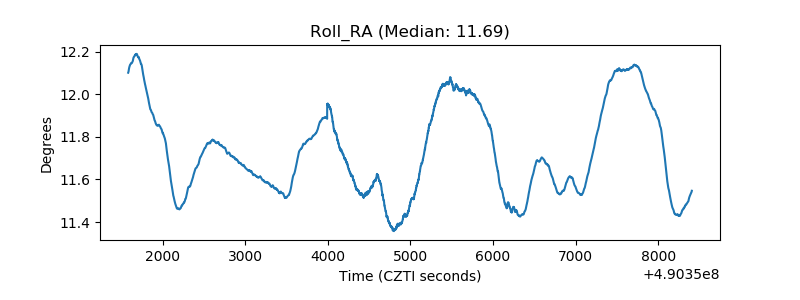 |
| Veto Counter | 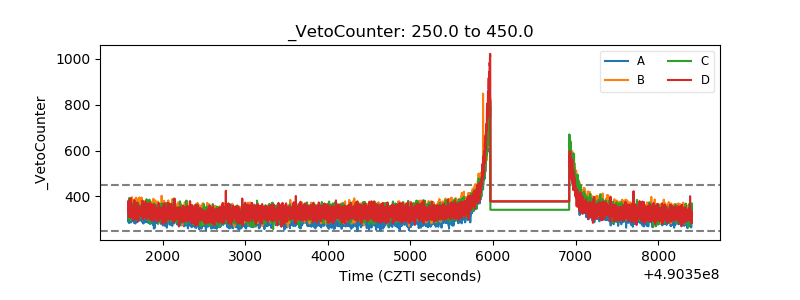 |