| Param | Original file | Final file |
|---|---|---|
| Filename | modeM0/AS1C09_011T07_9000006488_53008cztM0_level2.fits | modeM0/AS1C09_011T07_9000006488_53008cztM0_level2_quad_clean.evt |
| Size (bytes) | 1,266,217,920 | 46,589,760 |
| Size | 1.2 GB | 44.4 MB |
| Events in quadrant A | 15,464,933 | 26,349 |
| Events in quadrant B | 4,863,932 | 621,908 |
| Events in quadrant C | 12,166,584 | 172,192 |
| Events in quadrant D | 13,892,390 | 151,460 |
| Mode SS | |||
|---|---|---|---|
| Quadrant | BADHDUFLAG | Total packets | Discarded packets |
| A | 0 | 126 | 0 |
| B | 0 | 126 | 0 |
| C | 0 | 126 | 0 |
| D | 0 | 126 | 0 |
| Mode M9 | |||
|---|---|---|---|
| Quadrant | BADHDUFLAG | Total packets | Discarded packets |
| A | 0 | 8 | 0 |
| B | 0 | 8 | 0 |
| C | 0 | 8 | 0 |
| D | 0 | 8 | 0 |
| Mode M0 | |||
|---|---|---|---|
| Quadrant | BADHDUFLAG | Total packets | Discarded packets |
| A | 0 | 50177 | 1 |
| B | 0 | 18828 | 1 |
| C | 0 | 40444 | 6 |
| D | 0 | 45542 | 1 |
| Quadrant | Total seconds | Saturated seconds | Saturation percentage |
|---|---|---|---|
| A | 6284 | 6079 | 96.737747% |
| B | 6284 | 282 | 4.487588% |
| C | 6284 | 4662 | 74.188415% |
| D | 6284 | 4768 | 75.875239% |
Noise dominated data is calculated using 1-second bins in cleaned event files. If a bin has >2000 counts, and if more than 50% of those come from <1% of pixels, then it is considered to be noise-dominated and hence unusable.
| Quadrant | # 1 sec bins | Bins with >0 counts | Bins with >2000 counts | High rate bins dominated by noise | Noise dominated (total time) | Noise dominated (detector-on time) | Marked lightcurve |
|---|---|---|---|---|---|---|---|
| A | 7023 | 6283 | 5650 | 5650 | 80.45% | 89.93% | 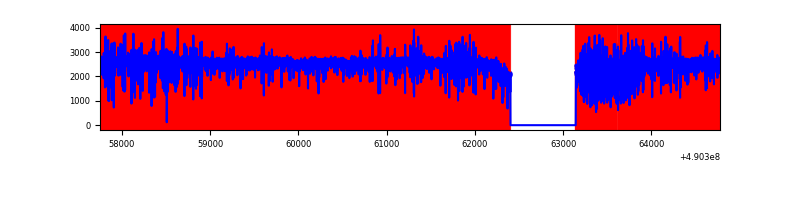 |
| B | 7024 | 6285 | 61 | 61 | 0.87% | 0.97% | 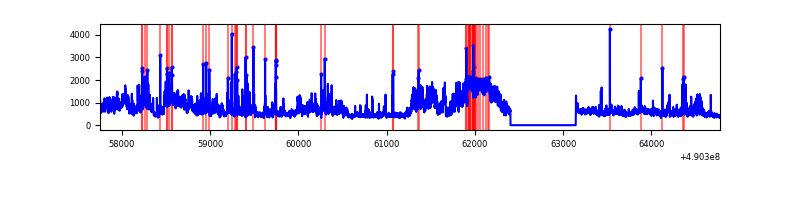 |
| C | 7024 | 6284 | 3121 | 3121 | 44.43% | 49.67% | 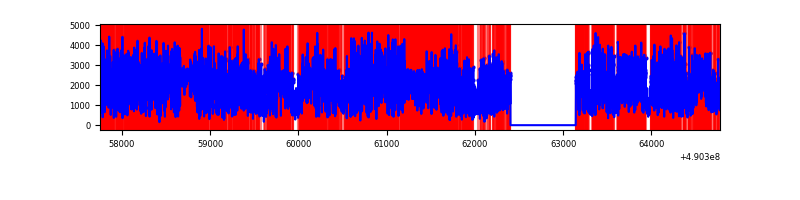 |
| D | 7024 | 6284 | 4192 | 4192 | 59.68% | 66.71% | 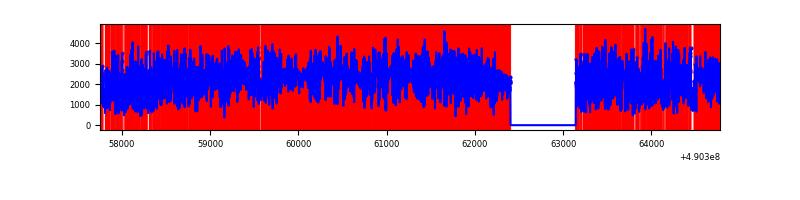 |
Top three noisy pixels from each quadrant. If the there are fewer than three noisy pixels in the level2.evt file, extra rows are filled as -1
| Pixel properties | Quadrant properties | ||||||
|---|---|---|---|---|---|---|---|
| Quadrant | DetID | PixID | Counts | Sigma | Mean | Median | Sigma |
| A | 9 | 191 | 12923590 | 203752.55 | 240 | 232 | 63.4 |
| A | 15 | 190 | 901639 | 14211.78 | 240 | 232 | 63.4 |
| A | 4 | 238 | 371623 | 5855.43 | 240 | 232 | 63.4 |
| B | 10 | 254 | 1826582 | 13482.93 | 635 | 614 | 135.4 |
| B | 10 | 247 | 88027 | 645.46 | 635 | 614 | 135.4 |
| B | 5 | 185 | 54879 | 400.69 | 635 | 614 | 135.4 |
| C | 7 | 80 | 6174638 | 70305.47 | 318 | 315 | 87.8 |
| C | 12 | 254 | 2205126 | 25105.63 | 318 | 315 | 87.8 |
| C | 15 | 224 | 1260218 | 14346.2 | 318 | 315 | 87.8 |
| D | 12 | 17 | 5170188 | 46977.23 | 376 | 358 | 110.0 |
| D | 2 | 62 | 4047186 | 36772.73 | 376 | 358 | 110.0 |
| D | 8 | 176 | 2119474 | 19255.99 | 376 | 358 | 110.0 |
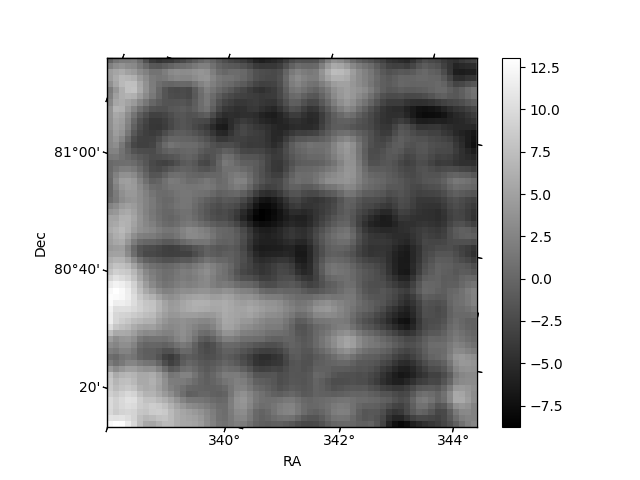
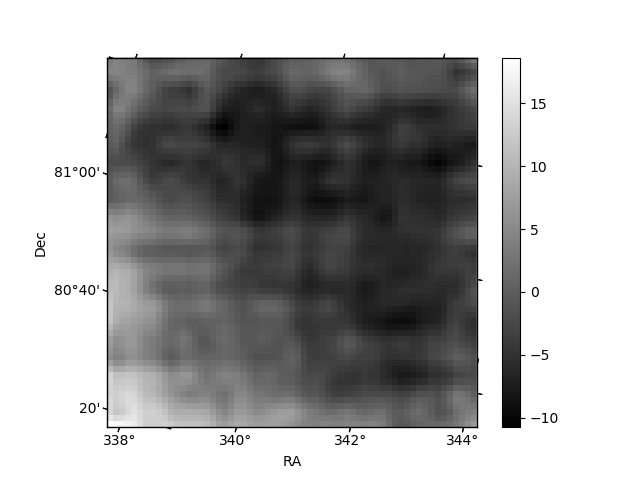
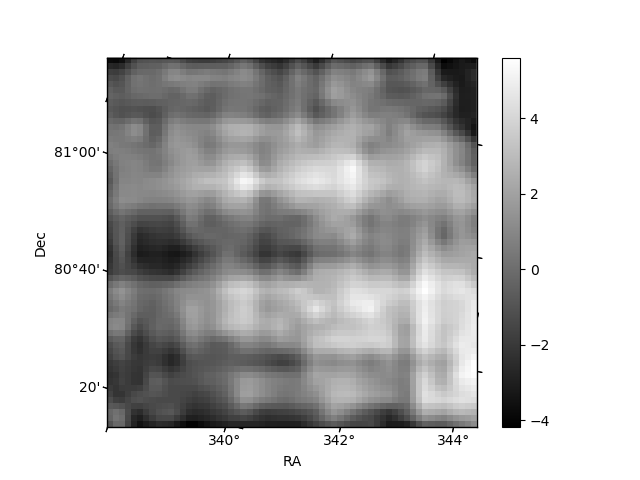
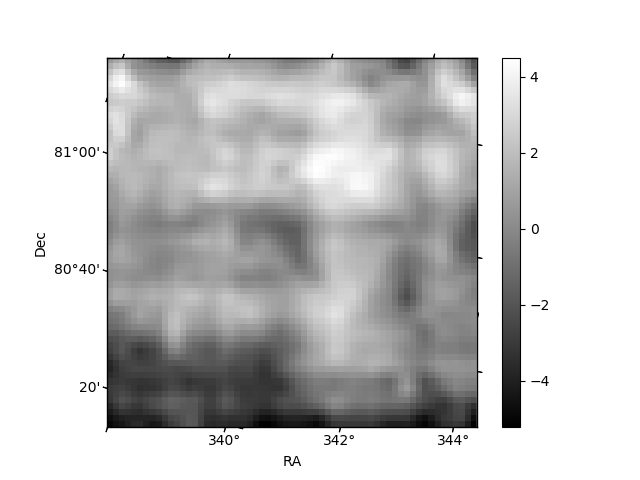
Histogram calculated using DETX and DETY for each event in the final _common_clean file
| Quadrant A | 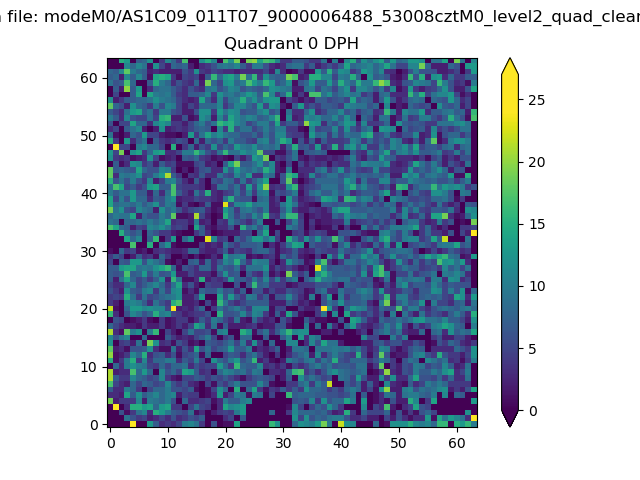 |
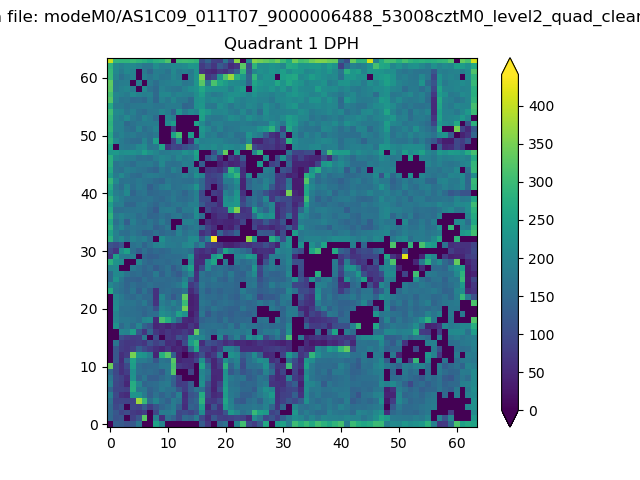 |
Quadrant B |
|---|---|---|---|
| Quadrant D | 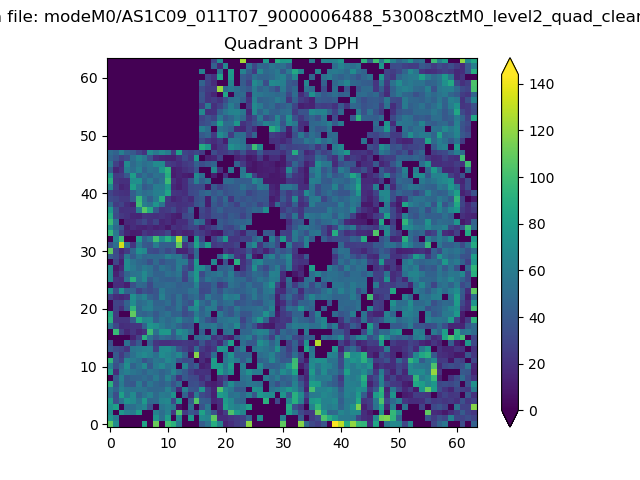 |
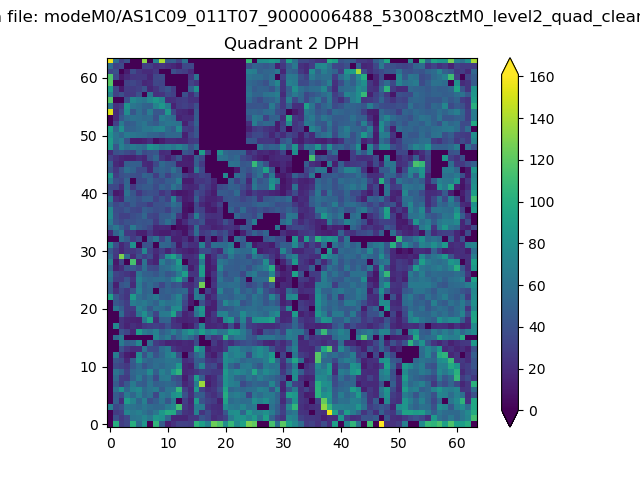 |
Quadrant C |
| Plot type | Count rate plots | Images |
|---|---|---|
| Comparison with Poisson distribution Blue bars denote a histogram of data divided into 1 sec bins. Red curve is a Poisson curve with rate = median count rate of data. |
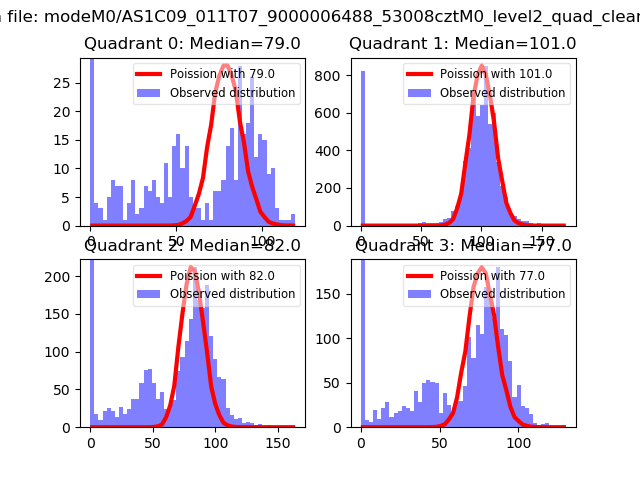 |
 |
| Quadrant-wise count rates Data is divided into 100 sec bins |
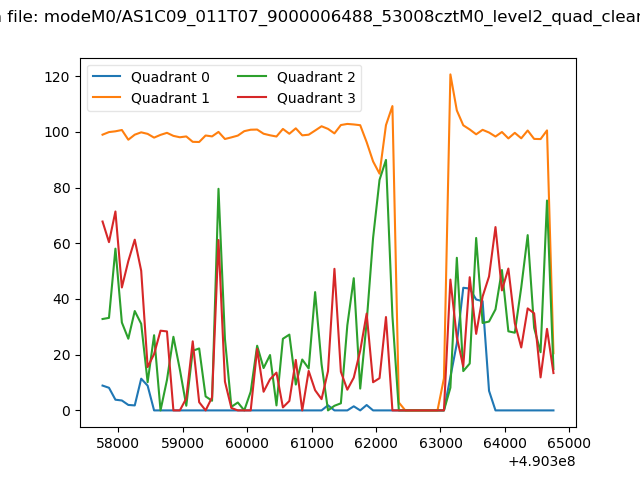 |
|
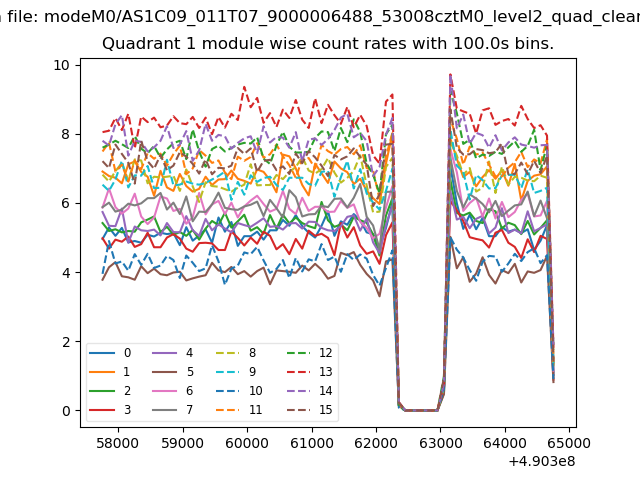
| Module-wise count rates for Quadrant A Data is divided into 100 sec bins |
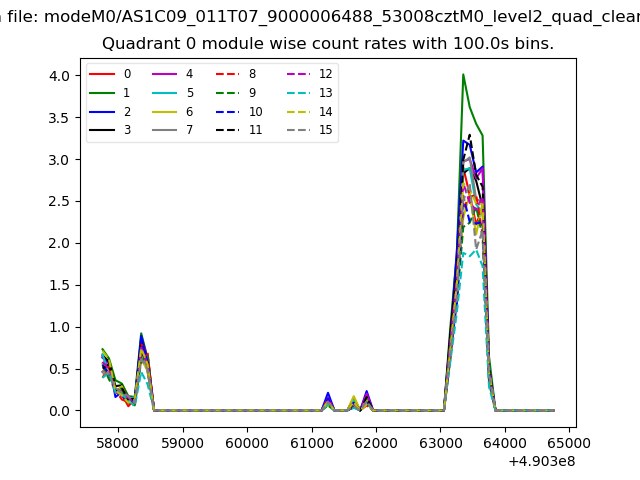 |
 |
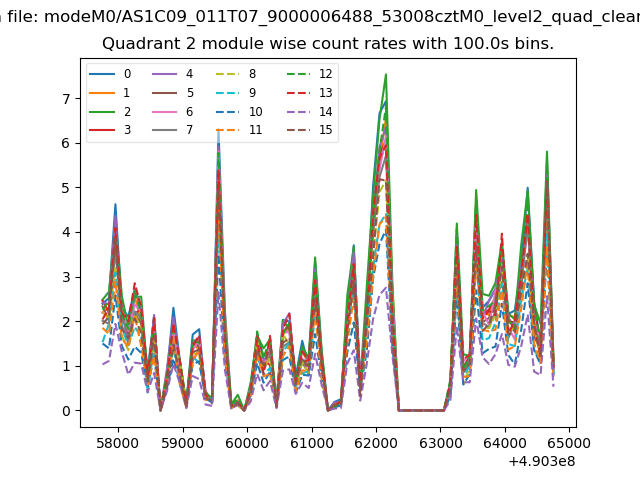
| Module-wise count rates for Quadrant B Data is divided into 100 sec bins |
 |
 |
| Module-wise count rates for Quadrant C Data is divided into 100 sec bins |
 |
 |
| Module-wise count rates for Quadrant D Data is divided into 100 sec bins |
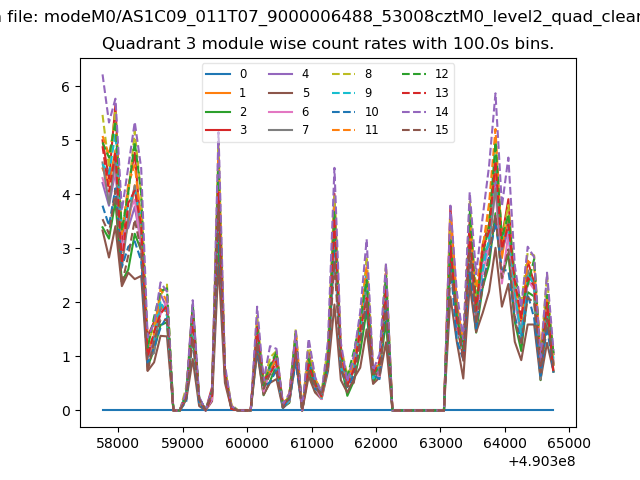 |
 |
| Parameter | Plot |
|---|---|
| CZT HV Monitor |  |
| D_VDD | 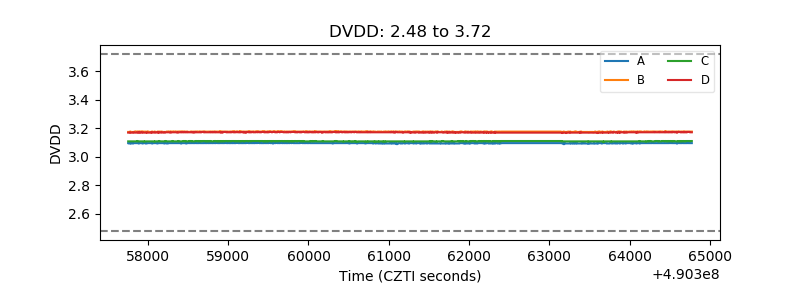 |
| Temperature 1 | 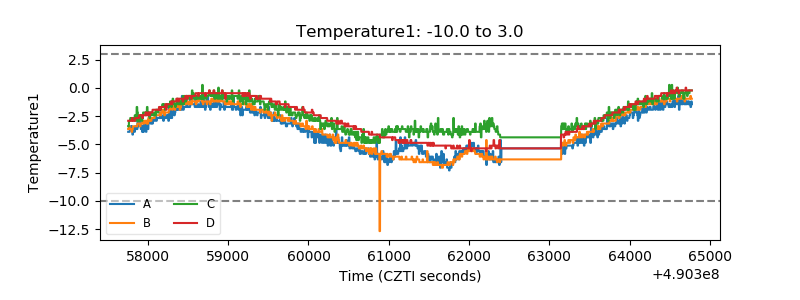 |
| Veto HV Monitor | 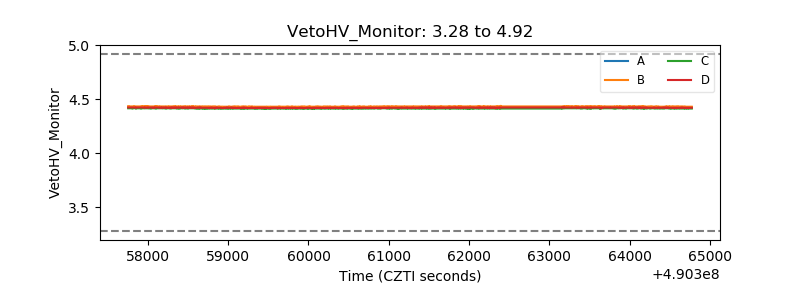 |
| Veto LLD | 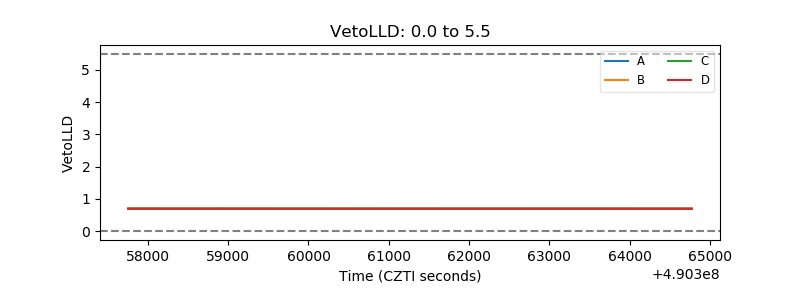 |
| Alpha Counter |  |
| _CPM_Rate | 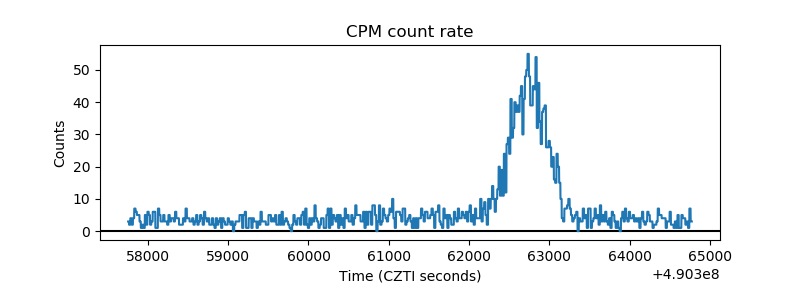 |
| CZT Counter | 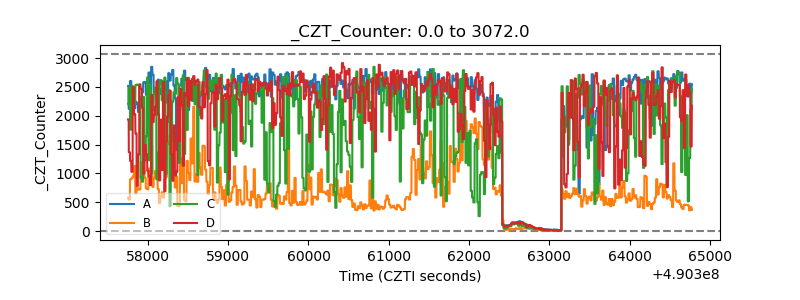 |
| +2.5 Volts monitor |  |
| +5 Volts monitor |  |
| _ROLL_ROT | 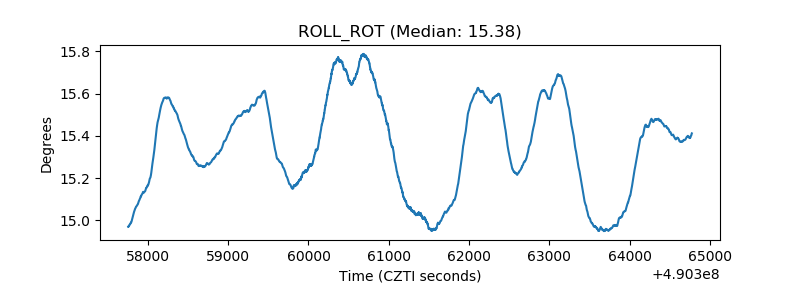 |
| _Roll_DEC | 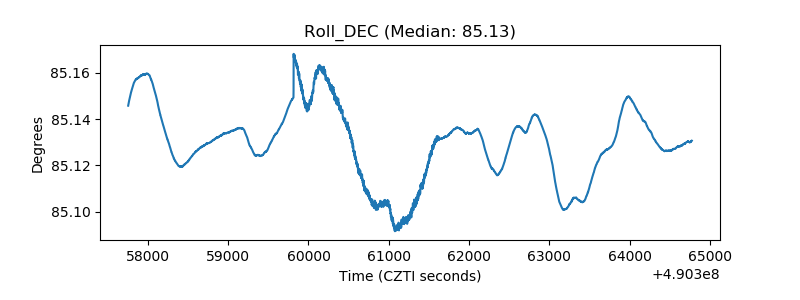 |
| _Roll_RA | 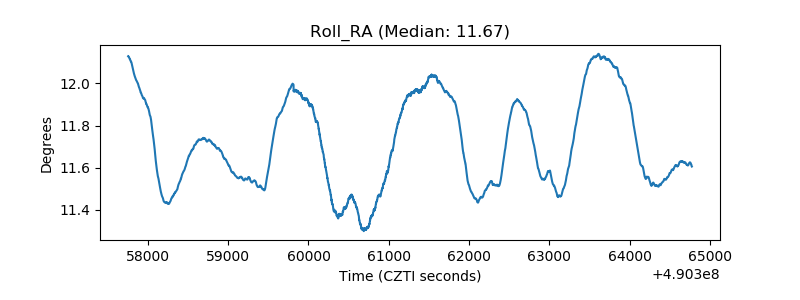 |
| Veto Counter | 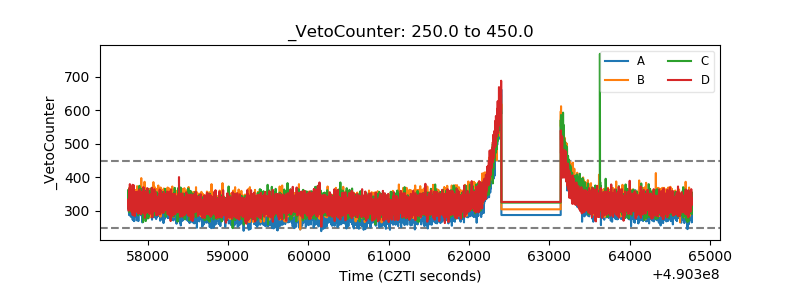 |