| Param | Original file | Final file |
|---|---|---|
| Filename | modeM0/AS1C09_011T07_9000006488_53010cztM0_level2.fits | modeM0/AS1C09_011T07_9000006488_53010cztM0_level2_quad_clean.evt |
| Size (bytes) | 1,315,059,840 | 55,944,000 |
| Size | 1.2 GB | 53.4 MB |
| Events in quadrant A | 16,936,413 | 36,543 |
| Events in quadrant B | 3,592,667 | 691,064 |
| Events in quadrant C | 11,581,079 | 403,452 |
| Events in quadrant D | 16,035,209 | 79,568 |
| Mode SS | |||
|---|---|---|---|
| Quadrant | BADHDUFLAG | Total packets | Discarded packets |
| A | 0 | 138 | 0 |
| B | 0 | 138 | 0 |
| C | 0 | 138 | 0 |
| D | 0 | 138 | 0 |
| Mode M0 | |||
|---|---|---|---|
| Quadrant | BADHDUFLAG | Total packets | Discarded packets |
| A | 0 | 54978 | 0 |
| B | 0 | 15557 | 0 |
| C | 0 | 39268 | 5 |
| D | 0 | 52346 | 0 |
| Quadrant | Total seconds | Saturated seconds | Saturation percentage |
|---|---|---|---|
| A | 6931 | 6682 | 96.407445% |
| B | 6931 | 91 | 1.312942% |
| C | 6931 | 2906 | 41.927572% |
| D | 6931 | 6229 | 89.871591% |
Noise dominated data is calculated using 1-second bins in cleaned event files. If a bin has >2000 counts, and if more than 50% of those come from <1% of pixels, then it is considered to be noise-dominated and hence unusable.
| Quadrant | # 1 sec bins | Bins with >0 counts | Bins with >2000 counts | High rate bins dominated by noise | Noise dominated (total time) | Noise dominated (detector-on time) | Marked lightcurve |
|---|---|---|---|---|---|---|---|
| A | 6930 | 6930 | 6150 | 6150 | 88.74% | 88.74% | 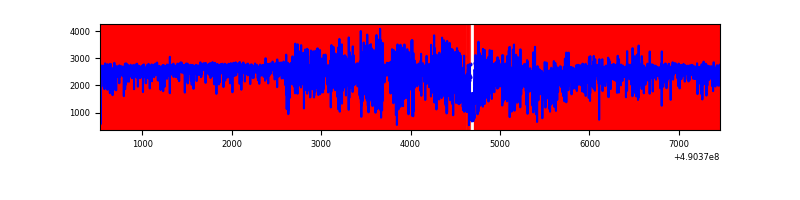 |
| B | 6931 | 6931 | 50 | 50 | 0.72% | 0.72% | 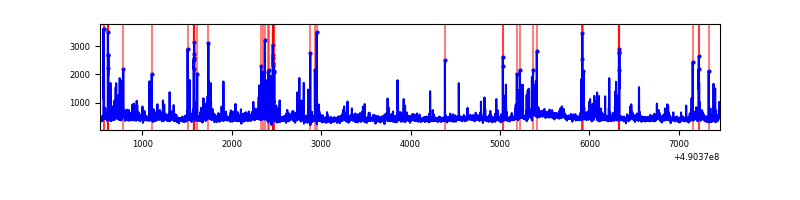 |
| C | 6931 | 6931 | 2390 | 2390 | 34.48% | 34.48% | 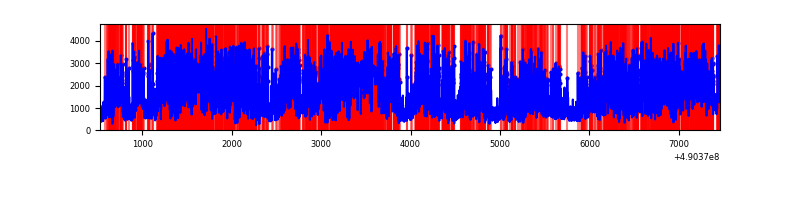 |
| D | 6930 | 6930 | 5366 | 5366 | 77.43% | 77.43% | 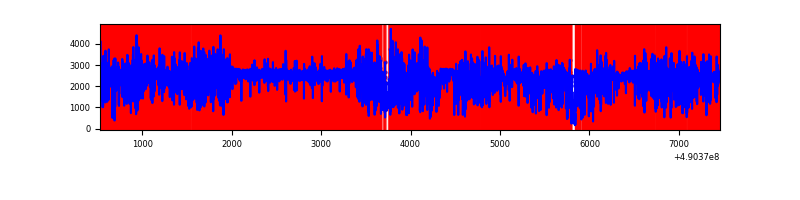 |
Top three noisy pixels from each quadrant. If the there are fewer than three noisy pixels in the level2.evt file, extra rows are filled as -1
| Pixel properties | Quadrant properties | ||||||
|---|---|---|---|---|---|---|---|
| Quadrant | DetID | PixID | Counts | Sigma | Mean | Median | Sigma |
| A | 9 | 191 | 14097562 | 199097.98 | 276 | 269 | 70.8 |
| A | 15 | 190 | 1293368 | 18262.61 | 276 | 269 | 70.8 |
| A | 12 | 80 | 193021 | 2722.26 | 276 | 269 | 70.8 |
| B | 10 | 63 | 130114 | 858.21 | 709 | 683 | 150.8 |
| B | 4 | 81 | 115482 | 761.19 | 709 | 683 | 150.8 |
| B | 10 | 191 | 99210 | 653.3 | 709 | 683 | 150.8 |
| C | 15 | 224 | 5242215 | 32362.11 | 583 | 576 | 162.0 |
| C | 12 | 254 | 1101706 | 6798.42 | 583 | 576 | 162.0 |
| C | 9 | 38 | 964252 | 5949.78 | 583 | 576 | 162.0 |
| D | 2 | 62 | 5831324 | 58071.51 | 334 | 317 | 100.4 |
| D | 8 | 176 | 2607885 | 25969.0 | 334 | 317 | 100.4 |
| D | 12 | 17 | 2401594 | 23914.53 | 334 | 317 | 100.4 |
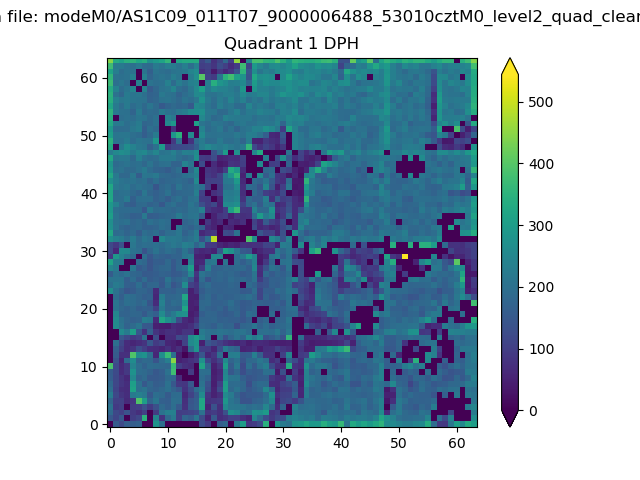
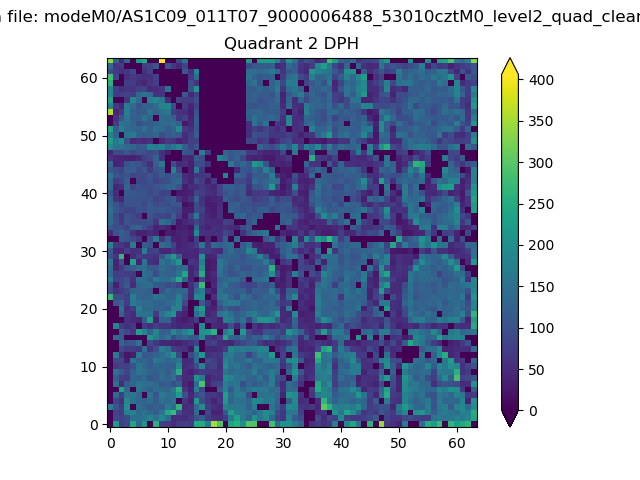
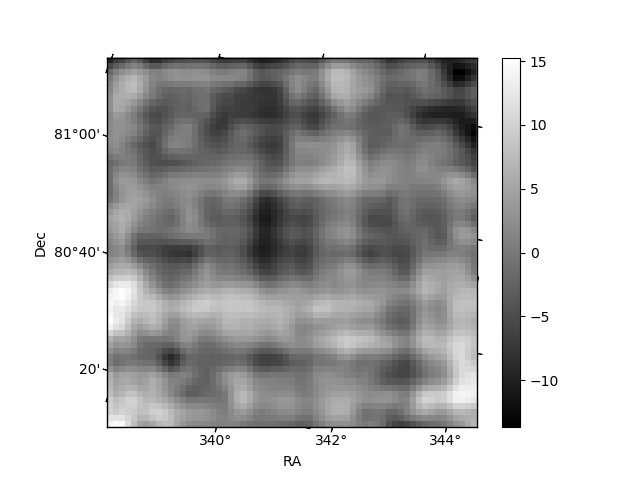
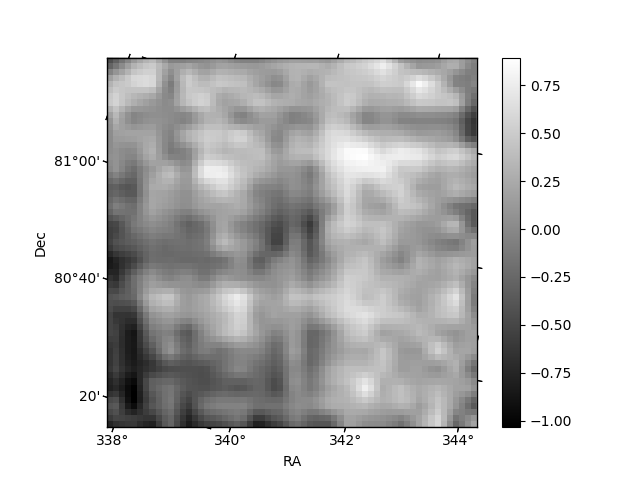
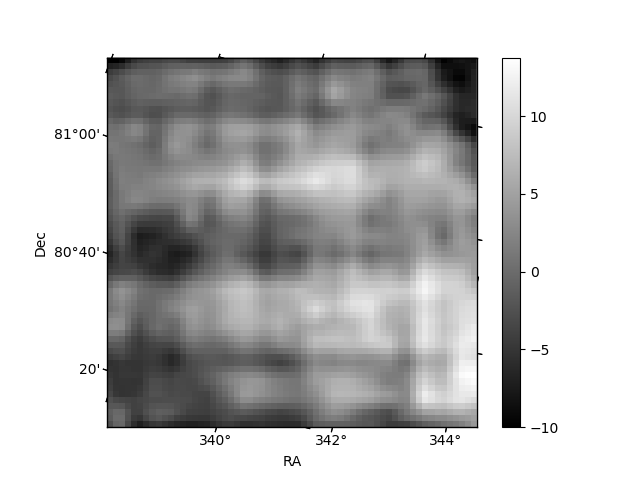
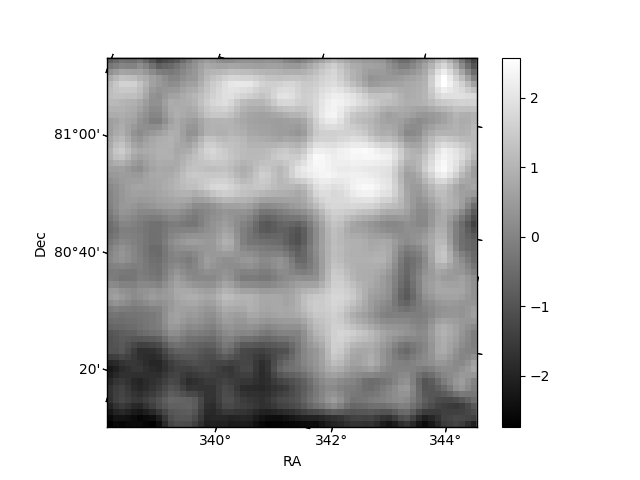
Histogram calculated using DETX and DETY for each event in the final _common_clean file
| Quadrant A |  |
 |
Quadrant B |
|---|---|---|---|
| Quadrant D | 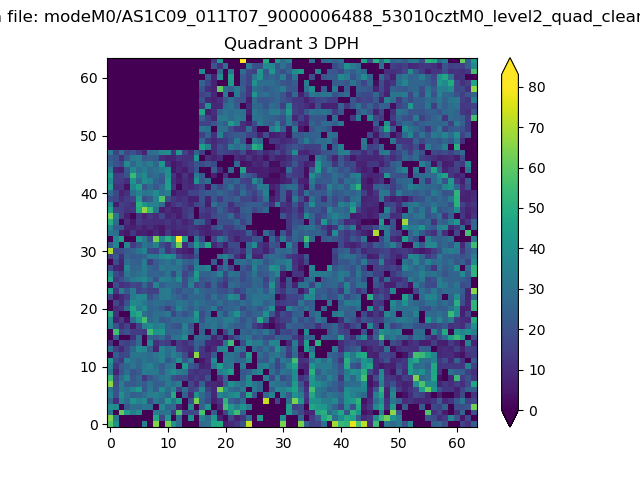 |
 |
Quadrant C |
| Plot type | Count rate plots | Images |
|---|---|---|
| Comparison with Poisson distribution Blue bars denote a histogram of data divided into 1 sec bins. Red curve is a Poisson curve with rate = median count rate of data. |
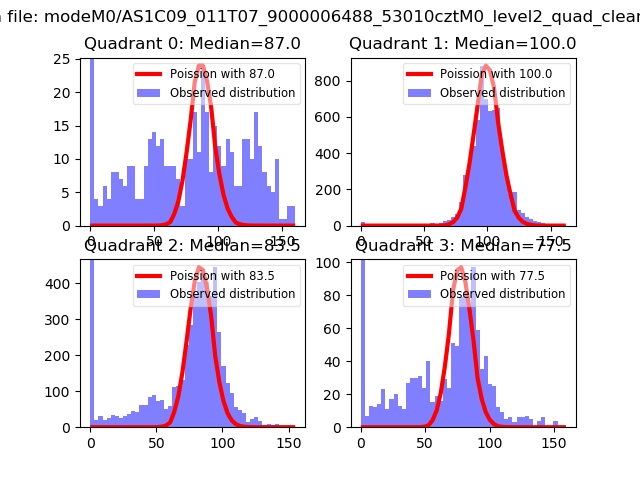 |
 |
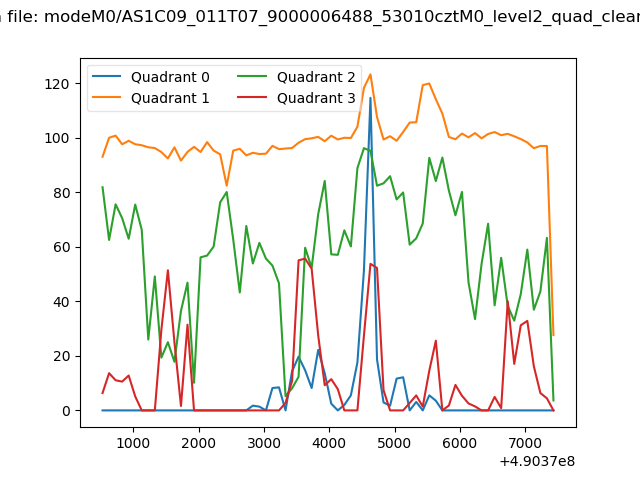
| Quadrant-wise count rates Data is divided into 100 sec bins |
 |
|
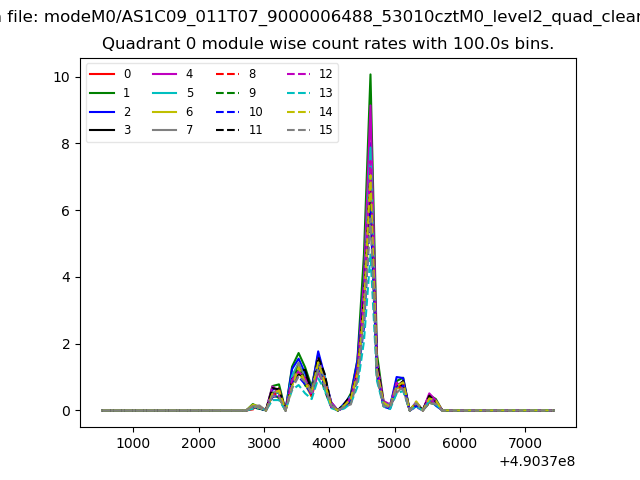
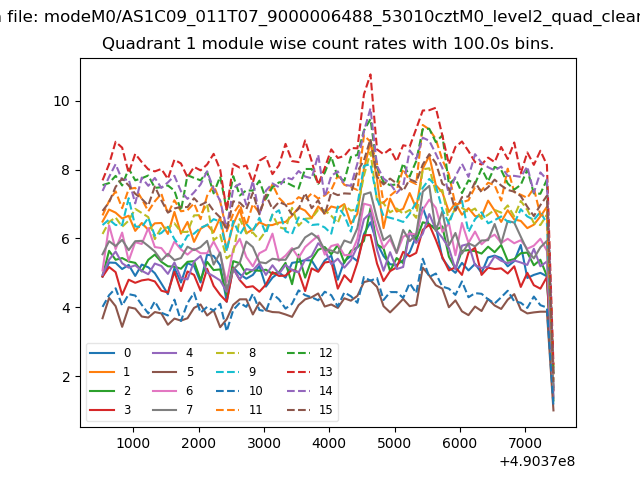
| Module-wise count rates for Quadrant A Data is divided into 100 sec bins |
 |
 |
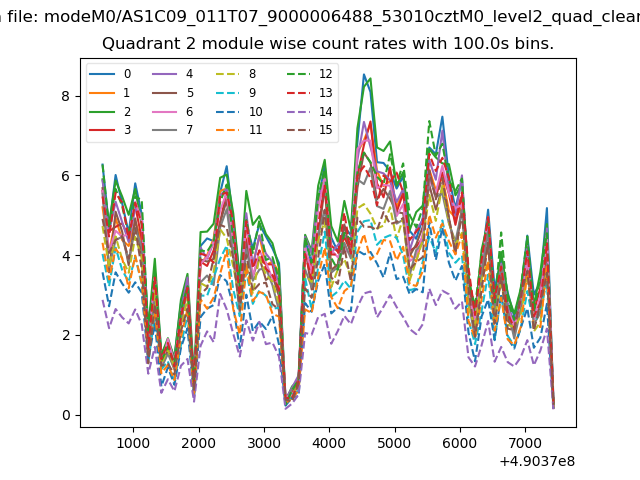
| Module-wise count rates for Quadrant B Data is divided into 100 sec bins |
 |
 |
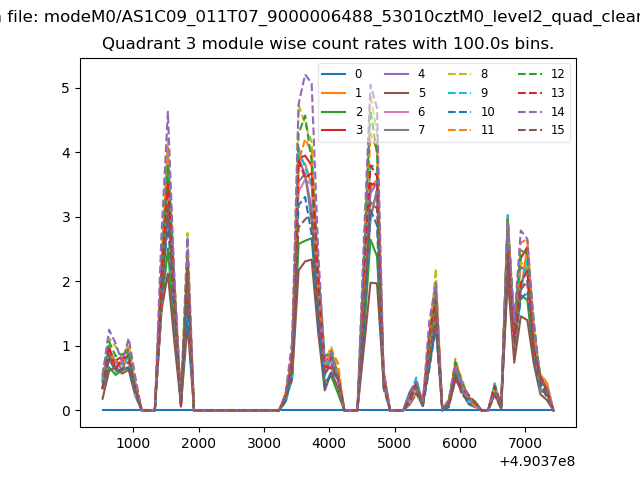
| Module-wise count rates for Quadrant C Data is divided into 100 sec bins |
 |
 |
| Module-wise count rates for Quadrant D Data is divided into 100 sec bins |
 |
 |
| Parameter | Plot |
|---|---|
| CZT HV Monitor | 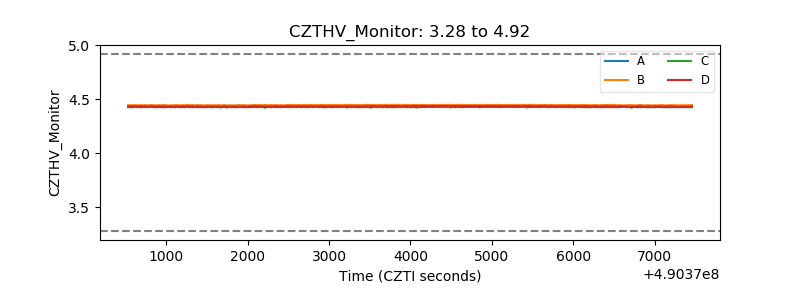 |
| D_VDD | 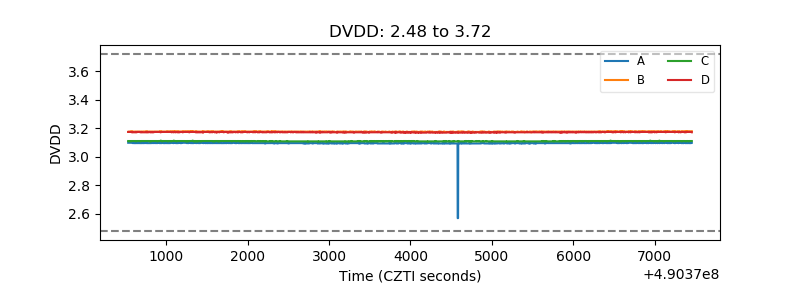 |
| Temperature 1 | 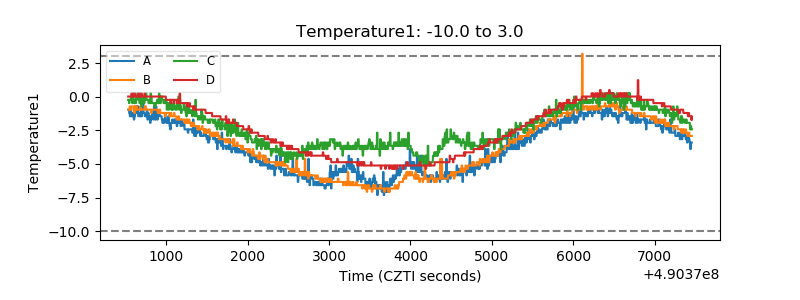 |
| Veto HV Monitor | 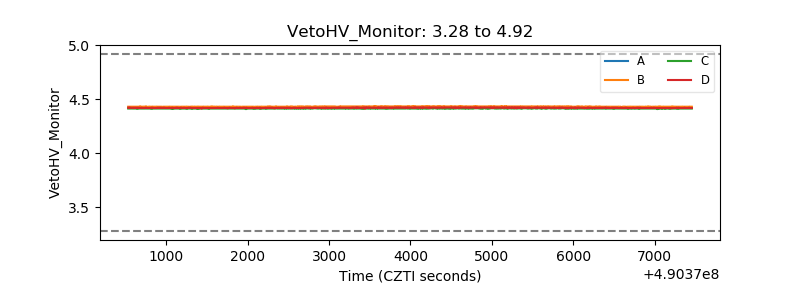 |
| Veto LLD | 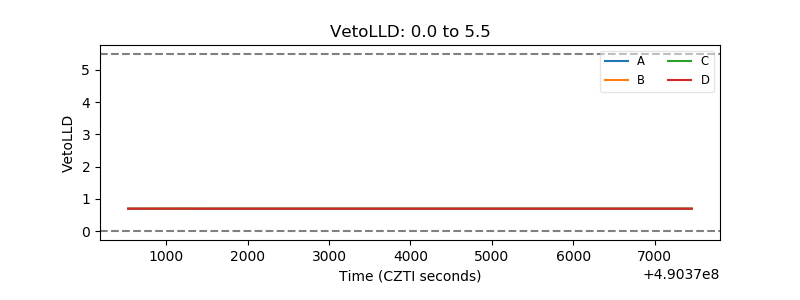 |
| Alpha Counter |  |
| _CPM_Rate | 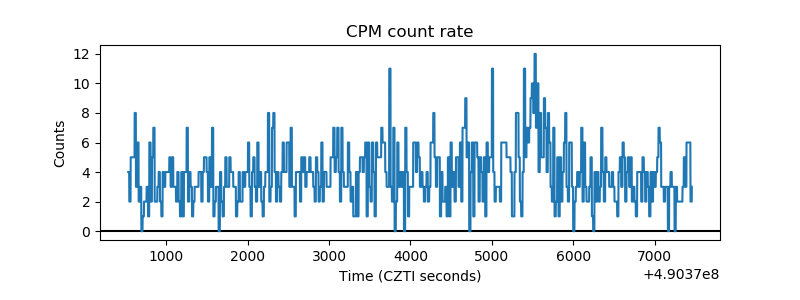 |
| CZT Counter | 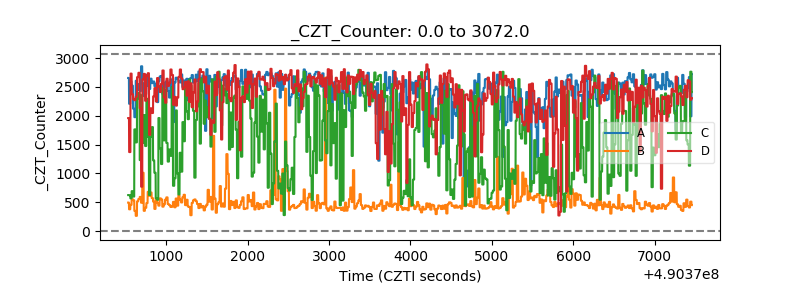 |
| +2.5 Volts monitor |  |
| +5 Volts monitor |  |
| _ROLL_ROT | 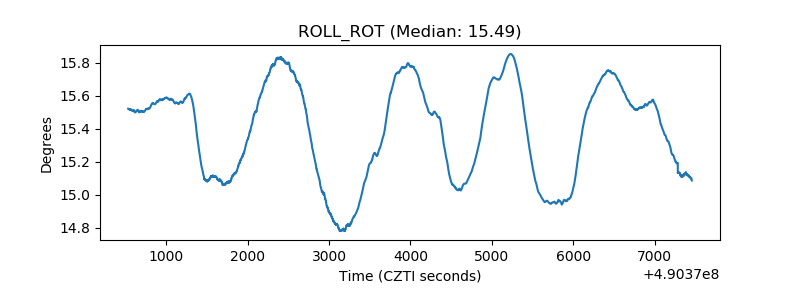 |
| _Roll_DEC | 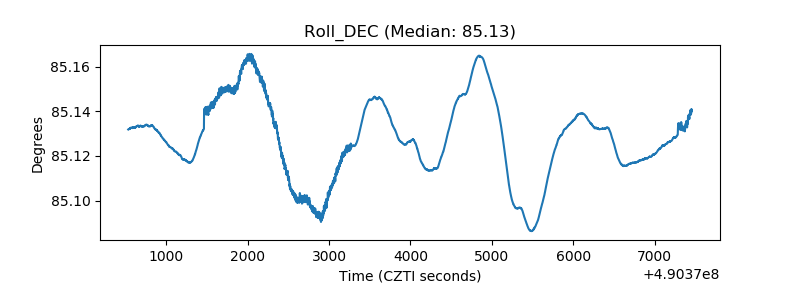 |
| _Roll_RA | 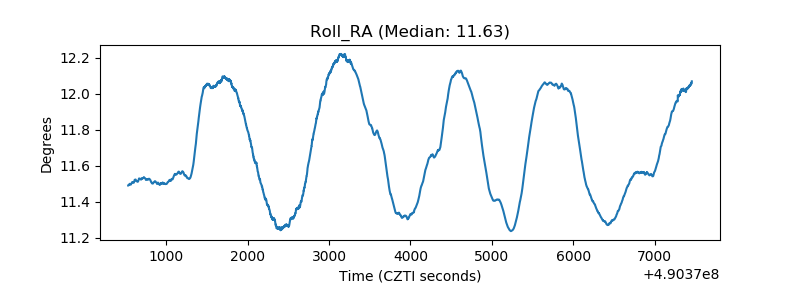 |
| Veto Counter | 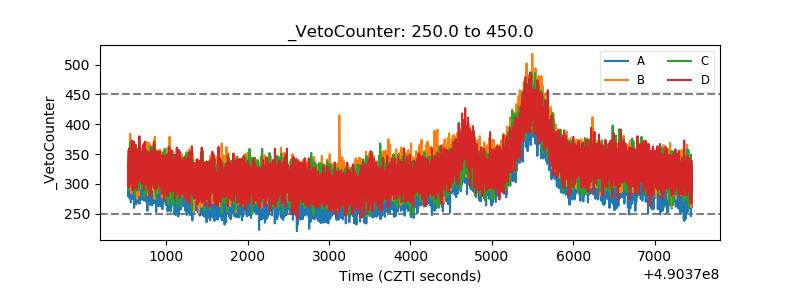 |