| Param | Original file | Final file |
|---|---|---|
| Filename | modeM0/AS1C09_011T07_9000006488_53011cztM0_level2.fits | modeM0/AS1C09_011T07_9000006488_53011cztM0_level2_quad_clean.evt |
| Size (bytes) | 1,195,741,440 | 63,017,280 |
| Size | 1.1 GB | 60.1 MB |
| Events in quadrant A | 17,048,364 | 23,169 |
| Events in quadrant B | 3,388,993 | 694,421 |
| Events in quadrant C | 8,650,851 | 522,617 |
| Events in quadrant D | 14,637,587 | 182,478 |
| Mode SS | |||
|---|---|---|---|
| Quadrant | BADHDUFLAG | Total packets | Discarded packets |
| A | 0 | 140 | 0 |
| B | 0 | 140 | 0 |
| C | 0 | 140 | 0 |
| D | 0 | 140 | 0 |
| Mode M0 | |||
|---|---|---|---|
| Quadrant | BADHDUFLAG | Total packets | Discarded packets |
| A | 0 | 55299 | 0 |
| B | 0 | 15167 | 0 |
| C | 0 | 30556 | 0 |
| D | 0 | 48234 | 1 |
| Quadrant | Total seconds | Saturated seconds | Saturation percentage |
|---|---|---|---|
| A | 6956 | 6790 | 97.613571% |
| B | 6956 | 67 | 0.963197% |
| C | 6956 | 1498 | 21.535365% |
| D | 6955 | 5133 | 73.803019% |
Noise dominated data is calculated using 1-second bins in cleaned event files. If a bin has >2000 counts, and if more than 50% of those come from <1% of pixels, then it is considered to be noise-dominated and hence unusable.
| Quadrant | # 1 sec bins | Bins with >0 counts | Bins with >2000 counts | High rate bins dominated by noise | Noise dominated (total time) | Noise dominated (detector-on time) | Marked lightcurve |
|---|---|---|---|---|---|---|---|
| A | 6955 | 6955 | 6279 | 6279 | 90.28% | 90.28% | 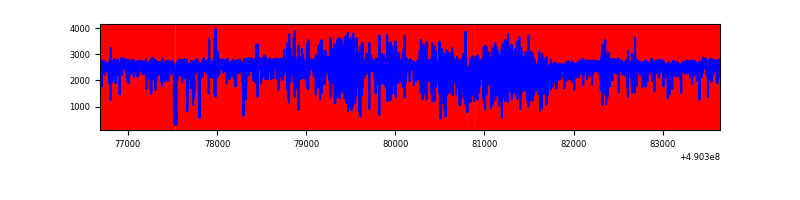 |
| B | 6956 | 6956 | 37 | 37 | 0.53% | 0.53% | 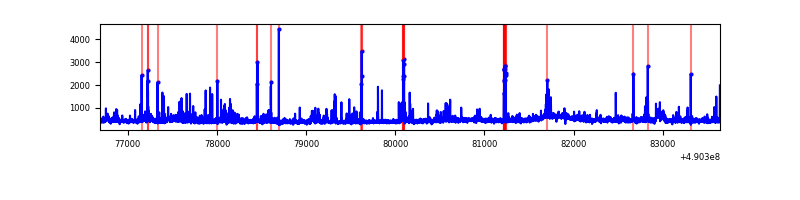 |
| C | 6956 | 6956 | 1248 | 1248 | 17.94% | 17.94% | 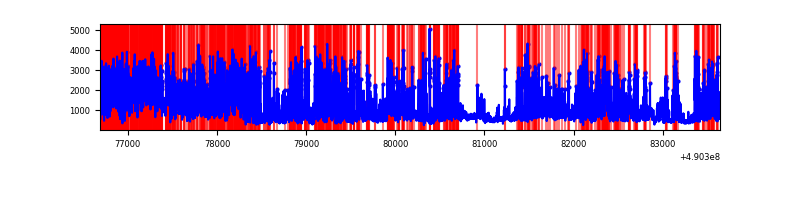 |
| D | 6954 | 6954 | 4248 | 4248 | 61.09% | 61.09% | 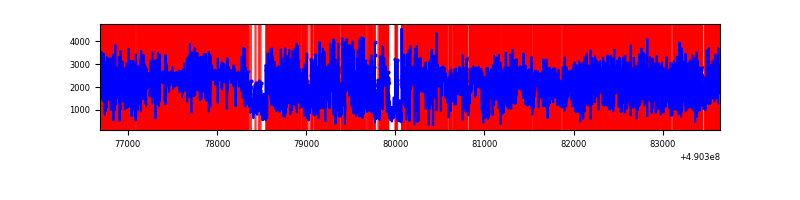 |
Top three noisy pixels from each quadrant. If the there are fewer than three noisy pixels in the level2.evt file, extra rows are filled as -1
| Pixel properties | Quadrant properties | ||||||
|---|---|---|---|---|---|---|---|
| Quadrant | DetID | PixID | Counts | Sigma | Mean | Median | Sigma |
| A | 9 | 191 | 13895352 | 208981.92 | 255 | 249 | 66.5 |
| A | 15 | 190 | 1337099 | 20106.18 | 255 | 249 | 66.5 |
| A | 7 | 206 | 280999 | 4222.47 | 255 | 249 | 66.5 |
| B | 10 | 191 | 71518 | 461.95 | 720 | 694 | 153.3 |
| B | 4 | 81 | 66853 | 431.52 | 720 | 694 | 153.3 |
| B | 10 | 247 | 57026 | 367.43 | 720 | 694 | 153.3 |
| C | 15 | 224 | 3071712 | 17051.07 | 654 | 648 | 180.1 |
| C | 1 | 16 | 863647 | 4791.52 | 654 | 648 | 180.1 |
| C | 15 | 147 | 619142 | 3433.98 | 654 | 648 | 180.1 |
| D | 2 | 62 | 5982756 | 47650.08 | 415 | 393 | 125.5 |
| D | 8 | 176 | 3865046 | 30782.32 | 415 | 393 | 125.5 |
| D | 12 | 17 | 1774713 | 14132.62 | 415 | 393 | 125.5 |
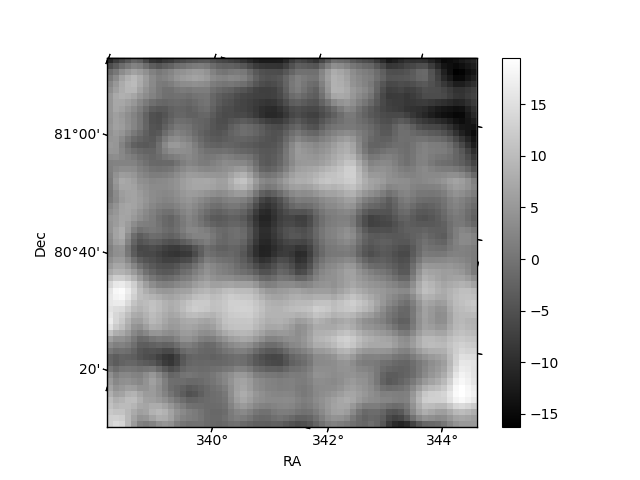
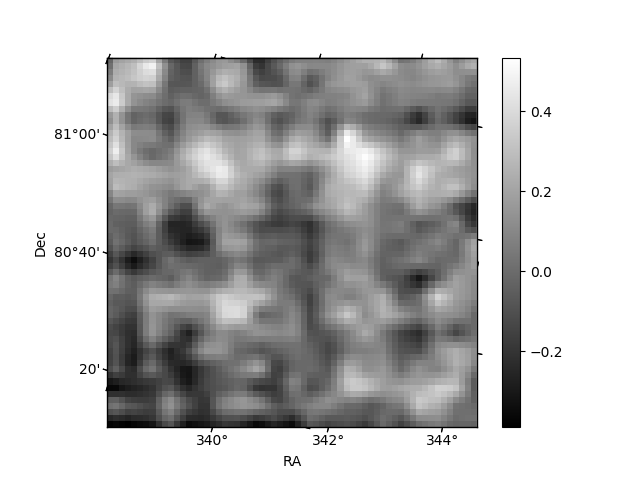
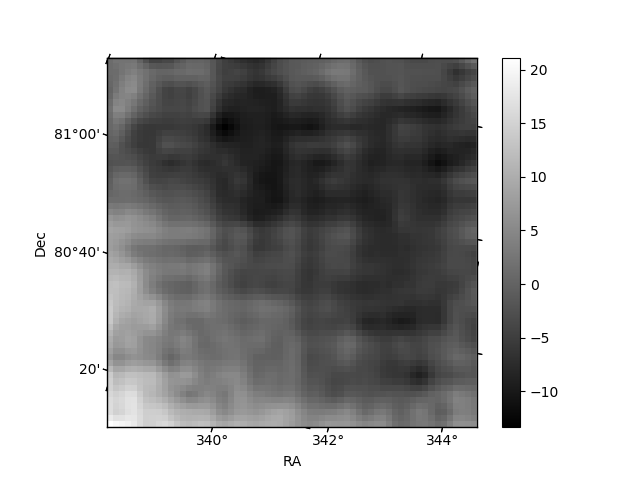
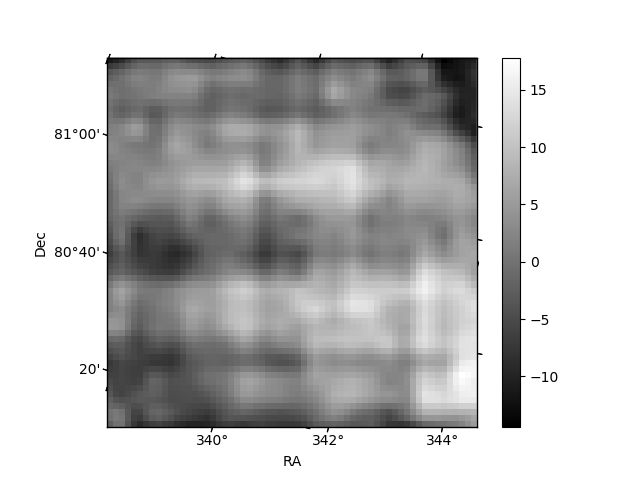
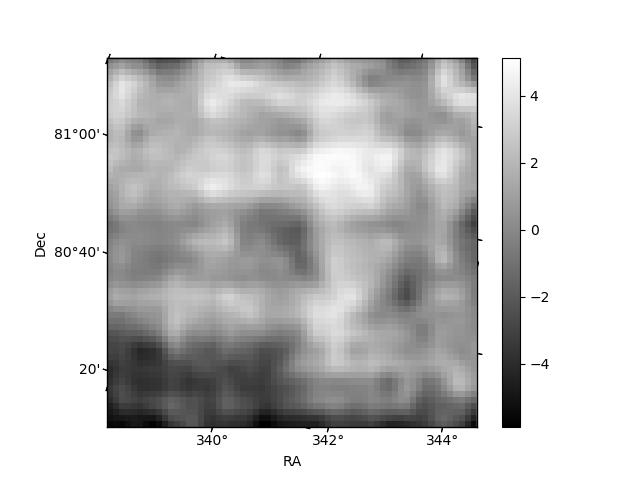
Histogram calculated using DETX and DETY for each event in the final _common_clean file
| Quadrant A | 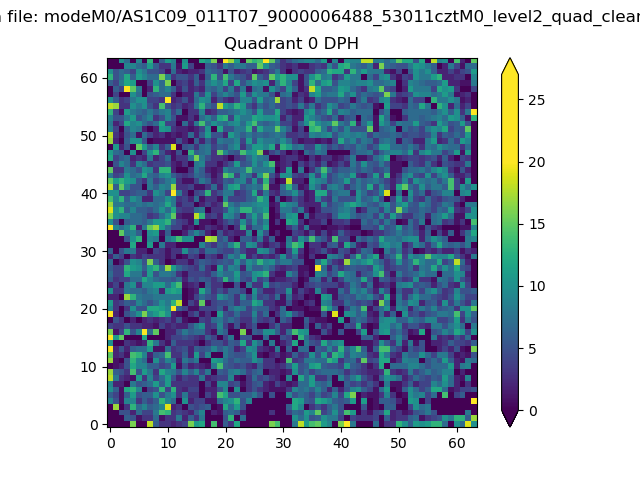 |
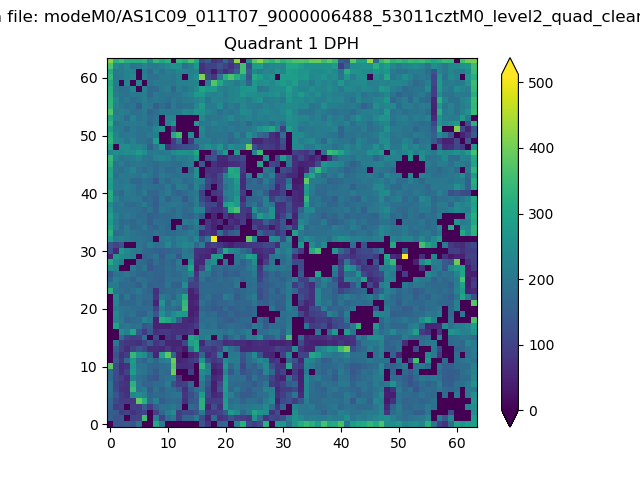 |
Quadrant B |
|---|---|---|---|
| Quadrant D | 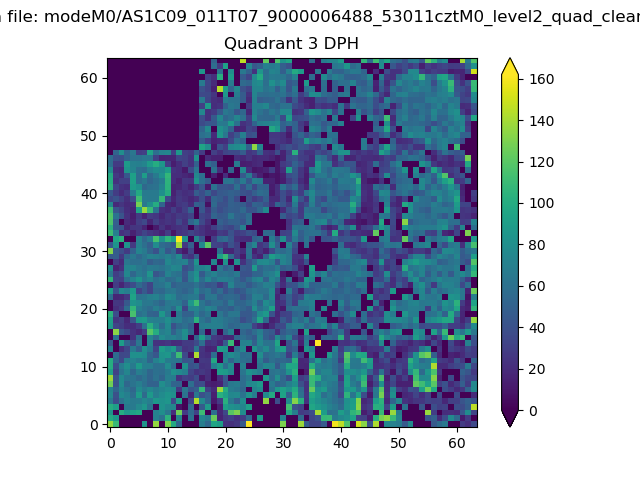 |
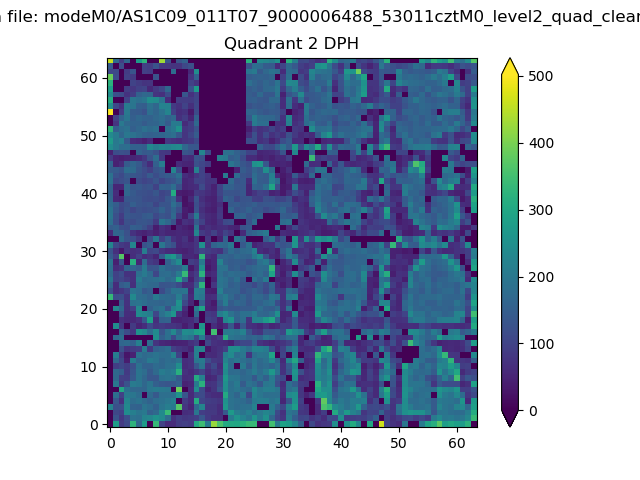 |
Quadrant C |
| Plot type | Count rate plots | Images |
|---|---|---|
| Comparison with Poisson distribution Blue bars denote a histogram of data divided into 1 sec bins. Red curve is a Poisson curve with rate = median count rate of data. |
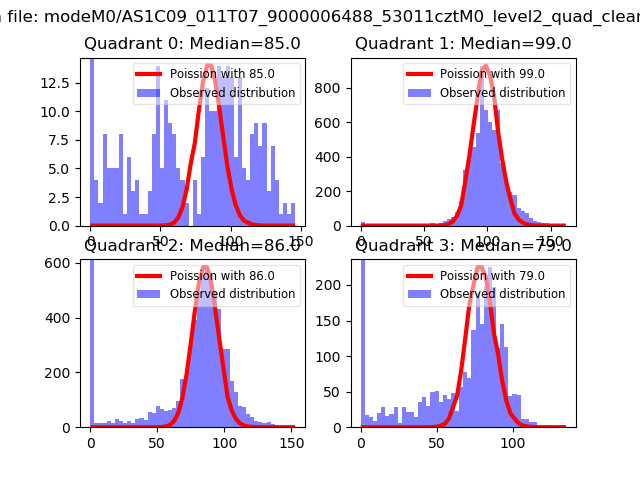 |
 |
| Quadrant-wise count rates Data is divided into 100 sec bins |
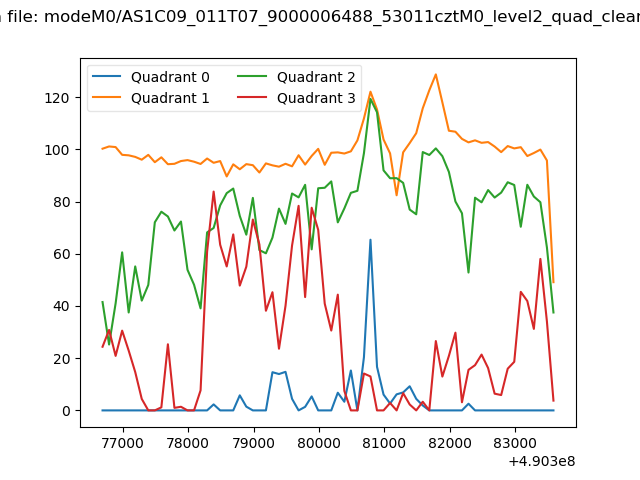 |
|
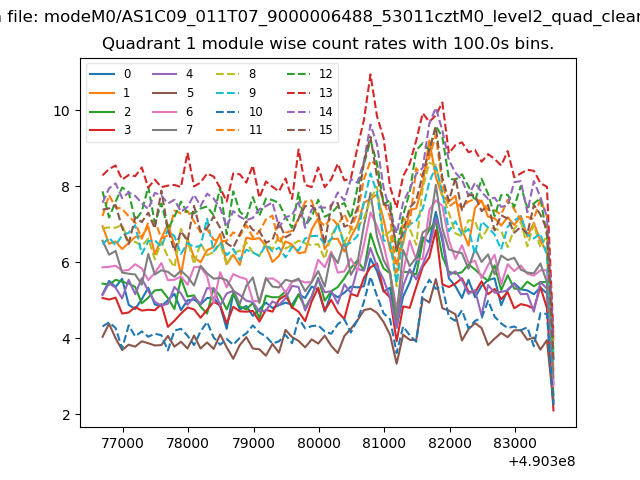
| Module-wise count rates for Quadrant A Data is divided into 100 sec bins |
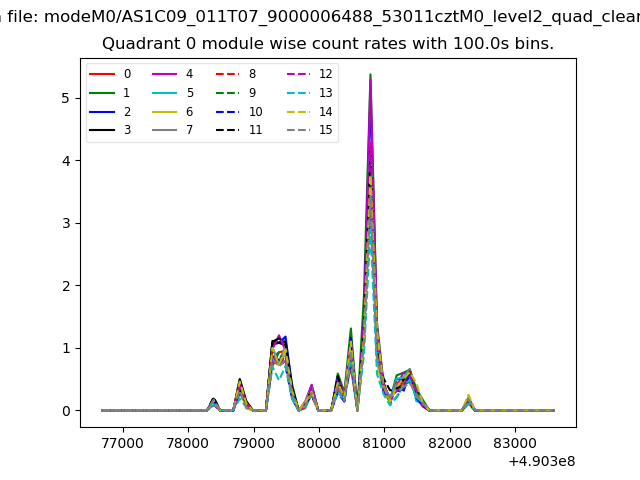 |
 |
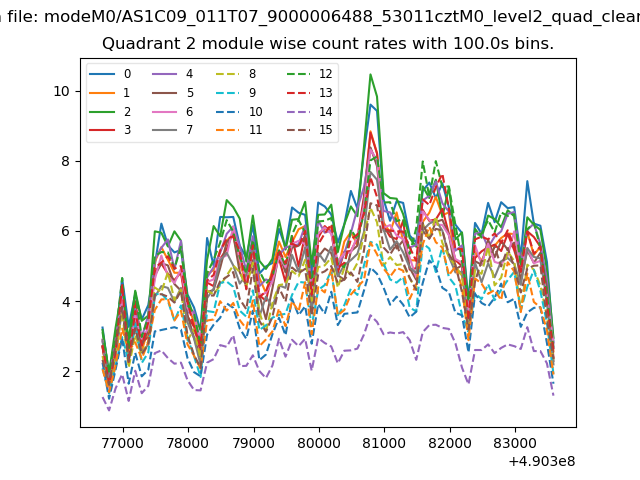
| Module-wise count rates for Quadrant B Data is divided into 100 sec bins |
 |
 |
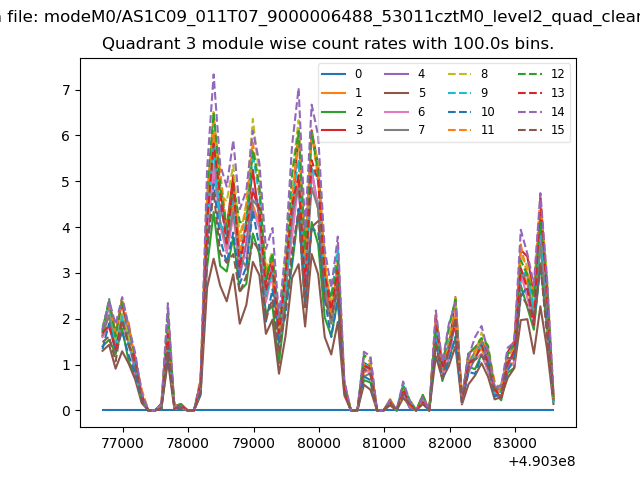
| Module-wise count rates for Quadrant C Data is divided into 100 sec bins |
 |
 |
| Module-wise count rates for Quadrant D Data is divided into 100 sec bins |
 |
 |
| Parameter | Plot |
|---|---|
| CZT HV Monitor |  |
| D_VDD | 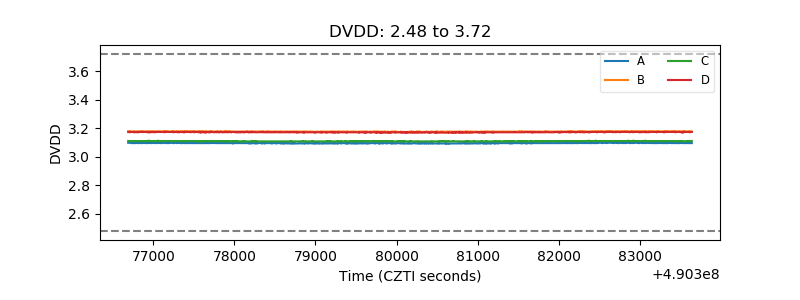 |
| Temperature 1 | 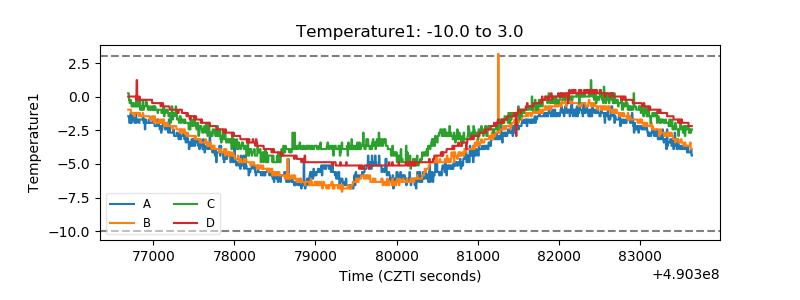 |
| Veto HV Monitor | 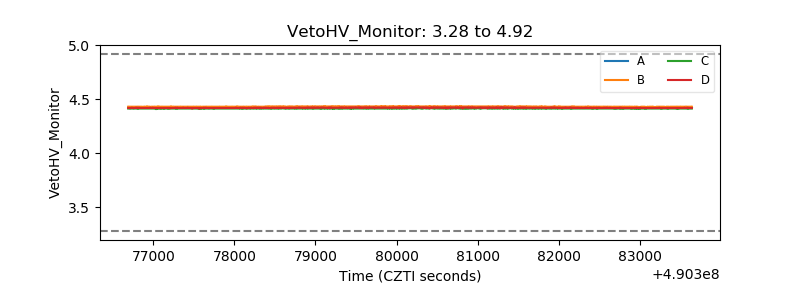 |
| Veto LLD | 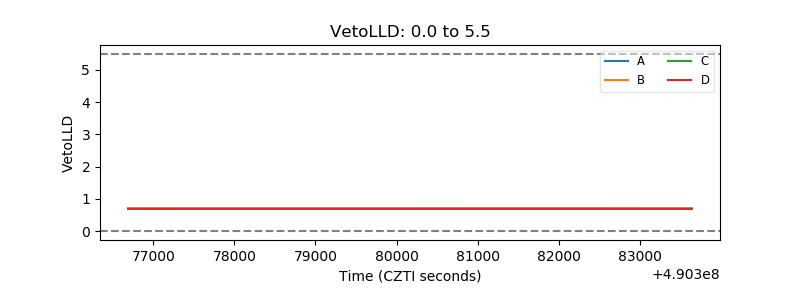 |
| Alpha Counter | 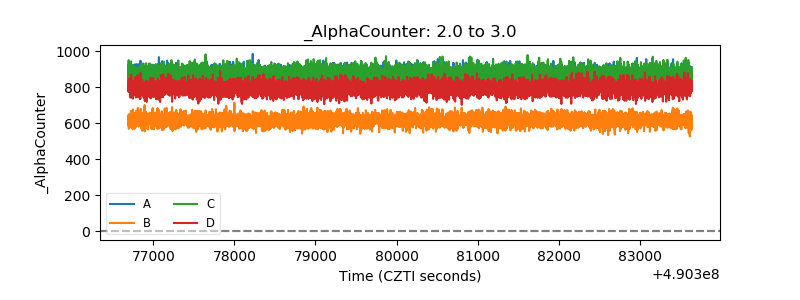 |
| _CPM_Rate | 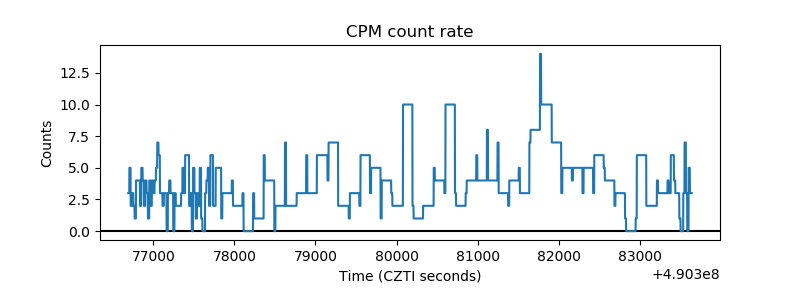 |
| CZT Counter | 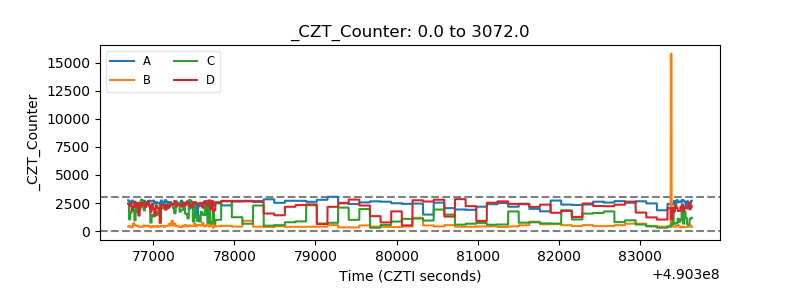 |
| +2.5 Volts monitor |  |
| +5 Volts monitor | 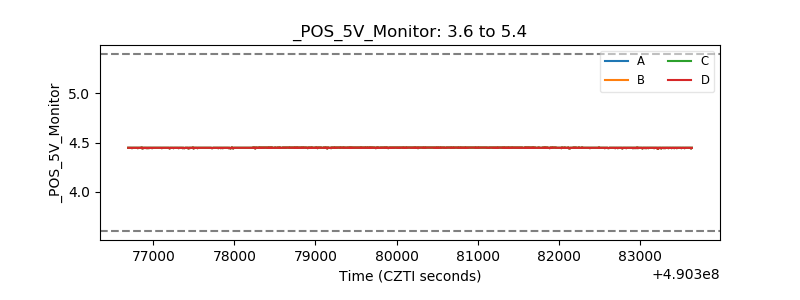 |
| _ROLL_ROT | 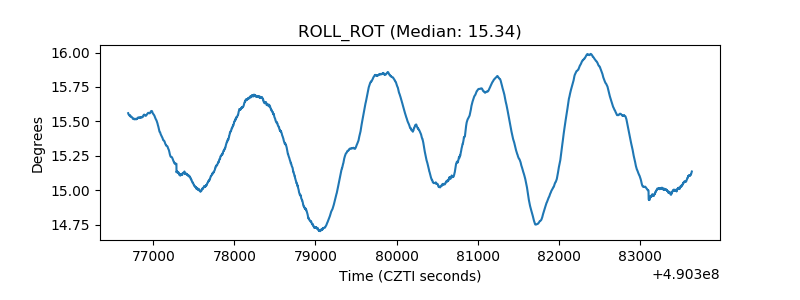 |
| _Roll_DEC | 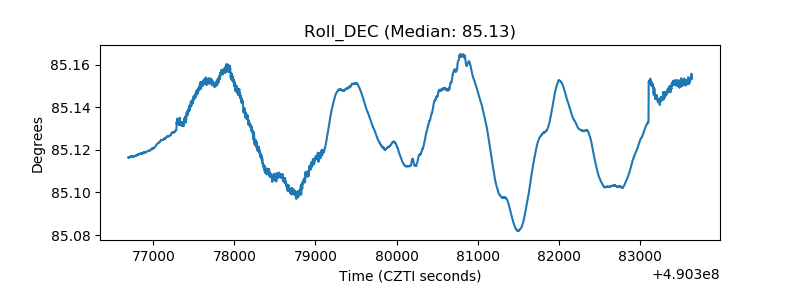 |
| _Roll_RA | 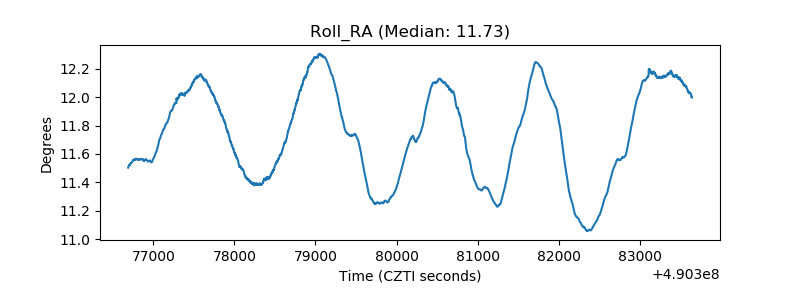 |
| Veto Counter | 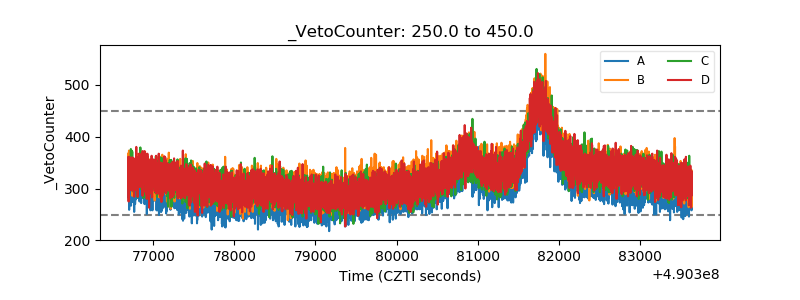 |