| Param | Original file | Final file |
|---|---|---|
| Filename | modeM0/AS1C09_011T07_9000006488_53014cztM0_level2.fits | modeM0/AS1C09_011T07_9000006488_53014cztM0_level2_quad_clean.evt |
| Size (bytes) | 2,776,870,080 | 159,635,520 |
| Size | 2.6 GB | 152.2 MB |
| Events in quadrant A | 41,795,503 | 38,844 |
| Events in quadrant B | 10,353,065 | 1,587,104 |
| Events in quadrant C | 21,938,277 | 1,163,271 |
| Events in quadrant D | 27,418,952 | 888,579 |
| Mode SS | |||
|---|---|---|---|
| Quadrant | BADHDUFLAG | Total packets | Discarded packets |
| A | 0 | 342 | 0 |
| B | 0 | 342 | 0 |
| C | 0 | 342 | 0 |
| D | 0 | 342 | 0 |
| Mode M9 | |||
|---|---|---|---|
| Quadrant | BADHDUFLAG | Total packets | Discarded packets |
| A | 0 | 9 | 0 |
| B | 0 | 9 | 0 |
| C | 0 | 9 | 0 |
| D | 0 | 9 | 0 |
| Mode M0 | |||
|---|---|---|---|
| Quadrant | BADHDUFLAG | Total packets | Discarded packets |
| A | 0 | 135458 | 2 |
| B | 0 | 42977 | 2 |
| C | 0 | 76832 | 2 |
| D | 0 | 93023 | 2 |
| Quadrant | Total seconds | Saturated seconds | Saturation percentage |
|---|---|---|---|
| A | 16727 | 16404 | 98.068990% |
| B | 16727 | 716 | 4.280505% |
| C | 16728 | 4133 | 24.707078% |
| D | 16728 | 6588 | 39.383070% |
Noise dominated data is calculated using 1-second bins in cleaned event files. If a bin has >2000 counts, and if more than 50% of those come from <1% of pixels, then it is considered to be noise-dominated and hence unusable.
| Quadrant | # 1 sec bins | Bins with >0 counts | Bins with >2000 counts | High rate bins dominated by noise | Noise dominated (total time) | Noise dominated (detector-on time) | Marked lightcurve |
|---|---|---|---|---|---|---|---|
| A | 17606 | 16726 | 15760 | 15760 | 89.51% | 94.22% | 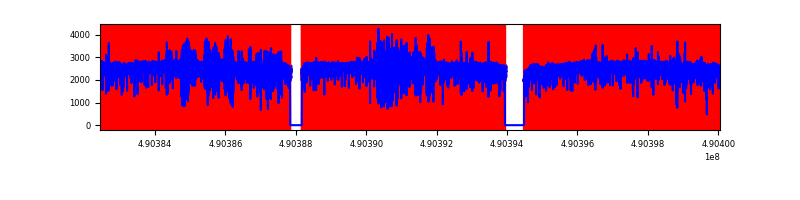 |
| B | 17607 | 16729 | 502 | 502 | 2.85% | 3.00% | 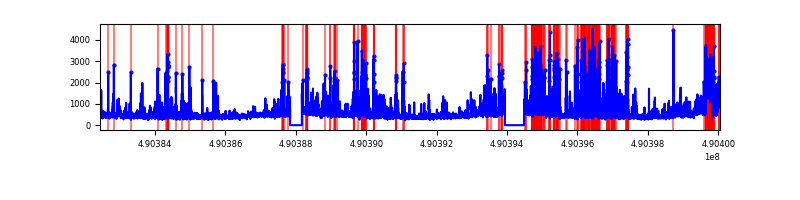 |
| C | 17608 | 16730 | 3542 | 3542 | 20.12% | 21.17% | 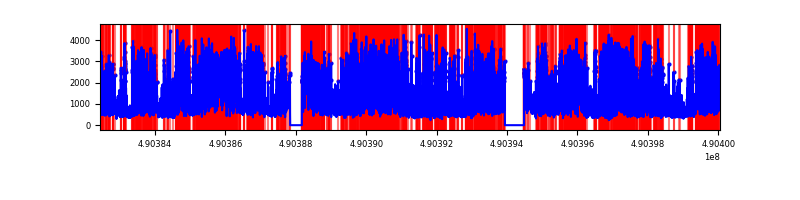 |
| D | 17608 | 16730 | 5645 | 5645 | 32.06% | 33.74% | 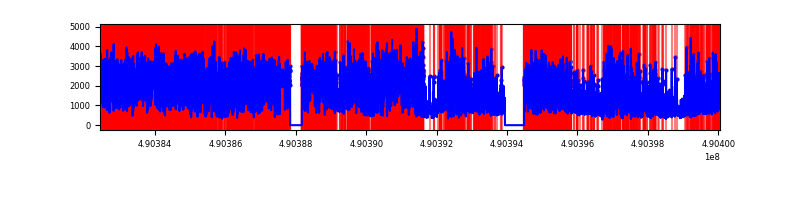 |
Top three noisy pixels from each quadrant. If the there are fewer than three noisy pixels in the level2.evt file, extra rows are filled as -1
| Pixel properties | Quadrant properties | ||||||
|---|---|---|---|---|---|---|---|
| Quadrant | DetID | PixID | Counts | Sigma | Mean | Median | Sigma |
| A | 9 | 191 | 35953443 | 251837.94 | 548 | 534 | 142.8 |
| A | 15 | 190 | 2545955 | 17829.81 | 548 | 534 | 142.8 |
| A | 7 | 206 | 538003 | 3764.79 | 548 | 534 | 142.8 |
| B | 8 | 128 | 948846 | 2668.06 | 1675 | 1616 | 355.0 |
| B | 2 | 249 | 691168 | 1942.26 | 1675 | 1616 | 355.0 |
| B | 10 | 128 | 656599 | 1844.89 | 1675 | 1616 | 355.0 |
| C | 15 | 224 | 8860229 | 21202.01 | 1514 | 1497 | 417.8 |
| C | 1 | 16 | 1727989 | 4132.09 | 1514 | 1497 | 417.8 |
| C | 15 | 148 | 1556155 | 3720.83 | 1514 | 1497 | 417.8 |
| D | 2 | 62 | 13938268 | 34061.71 | 1403 | 1341 | 409.2 |
| D | 8 | 176 | 4812866 | 11759.32 | 1403 | 1341 | 409.2 |
| D | 15 | 78 | 709466 | 1730.65 | 1403 | 1341 | 409.2 |
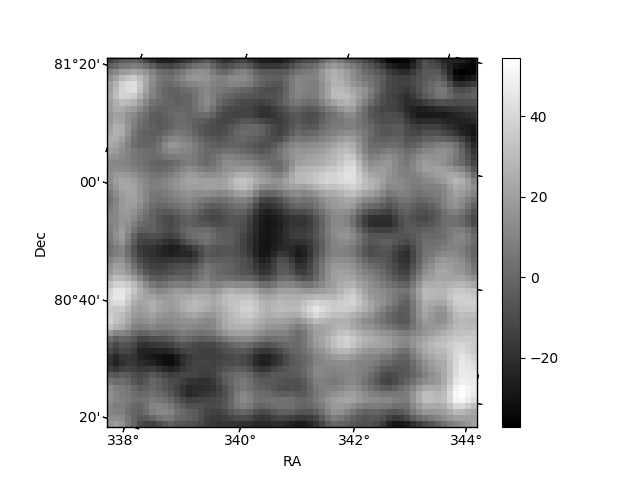
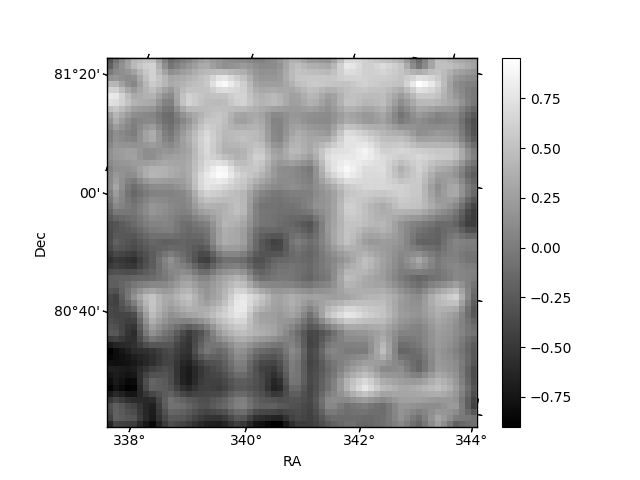
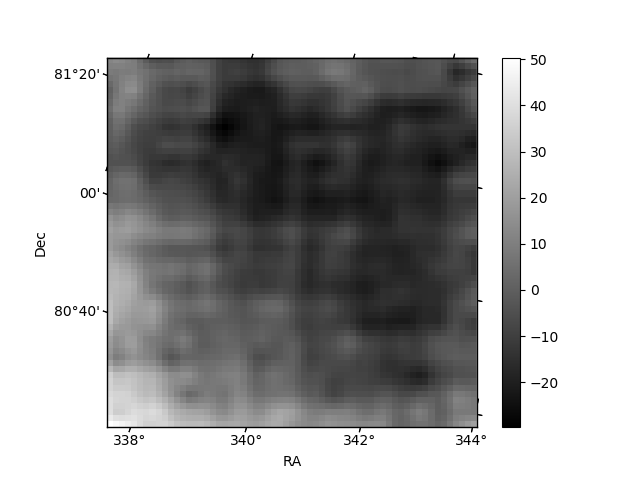
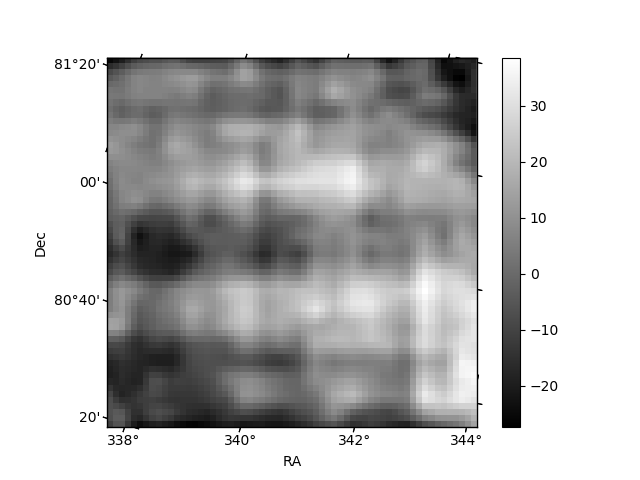
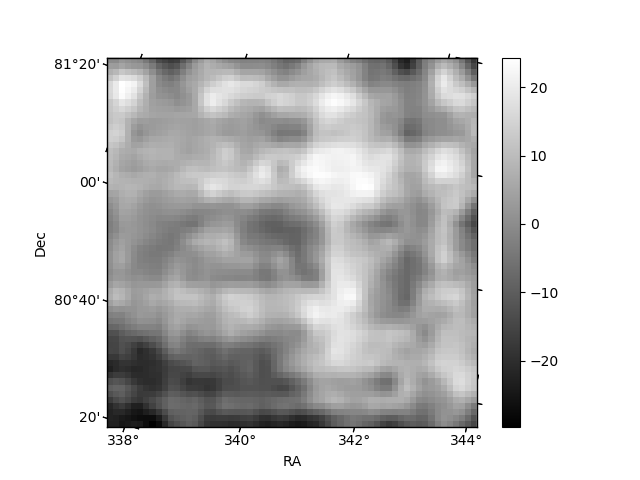
Histogram calculated using DETX and DETY for each event in the final _common_clean file
| Quadrant A | 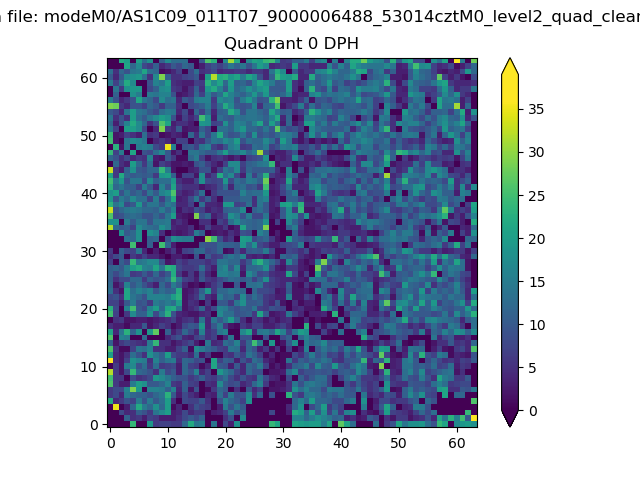 |
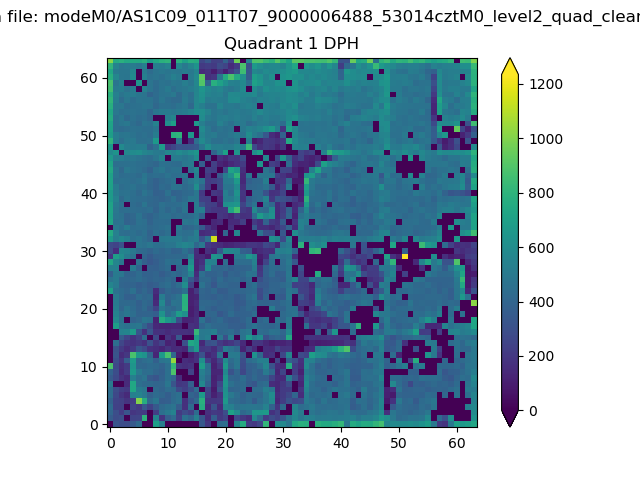 |
Quadrant B |
|---|---|---|---|
| Quadrant D | 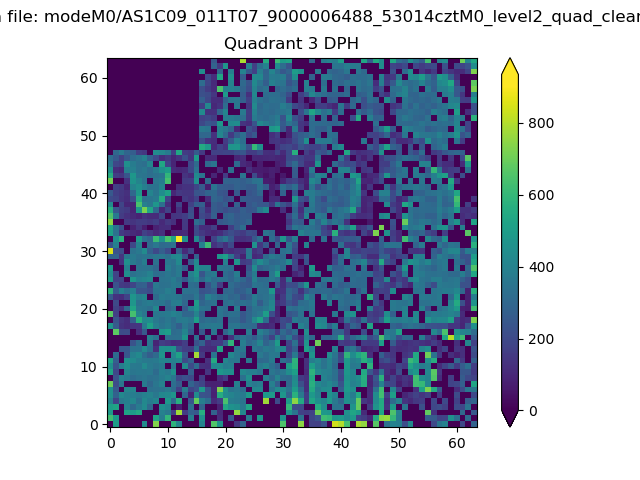 |
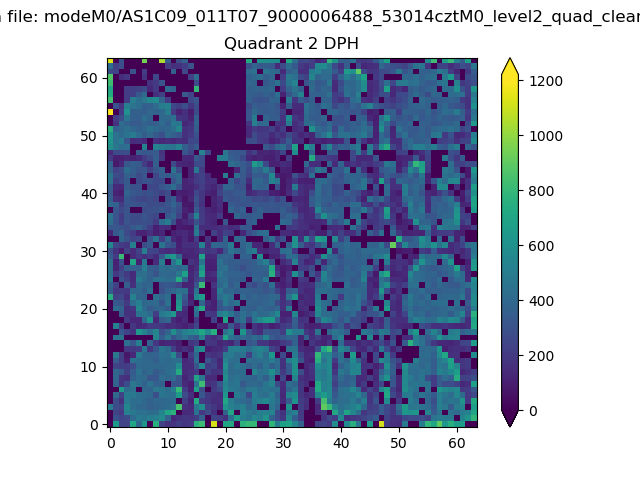 |
Quadrant C |
| Plot type | Count rate plots | Images |
|---|---|---|
| Comparison with Poisson distribution Blue bars denote a histogram of data divided into 1 sec bins. Red curve is a Poisson curve with rate = median count rate of data. |
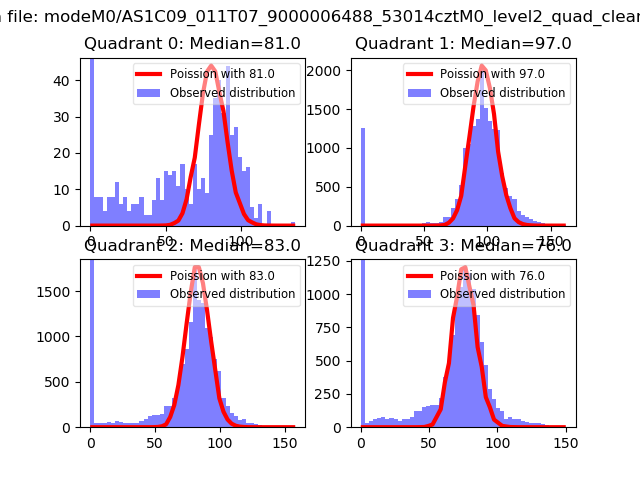 |
 |
| Quadrant-wise count rates Data is divided into 100 sec bins |
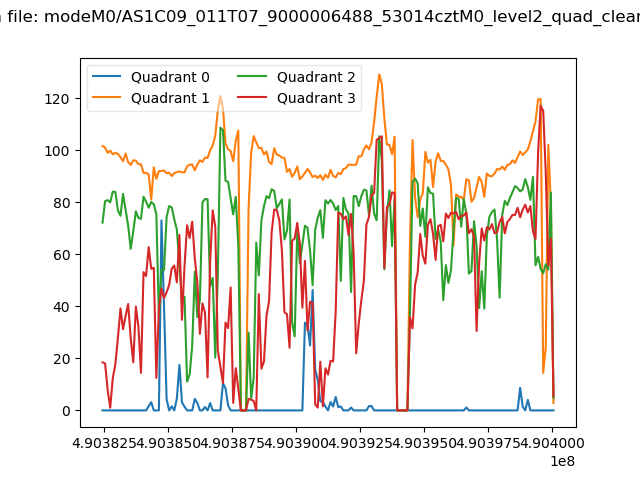 |
|
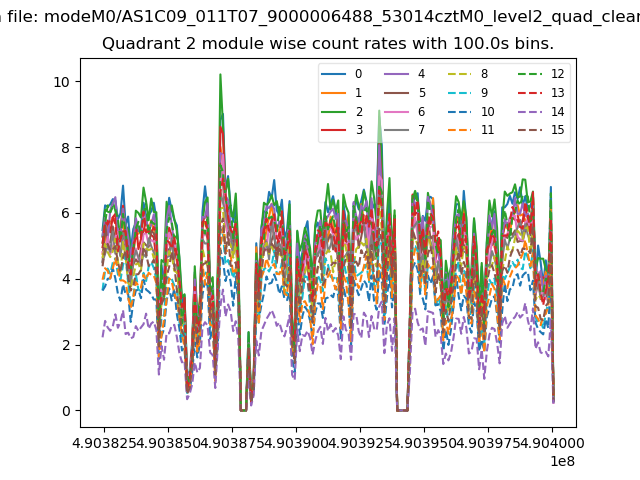
| Module-wise count rates for Quadrant A Data is divided into 100 sec bins |
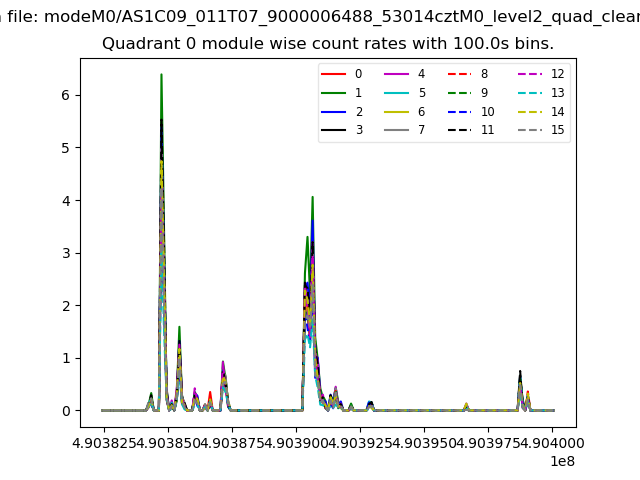 |
 |
| Module-wise count rates for Quadrant B Data is divided into 100 sec bins |
 |
 |
| Module-wise count rates for Quadrant C Data is divided into 100 sec bins |
 |
 |
| Module-wise count rates for Quadrant D Data is divided into 100 sec bins |
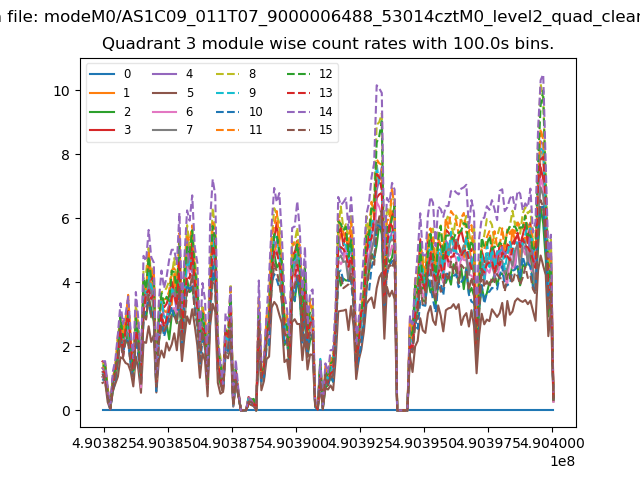 |
 |
| Parameter | Plot |
|---|---|
| CZT HV Monitor | 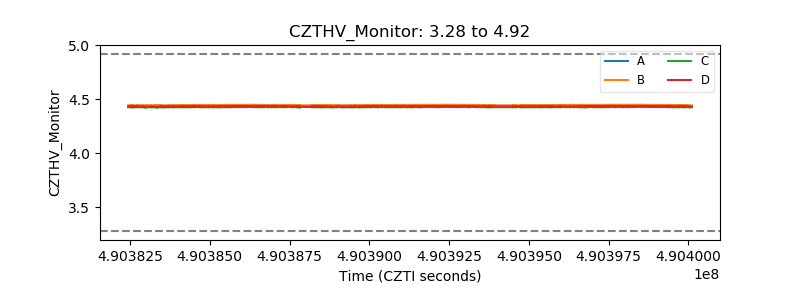 |
| D_VDD | 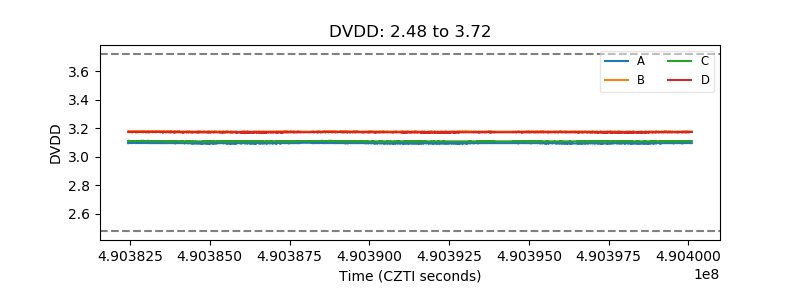 |
| Temperature 1 | 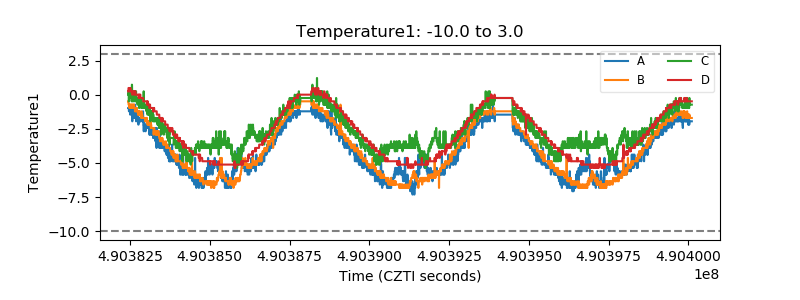 |
| Veto HV Monitor | 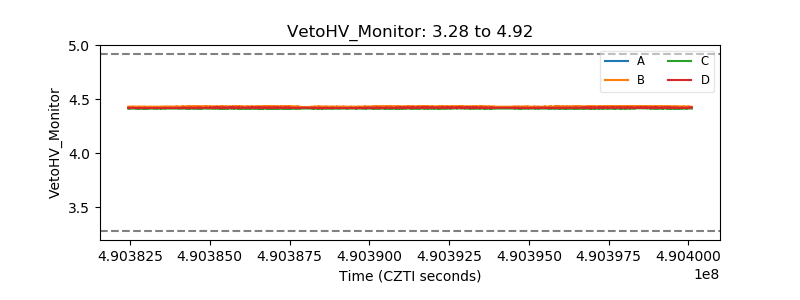 |
| Veto LLD | 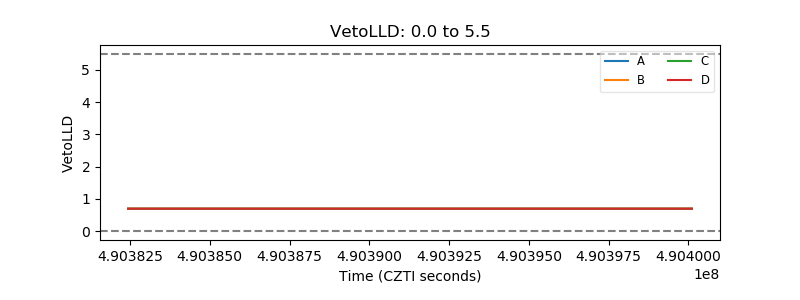 |
| Alpha Counter | 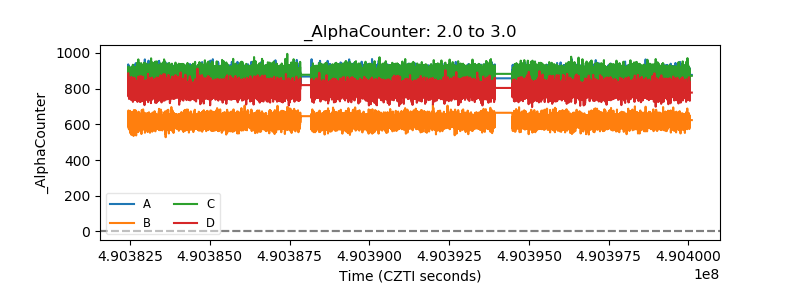 |
| _CPM_Rate | 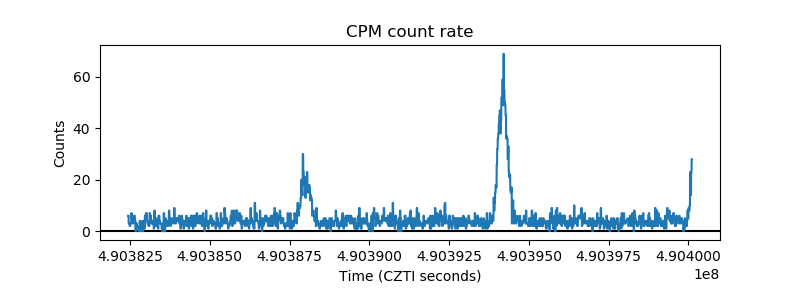 |
| CZT Counter | 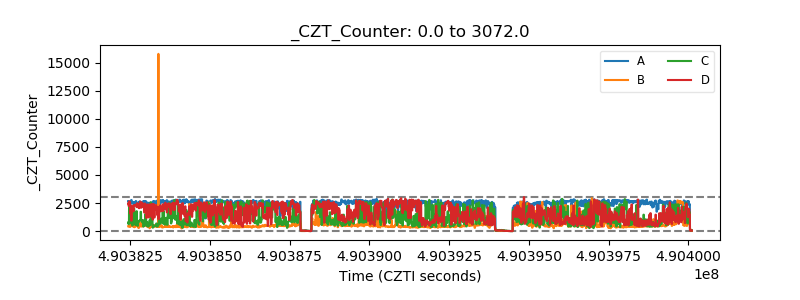 |
| +2.5 Volts monitor |  |
| +5 Volts monitor | 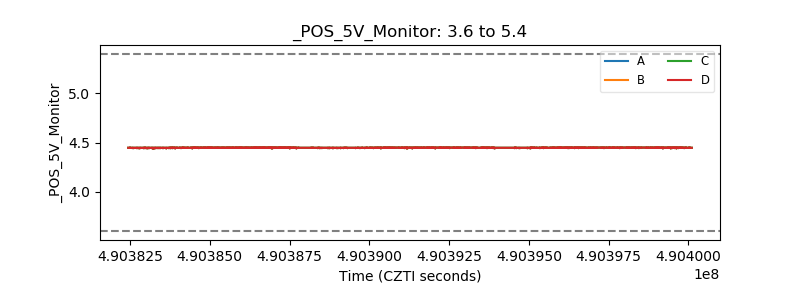 |
| _ROLL_ROT | 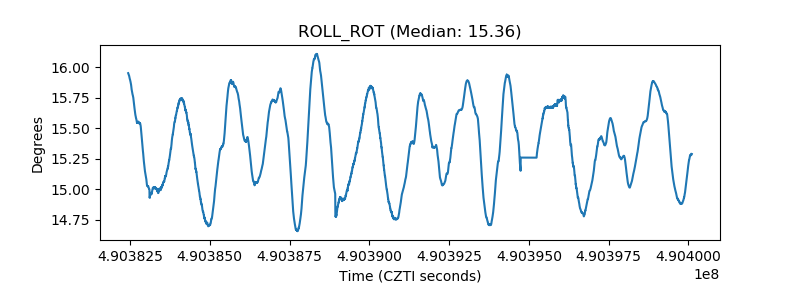 |
| _Roll_DEC | 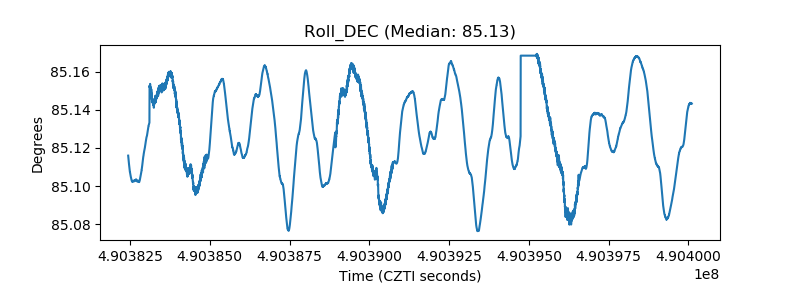 |
| _Roll_RA | 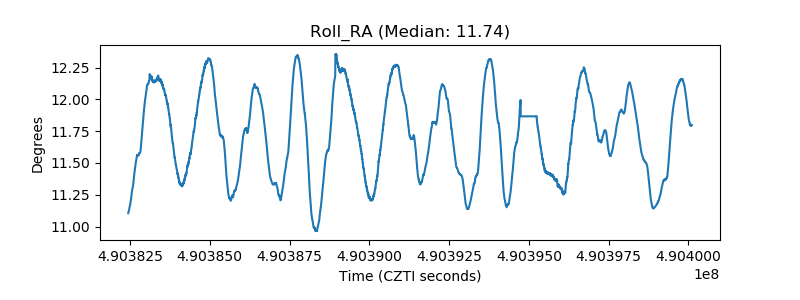 |
| Veto Counter | 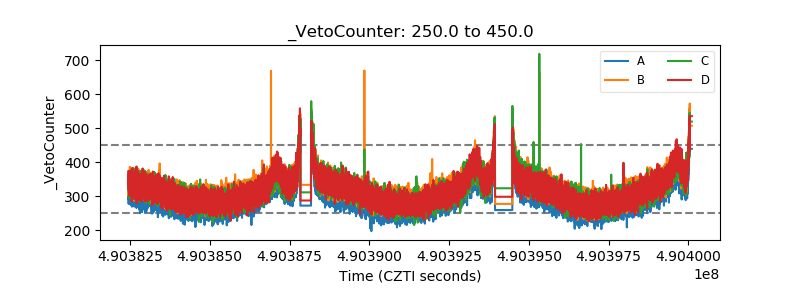 |