| Param | Original file | Final file |
|---|---|---|
| Filename | modeM0/AS1C09_011T07_9000006488_53015cztM0_level2.fits | modeM0/AS1C09_011T07_9000006488_53015cztM0_level2_quad_clean.evt |
| Size (bytes) | 1,078,689,600 | 86,630,400 |
| Size | 1.0 GB | 82.6 MB |
| Events in quadrant A | 17,101,026 | 102,562 |
| Events in quadrant B | 5,934,369 | 704,213 |
| Events in quadrant C | 9,355,314 | 610,246 |
| Events in quadrant D | 6,965,325 | 689,608 |
| Mode SS | |||
|---|---|---|---|
| Quadrant | BADHDUFLAG | Total packets | Discarded packets |
| A | 0 | 150 | 0 |
| B | 0 | 150 | 0 |
| C | 0 | 150 | 0 |
| D | 0 | 150 | 0 |
| Mode M9 | |||
|---|---|---|---|
| Quadrant | BADHDUFLAG | Total packets | Discarded packets |
| A | 0 | 16 | 0 |
| B | 0 | 16 | 0 |
| C | 0 | 16 | 0 |
| D | 0 | 16 | 0 |
| Mode M0 | |||
|---|---|---|---|
| Quadrant | BADHDUFLAG | Total packets | Discarded packets |
| A | 0 | 55696 | 2 |
| B | 0 | 23062 | 2 |
| C | 0 | 32955 | 2 |
| D | 0 | 25926 | 2 |
| Quadrant | Total seconds | Saturated seconds | Saturation percentage |
|---|---|---|---|
| A | 7423 | 6416 | 86.434056% |
| B | 7423 | 913 | 12.299609% |
| C | 7424 | 1632 | 21.982759% |
| D | 7424 | 508 | 6.842672% |
Noise dominated data is calculated using 1-second bins in cleaned event files. If a bin has >2000 counts, and if more than 50% of those come from <1% of pixels, then it is considered to be noise-dominated and hence unusable.
| Quadrant | # 1 sec bins | Bins with >0 counts | Bins with >2000 counts | High rate bins dominated by noise | Noise dominated (total time) | Noise dominated (detector-on time) | Marked lightcurve |
|---|---|---|---|---|---|---|---|
| A | 8968 | 7423 | 6194 | 6194 | 69.07% | 83.44% | 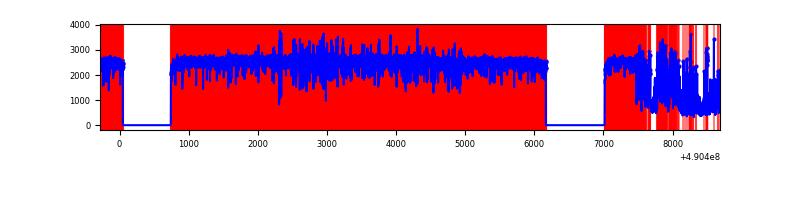 |
| B | 8967 | 7424 | 717 | 717 | 8.00% | 9.66% | 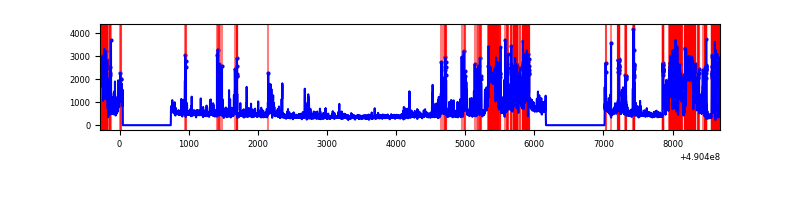 |
| C | 8969 | 7426 | 1387 | 1387 | 15.46% | 18.68% | 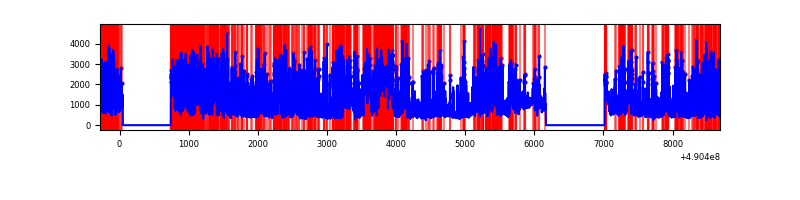 |
| D | 8969 | 7426 | 422 | 422 | 4.71% | 5.68% | 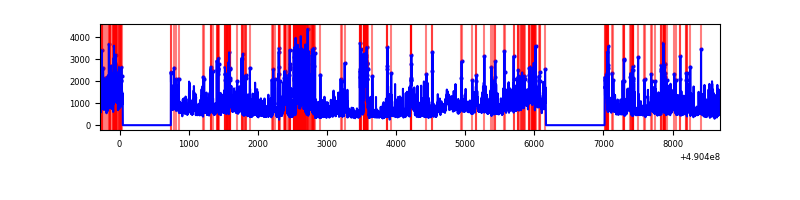 |
Top three noisy pixels from each quadrant. If the there are fewer than three noisy pixels in the level2.evt file, extra rows are filled as -1
| Pixel properties | Quadrant properties | ||||||
|---|---|---|---|---|---|---|---|
| Quadrant | DetID | PixID | Counts | Sigma | Mean | Median | Sigma |
| A | 9 | 191 | 14820473 | 177505.62 | 314 | 305 | 83.5 |
| A | 15 | 190 | 685153 | 8202.63 | 314 | 305 | 83.5 |
| A | 3 | 62 | 98258 | 1173.21 | 314 | 305 | 83.5 |
| B | 10 | 44 | 1499579 | 9424.85 | 735 | 710 | 159.0 |
| B | 8 | 128 | 584299 | 3669.59 | 735 | 710 | 159.0 |
| B | 10 | 128 | 340141 | 2134.33 | 735 | 710 | 159.0 |
| C | 15 | 224 | 3740315 | 18837.02 | 711 | 706 | 198.5 |
| C | 1 | 241 | 842024 | 4237.85 | 711 | 706 | 198.5 |
| C | 1 | 16 | 632682 | 3183.36 | 711 | 706 | 198.5 |
| D | 2 | 62 | 2042661 | 8853.15 | 777 | 741 | 230.6 |
| D | 8 | 176 | 528527 | 2288.32 | 777 | 741 | 230.6 |
| D | 15 | 78 | 331631 | 1434.64 | 777 | 741 | 230.6 |
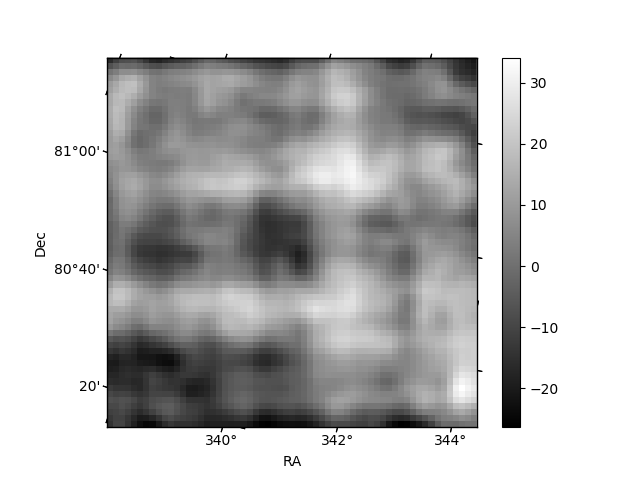
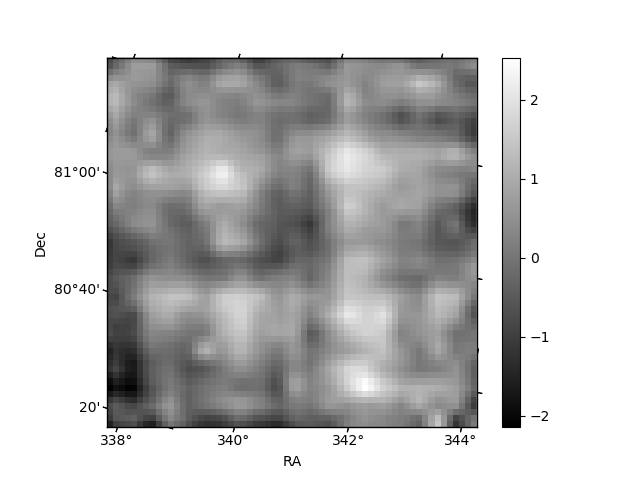
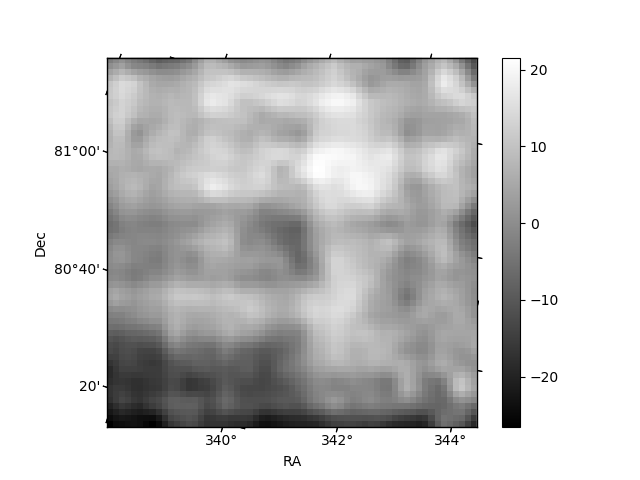
Histogram calculated using DETX and DETY for each event in the final _common_clean file
| Quadrant A | 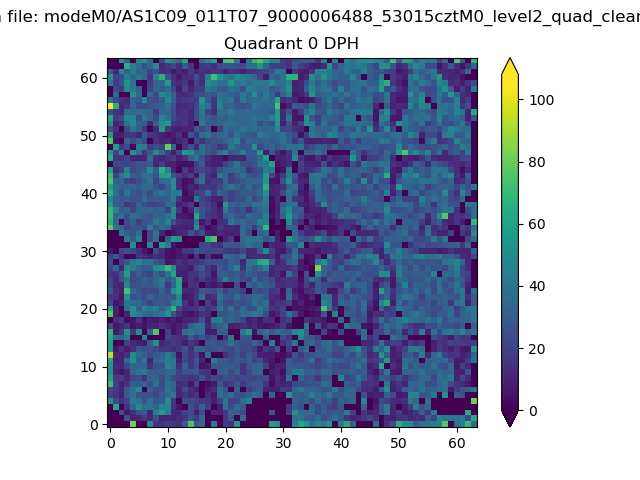 |
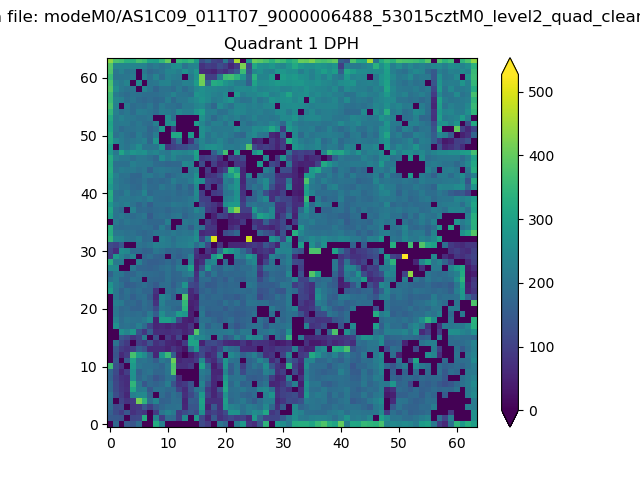 |
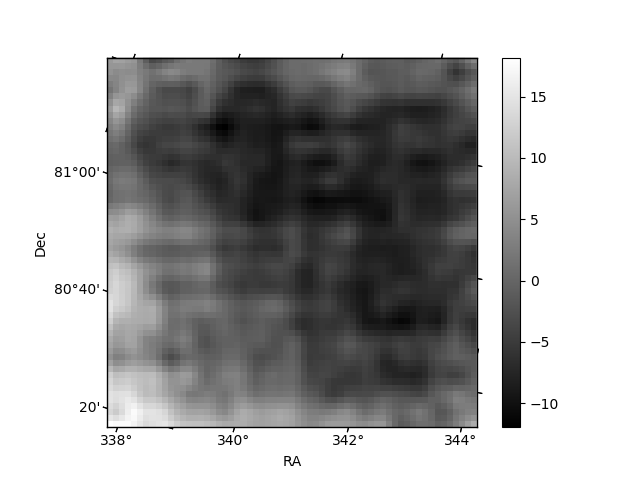
Quadrant B |
|---|---|---|---|
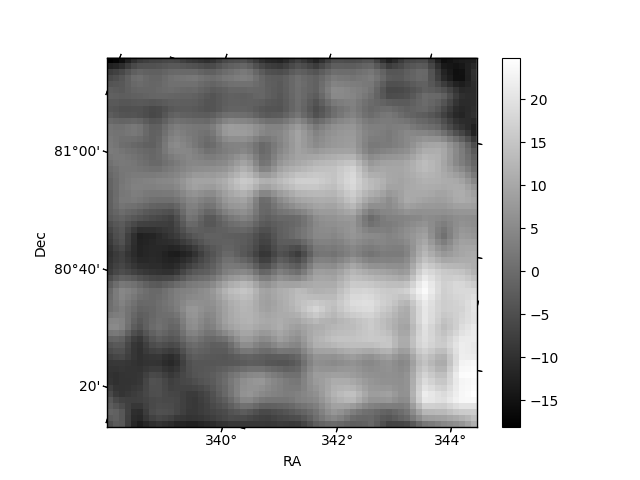
| Quadrant D | 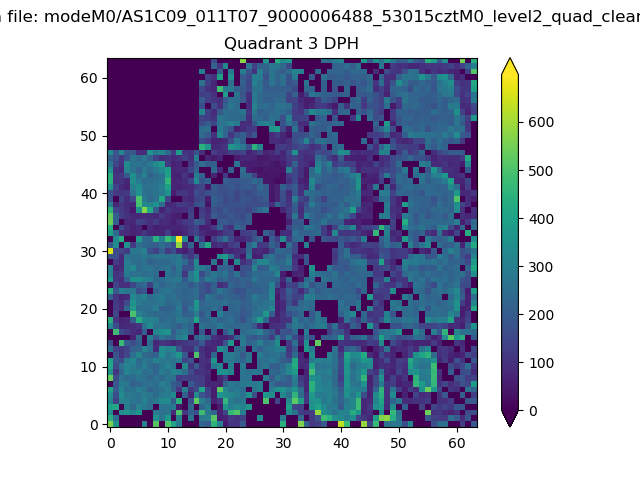 |
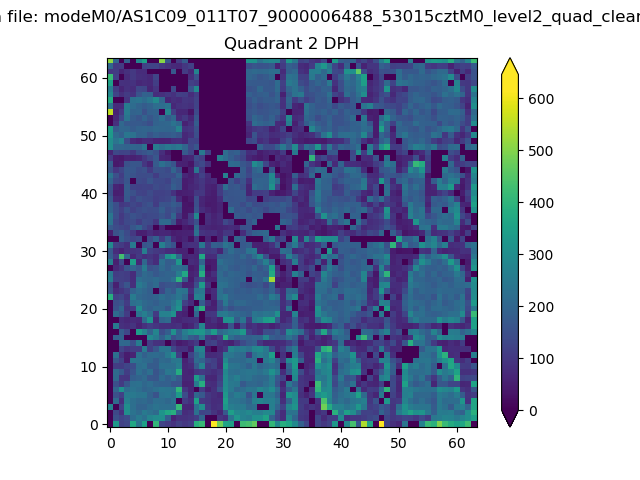 |
Quadrant C |
| Plot type | Count rate plots | Images |
|---|---|---|
| Comparison with Poisson distribution Blue bars denote a histogram of data divided into 1 sec bins. Red curve is a Poisson curve with rate = median count rate of data. |
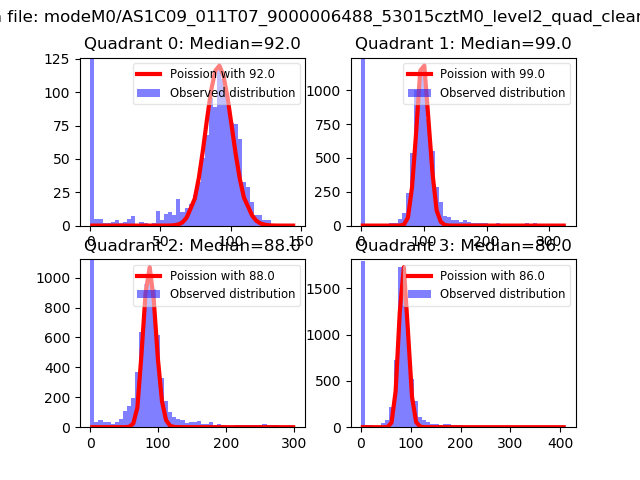 |
 |
| Quadrant-wise count rates Data is divided into 100 sec bins |
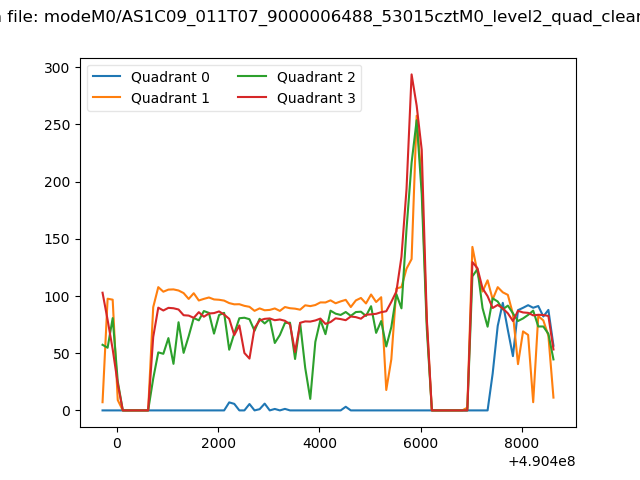 |
|
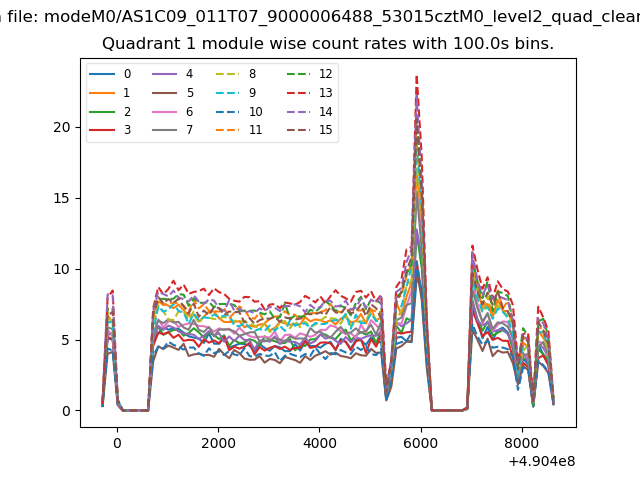
| Module-wise count rates for Quadrant A Data is divided into 100 sec bins |
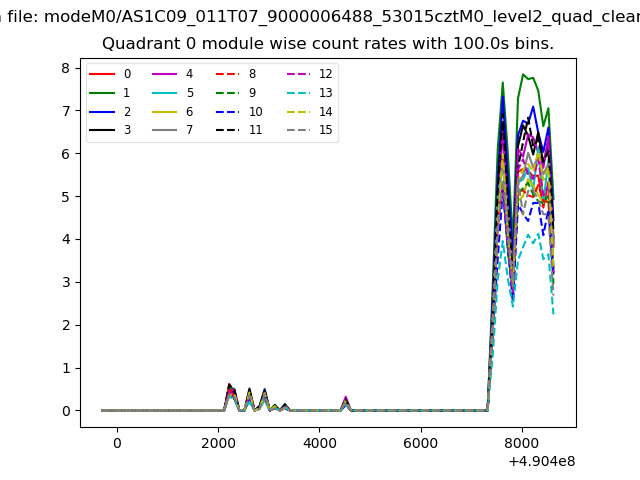 |
 |
| Module-wise count rates for Quadrant B Data is divided into 100 sec bins |
 |
 |
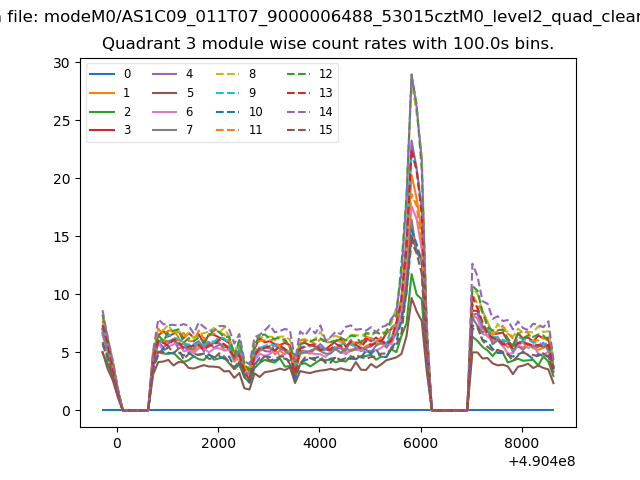
| Module-wise count rates for Quadrant C Data is divided into 100 sec bins |
 |
 |
| Module-wise count rates for Quadrant D Data is divided into 100 sec bins |
 |
 |
| Parameter | Plot |
|---|---|
| CZT HV Monitor | 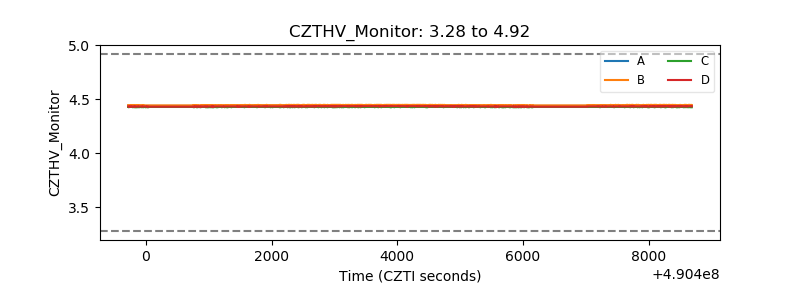 |
| D_VDD | 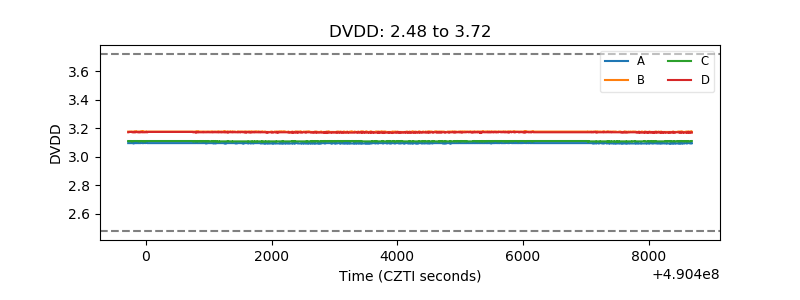 |
| Temperature 1 | 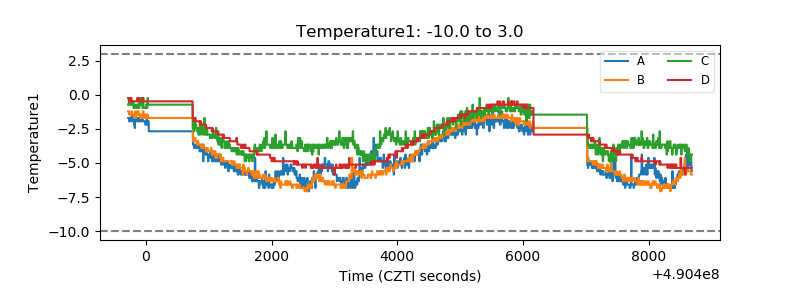 |
| Veto HV Monitor | 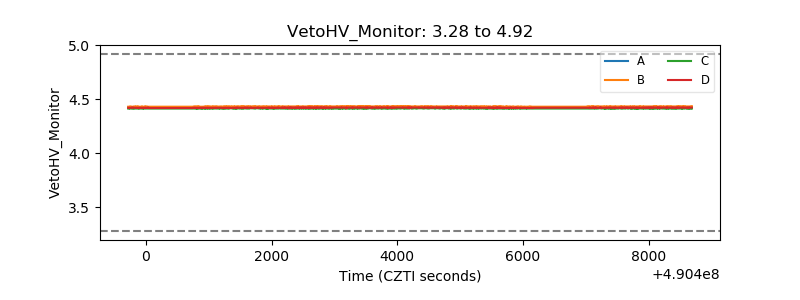 |
| Veto LLD | 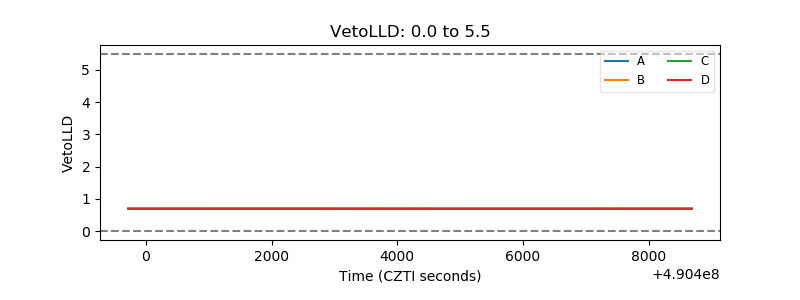 |
| Alpha Counter |  |
| _CPM_Rate | 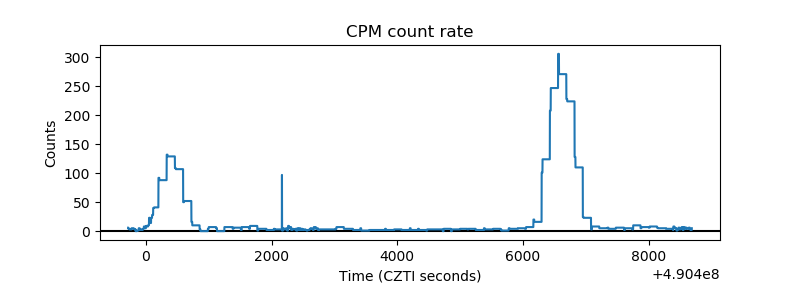 |
| CZT Counter | 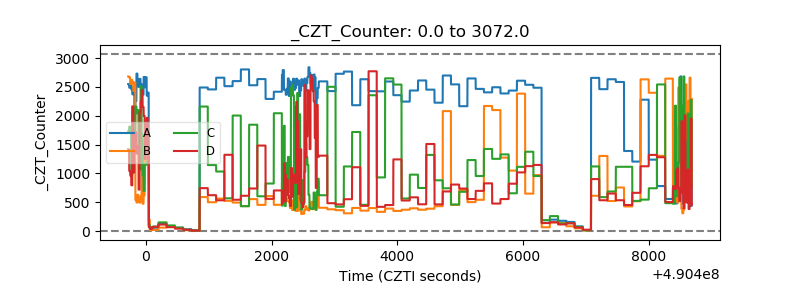 |
| +2.5 Volts monitor |  |
| +5 Volts monitor |  |
| _ROLL_ROT | 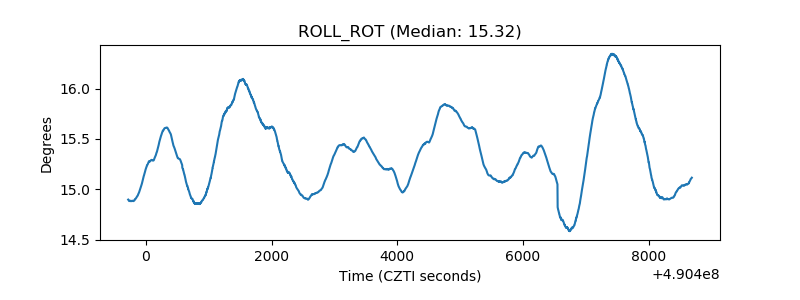 |
| _Roll_DEC | 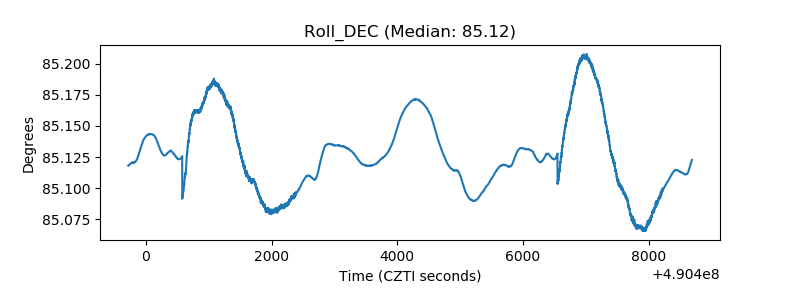 |
| _Roll_RA | 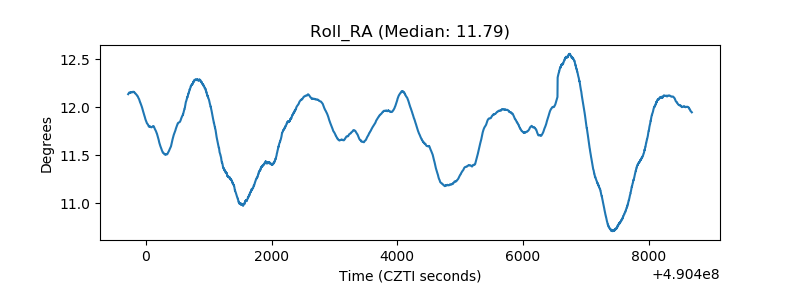 |
| Veto Counter | 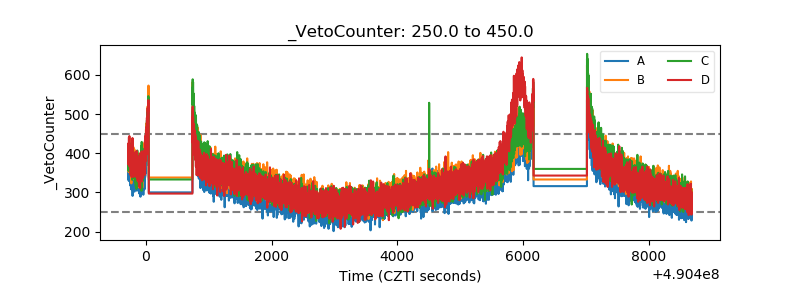 |