| Param | Original file | Final file |
|---|---|---|
| Filename | modeM0/AS1C09_011T07_9000006488_53017cztM0_level2.fits | modeM0/AS1C09_011T07_9000006488_53017cztM0_level2_quad_clean.evt |
| Size (bytes) | 928,229,760 | 70,208,640 |
| Size | 885.2 MB | 67.0 MB |
| Events in quadrant A | 13,513,926 | 152,594 |
| Events in quadrant B | 8,186,290 | 462,106 |
| Events in quadrant C | 7,165,362 | 521,900 |
| Events in quadrant D | 5,004,251 | 546,387 |
| Mode SS | |||
|---|---|---|---|
| Quadrant | BADHDUFLAG | Total packets | Discarded packets |
| A | 0 | 128 | 0 |
| B | 0 | 128 | 0 |
| C | 0 | 128 | 0 |
| D | 0 | 128 | 0 |
| Mode M9 | |||
|---|---|---|---|
| Quadrant | BADHDUFLAG | Total packets | Discarded packets |
| A | 0 | 10 | 0 |
| B | 0 | 10 | 0 |
| C | 0 | 10 | 0 |
| D | 0 | 10 | 0 |
| Mode M0 | |||
|---|---|---|---|
| Quadrant | BADHDUFLAG | Total packets | Discarded packets |
| A | 0 | 44375 | 7 |
| B | 0 | 28692 | 1 |
| C | 0 | 25689 | 1 |
| D | 0 | 19399 | 1 |
| Quadrant | Total seconds | Saturated seconds | Saturation percentage |
|---|---|---|---|
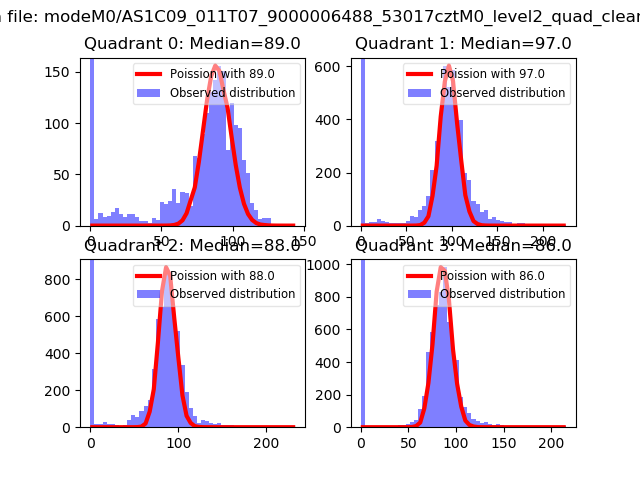
| A | 6343 | 4897 | 77.203216% |
| B | 6344 | 1982 | 31.242119% |
| C | 6344 | 921 | 14.517654% |
| D | 6344 | 213 | 3.357503% |
Noise dominated data is calculated using 1-second bins in cleaned event files. If a bin has >2000 counts, and if more than 50% of those come from <1% of pixels, then it is considered to be noise-dominated and hence unusable.
| Quadrant | # 1 sec bins | Bins with >0 counts | Bins with >2000 counts | High rate bins dominated by noise | Noise dominated (total time) | Noise dominated (detector-on time) | Marked lightcurve |
|---|---|---|---|---|---|---|---|
| A | 7327 | 6342 | 4569 | 4569 | 62.36% | 72.04% | 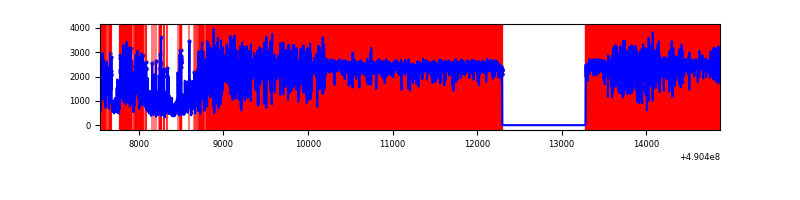 |
| B | 7329 | 6345 | 1722 | 1722 | 23.50% | 27.14% | 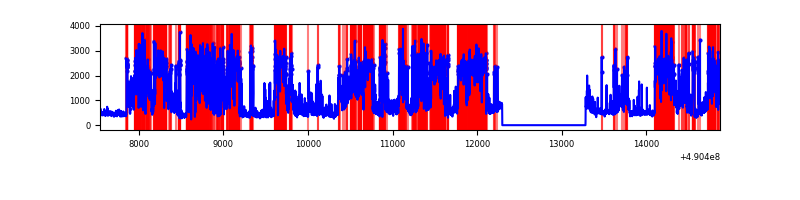 |
| C | 7329 | 6345 | 873 | 873 | 11.91% | 13.76% | 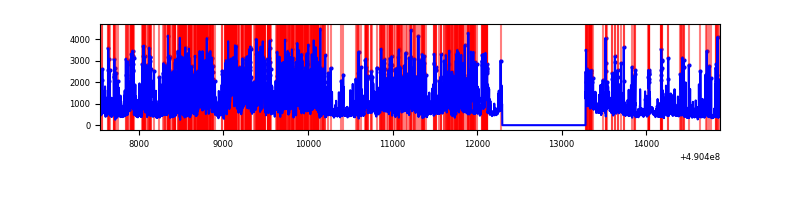 |
| D | 7329 | 6345 | 177 | 177 | 2.42% | 2.79% | 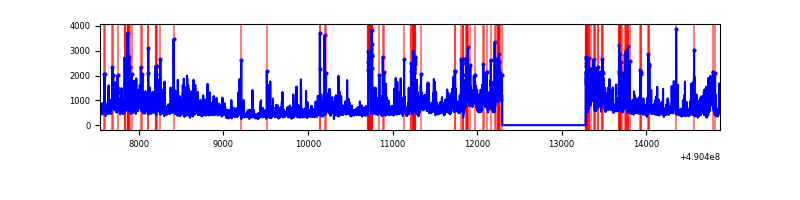 |
Top three noisy pixels from each quadrant. If the there are fewer than three noisy pixels in the level2.evt file, extra rows are filled as -1
| Pixel properties | Quadrant properties | ||||||
|---|---|---|---|---|---|---|---|
| Quadrant | DetID | PixID | Counts | Sigma | Mean | Median | Sigma |
| A | 9 | 191 | 11201825 | 127346.62 | 340 | 331 | 88.0 |
| A | 3 | 14 | 327685 | 3721.6 | 340 | 331 | 88.0 |
| A | 7 | 206 | 212213 | 2408.83 | 340 | 331 | 88.0 |
| B | 10 | 44 | 3766118 | 32336.83 | 545 | 525 | 116.4 |
| B | 10 | 128 | 1279089 | 10979.6 | 545 | 525 | 116.4 |
| B | 9 | 252 | 455960 | 3911.02 | 545 | 525 | 116.4 |
| C | 15 | 224 | 2449343 | 14809.94 | 596 | 591 | 165.3 |
| C | 7 | 80 | 1082384 | 6542.64 | 596 | 591 | 165.3 |
| C | 1 | 16 | 680869 | 4114.29 | 596 | 591 | 165.3 |
| D | 2 | 62 | 1525530 | 8466.37 | 622 | 593 | 180.1 |
| D | 15 | 78 | 259573 | 1437.84 | 622 | 593 | 180.1 |
| D | 8 | 176 | 148724 | 822.42 | 622 | 593 | 180.1 |
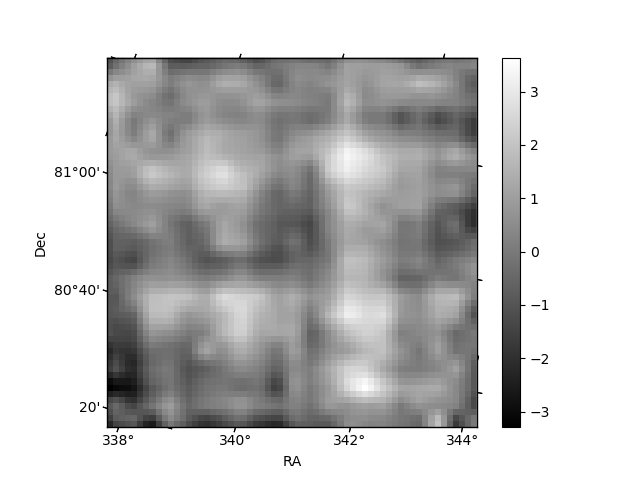
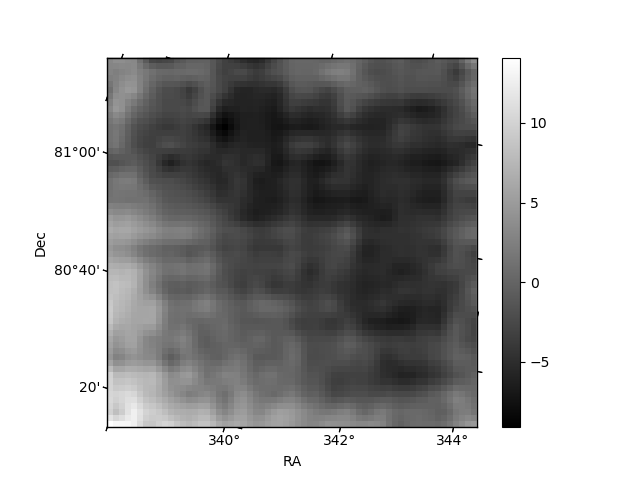
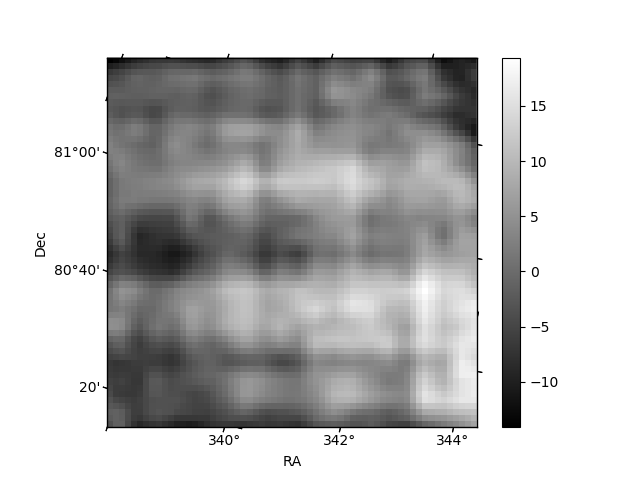
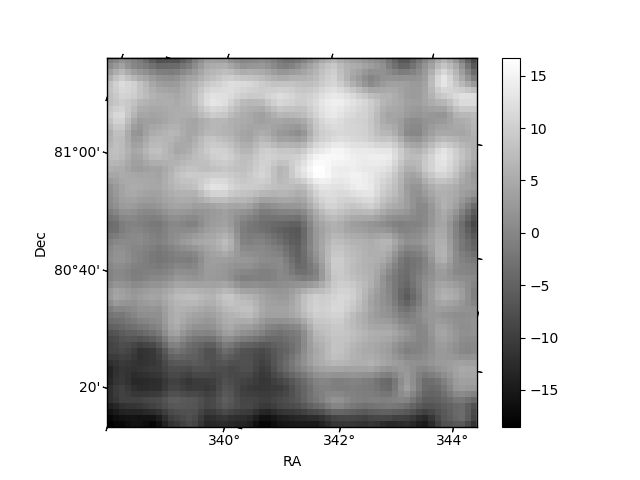
Histogram calculated using DETX and DETY for each event in the final _common_clean file
| Quadrant A | 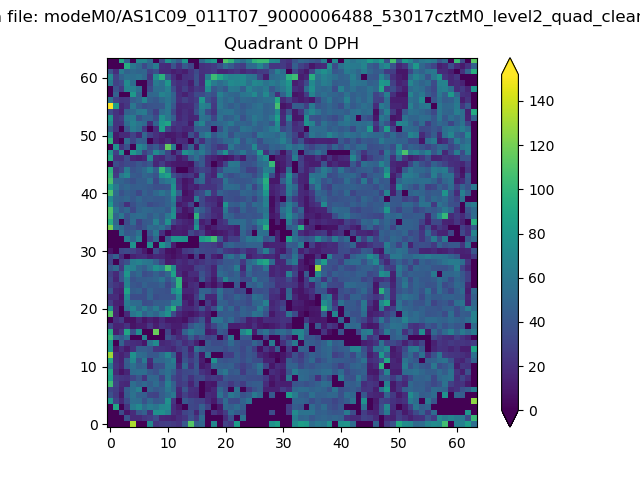 |
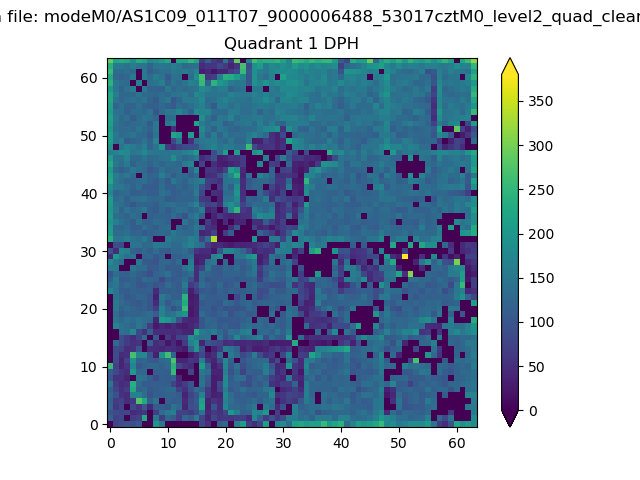 |
Quadrant B |
|---|---|---|---|
| Quadrant D | 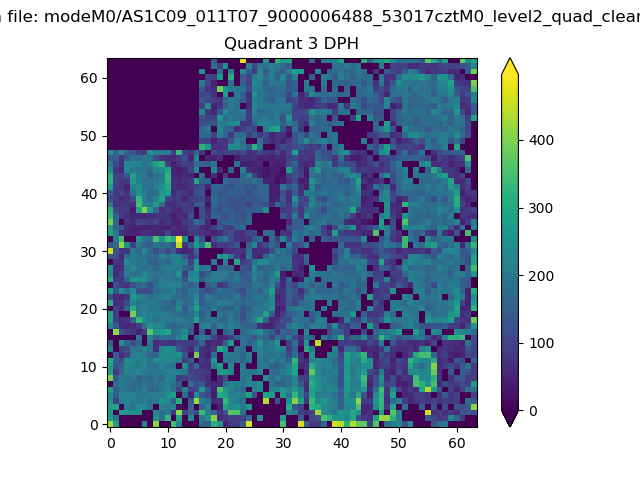 |
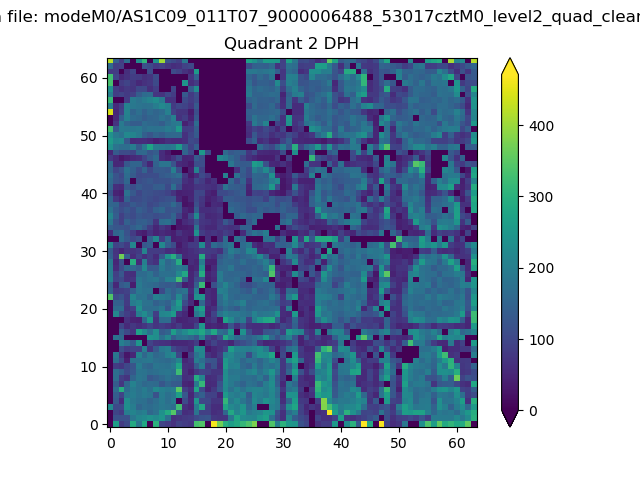 |
Quadrant C |
| Plot type | Count rate plots | Images |
|---|---|---|
| Comparison with Poisson distribution Blue bars denote a histogram of data divided into 1 sec bins. Red curve is a Poisson curve with rate = median count rate of data. |
 |
 |
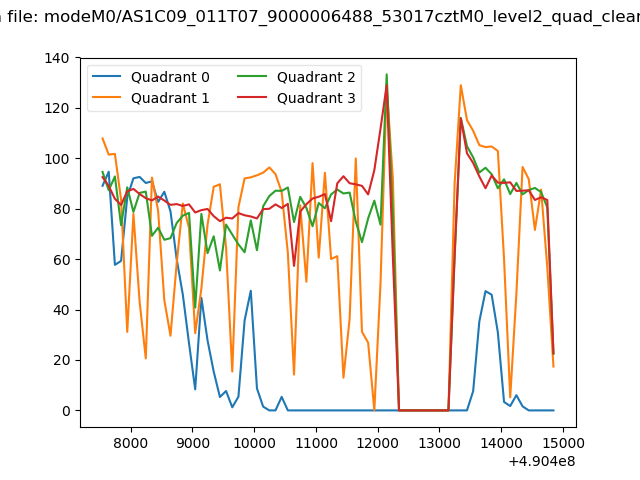
| Quadrant-wise count rates Data is divided into 100 sec bins |
 |
|
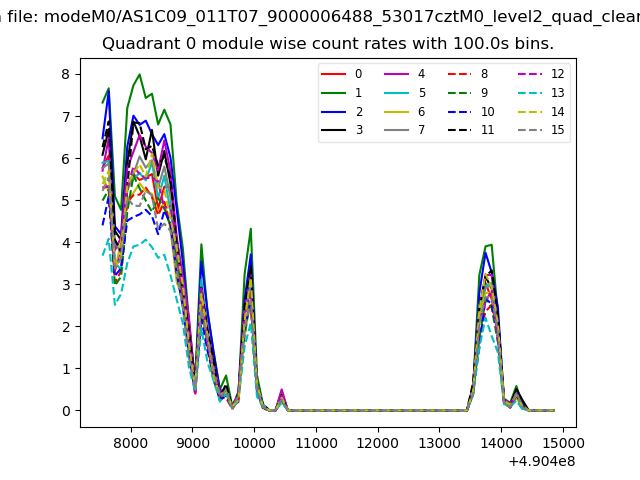
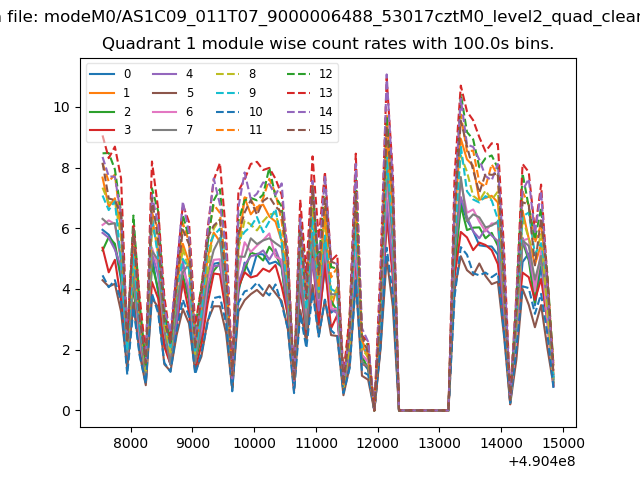
| Module-wise count rates for Quadrant A Data is divided into 100 sec bins |
 |
 |
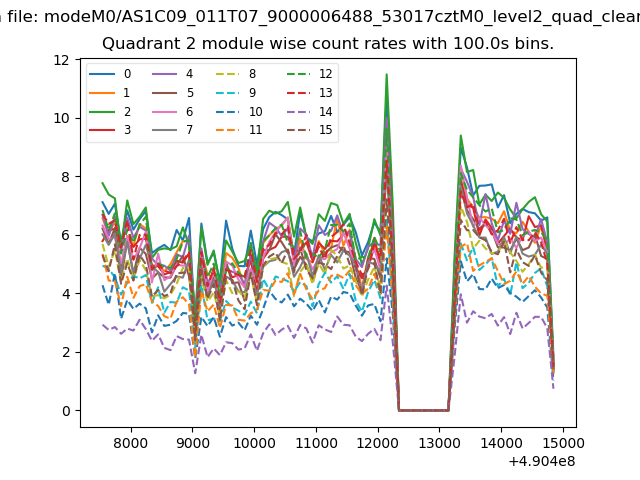
| Module-wise count rates for Quadrant B Data is divided into 100 sec bins |
 |
 |
| Module-wise count rates for Quadrant C Data is divided into 100 sec bins |
 |
 |
| Module-wise count rates for Quadrant D Data is divided into 100 sec bins |
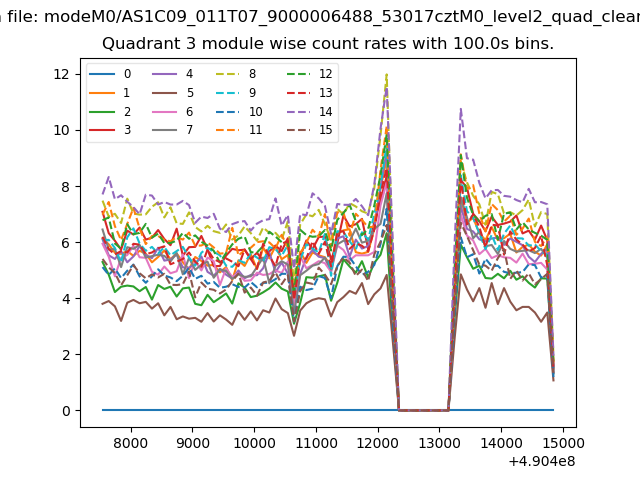 |
 |
| Parameter | Plot |
|---|---|
| CZT HV Monitor | 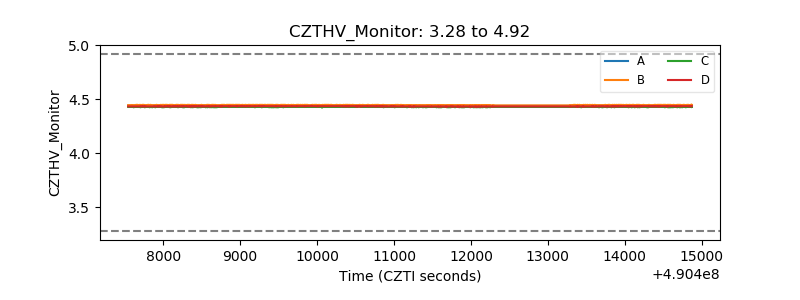 |
| D_VDD | 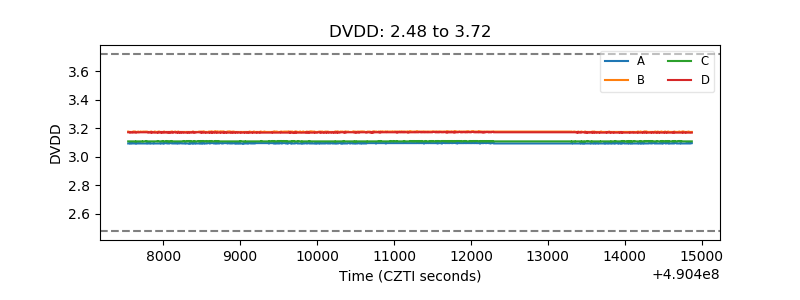 |
| Temperature 1 | 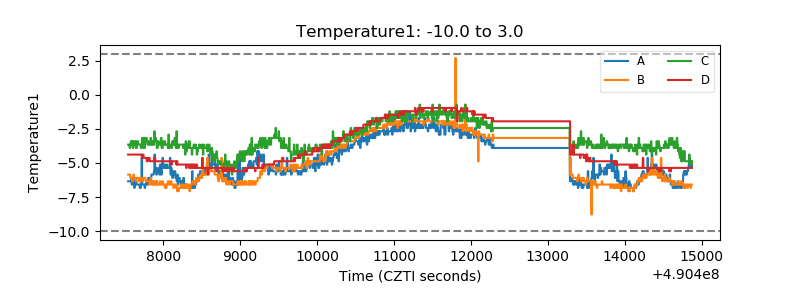 |
| Veto HV Monitor | 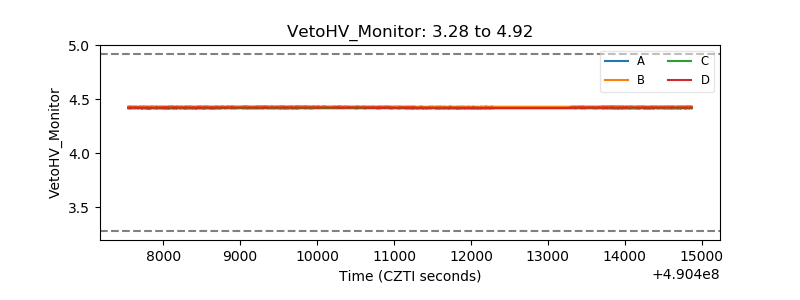 |
| Veto LLD | 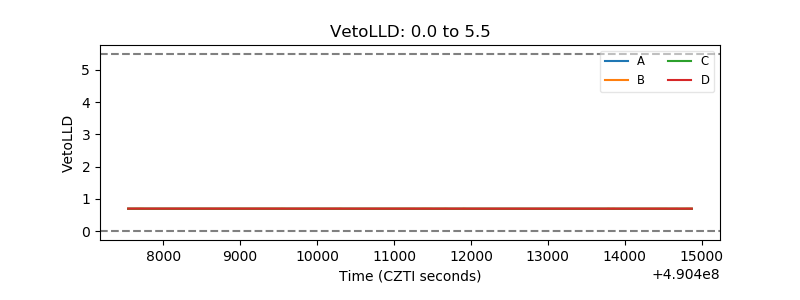 |
| Alpha Counter | 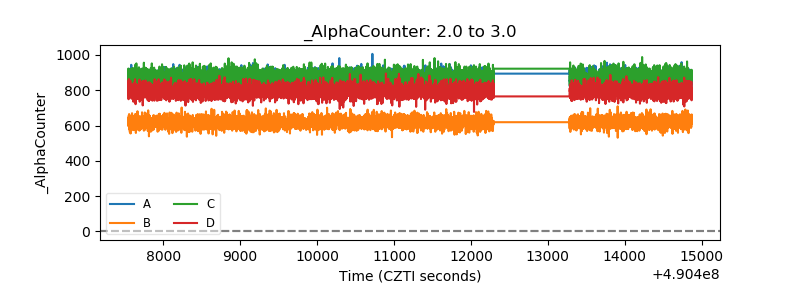 |
| _CPM_Rate | 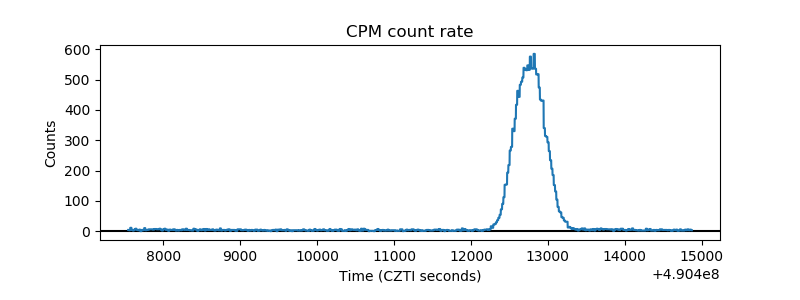 |
| CZT Counter | 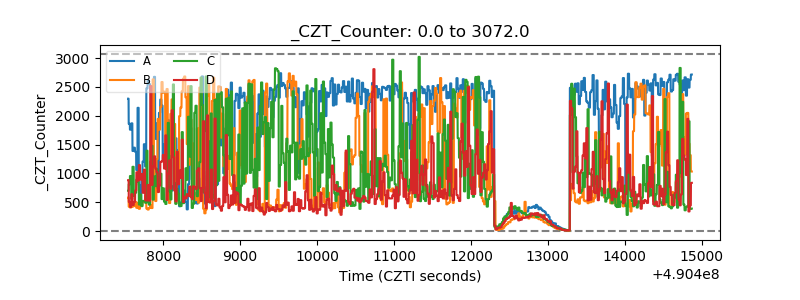 |
| +2.5 Volts monitor | 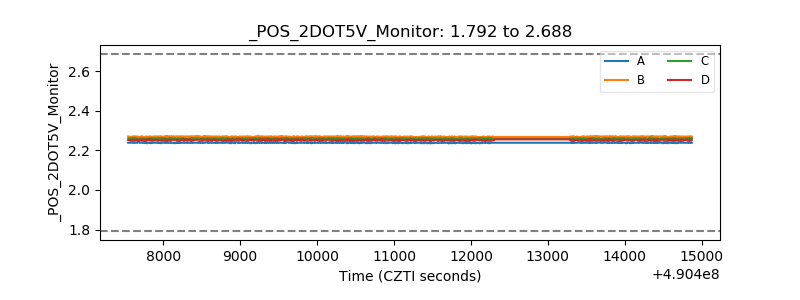 |
| +5 Volts monitor |  |
| _ROLL_ROT | 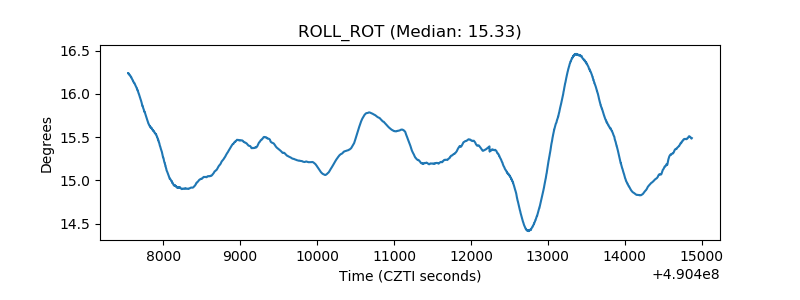 |
| _Roll_DEC | 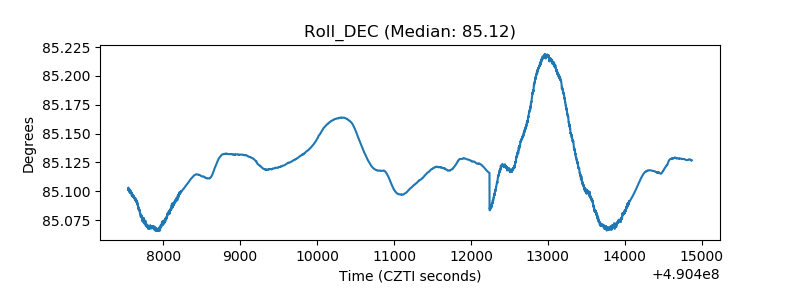 |
| _Roll_RA | 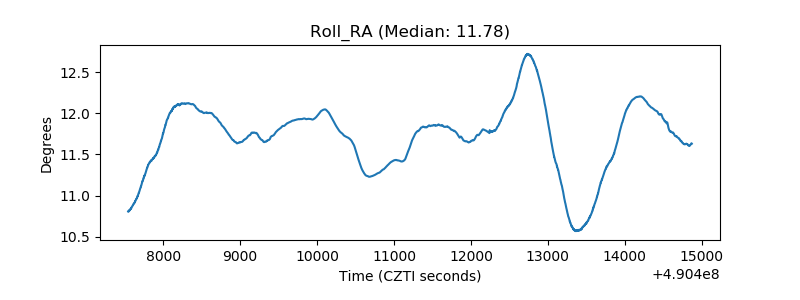 |
| Veto Counter | 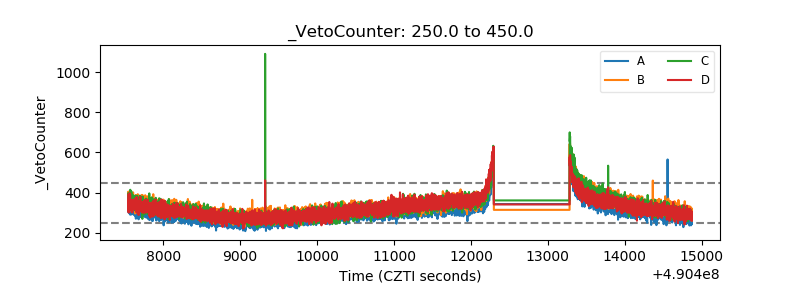 |