| Param | Original file | Final file |
|---|---|---|
| Filename | modeM0/AS1C09_011T07_9000006488_53018cztM0_level2.fits | modeM0/AS1C09_011T07_9000006488_53018cztM0_level2_quad_clean.evt |
| Size (bytes) | 1,100,090,880 | 68,374,080 |
| Size | 1.0 GB | 65.2 MB |
| Events in quadrant A | 15,372,953 | 114,358 |
| Events in quadrant B | 7,506,211 | 569,617 |
| Events in quadrant C | 10,739,197 | 375,677 |
| Events in quadrant D | 6,587,448 | 543,991 |
| Mode SS | |||
|---|---|---|---|
| Quadrant | BADHDUFLAG | Total packets | Discarded packets |
| A | 0 | 134 | 0 |
| B | 0 | 134 | 0 |
| C | 0 | 134 | 0 |
| D | 0 | 134 | 0 |
| Mode M9 | |||
|---|---|---|---|
| Quadrant | BADHDUFLAG | Total packets | Discarded packets |
| A | 0 | 13 | 0 |
| B | 0 | 14 | 0 |
| C | 0 | 14 | 0 |
| D | 0 | 14 | 0 |
| Mode M0 | |||
|---|---|---|---|
| Quadrant | BADHDUFLAG | Total packets | Discarded packets |
| A | 0 | 50101 | 2 |
| B | 0 | 26879 | 2 |
| C | 0 | 36522 | 6 |
| D | 0 | 24194 | 2 |
| Quadrant | Total seconds | Saturated seconds | Saturation percentage |
|---|---|---|---|
| A | 6693 | 5720 | 85.462423% |
| B | 6693 | 1433 | 21.410429% |
| C | 6692 | 2836 | 42.378960% |
| D | 6692 | 740 | 11.057980% |
Noise dominated data is calculated using 1-second bins in cleaned event files. If a bin has >2000 counts, and if more than 50% of those come from <1% of pixels, then it is considered to be noise-dominated and hence unusable.
| Quadrant | # 1 sec bins | Bins with >0 counts | Bins with >2000 counts | High rate bins dominated by noise | Noise dominated (total time) | Noise dominated (detector-on time) | Marked lightcurve |
|---|---|---|---|---|---|---|---|
| A | 7798 | 6693 | 5264 | 5264 | 67.50% | 78.65% | 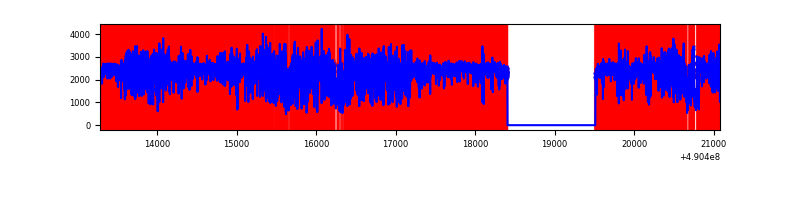 |
| B | 7798 | 6694 | 1205 | 1205 | 15.45% | 18.00% | 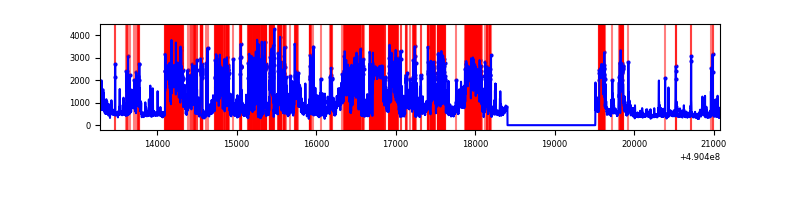 |
| C | 7796 | 6691 | 2651 | 2651 | 34.00% | 39.62% | 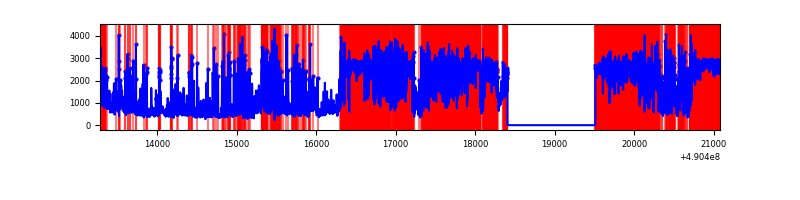 |
| D | 7797 | 6693 | 796 | 796 | 10.21% | 11.89% | 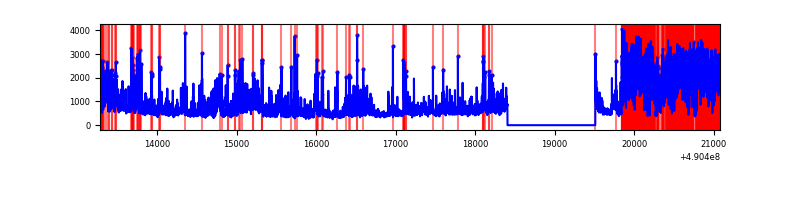 |
Top three noisy pixels from each quadrant. If the there are fewer than three noisy pixels in the level2.evt file, extra rows are filled as -1
| Pixel properties | Quadrant properties | ||||||
|---|---|---|---|---|---|---|---|
| Quadrant | DetID | PixID | Counts | Sigma | Mean | Median | Sigma |
| A | 9 | 191 | 12901591 | 136387.89 | 371 | 362 | 94.6 |
| A | 7 | 206 | 233362 | 2463.21 | 371 | 362 | 94.6 |
| A | 4 | 249 | 216239 | 2282.19 | 371 | 362 | 94.6 |
| B | 10 | 44 | 2479445 | 18432.68 | 628 | 608 | 134.5 |
| B | 10 | 128 | 1209298 | 8987.84 | 628 | 608 | 134.5 |
| B | 9 | 252 | 602528 | 4475.89 | 628 | 608 | 134.5 |
| C | 1 | 241 | 4715179 | 31313.41 | 541 | 537 | 150.6 |
| C | 15 | 224 | 2216435 | 14717.41 | 541 | 537 | 150.6 |
| C | 1 | 16 | 780960 | 5183.36 | 541 | 537 | 150.6 |
| D | 2 | 62 | 2928819 | 15519.93 | 652 | 624 | 188.7 |
| D | 8 | 176 | 325993 | 1724.51 | 652 | 624 | 188.7 |
| D | 15 | 78 | 244098 | 1290.45 | 652 | 624 | 188.7 |
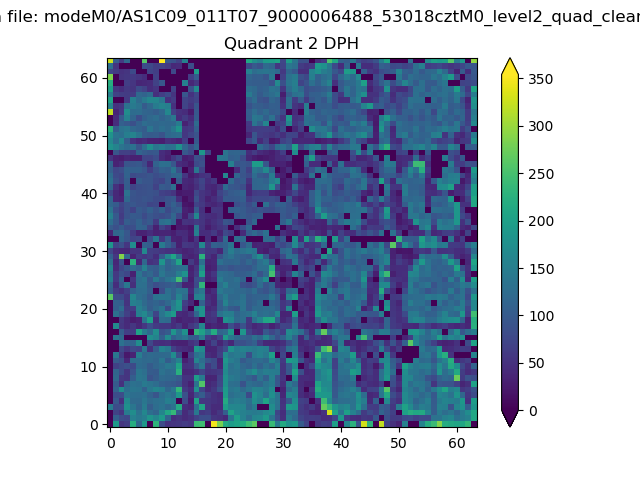
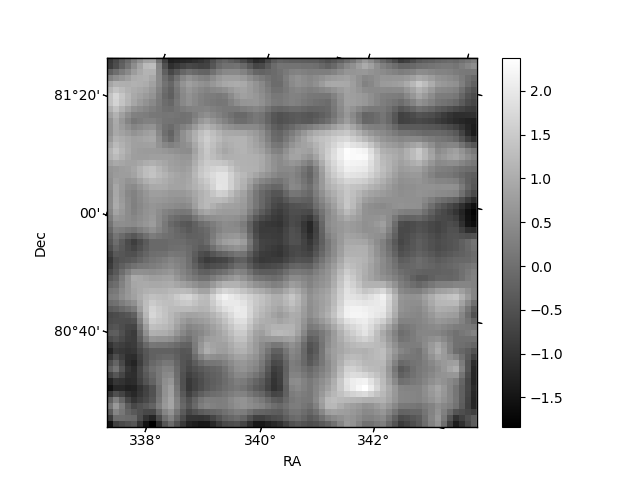
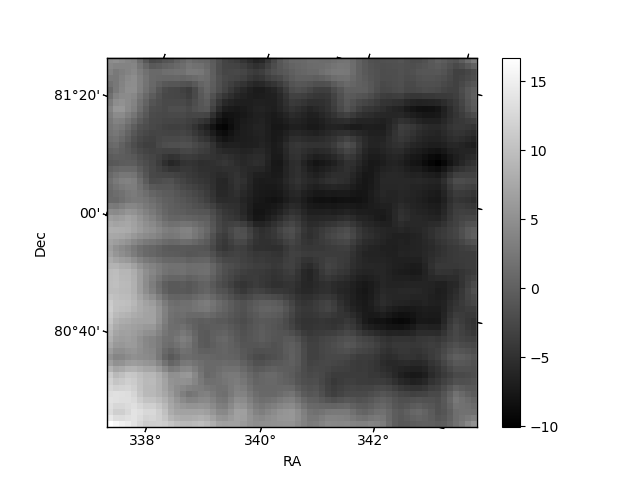
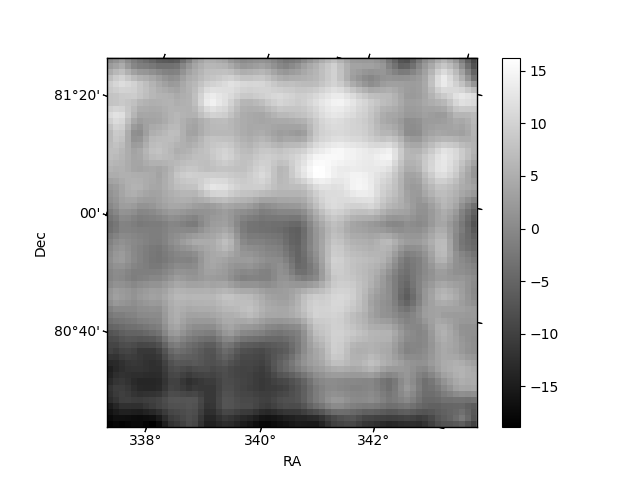
Histogram calculated using DETX and DETY for each event in the final _common_clean file
| Quadrant A | 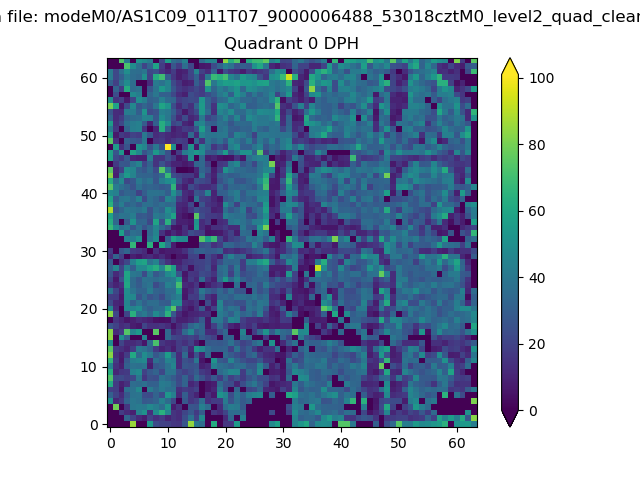 |
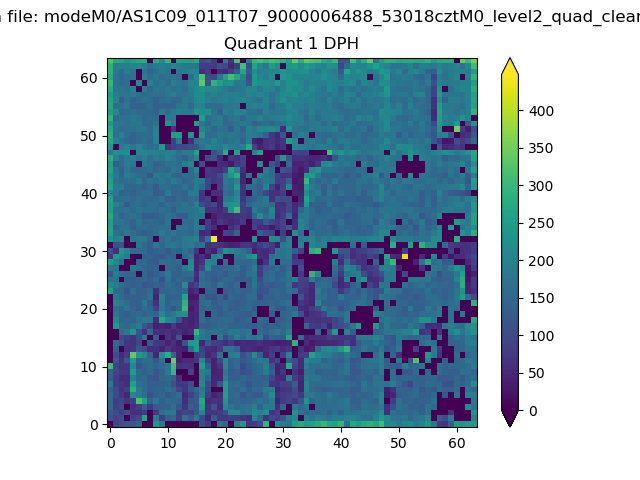 |
Quadrant B |
|---|---|---|---|
| Quadrant D | 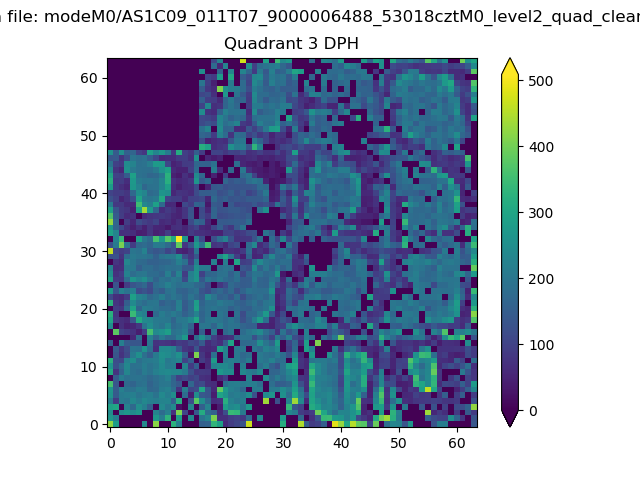 |
 |
Quadrant C |
| Plot type | Count rate plots | Images |
|---|---|---|
| Comparison with Poisson distribution Blue bars denote a histogram of data divided into 1 sec bins. Red curve is a Poisson curve with rate = median count rate of data. |
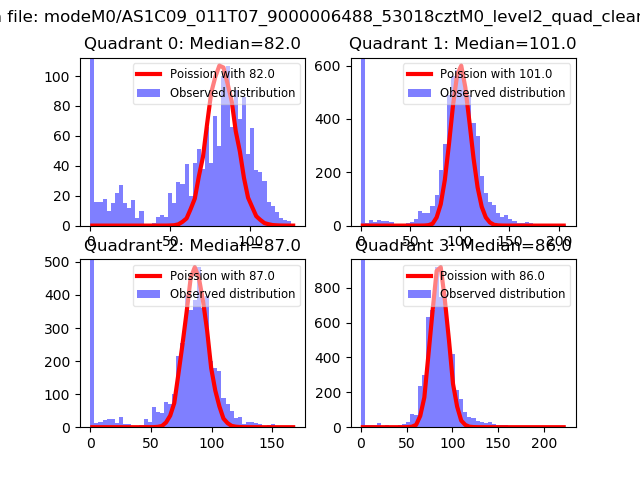 |
 |
| Quadrant-wise count rates Data is divided into 100 sec bins |
 |
|
| Module-wise count rates for Quadrant A Data is divided into 100 sec bins |
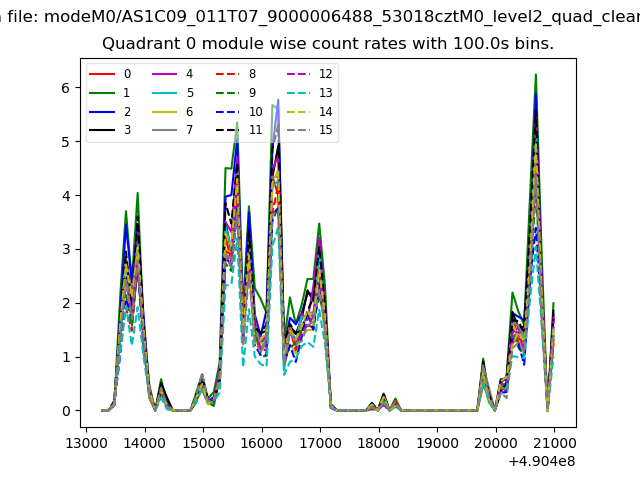 |
 |
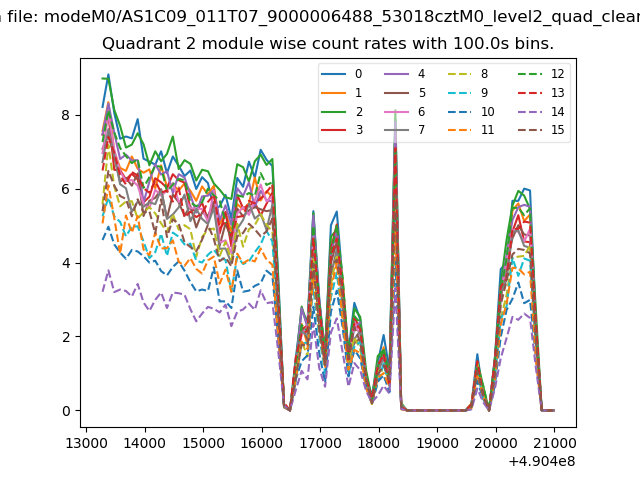
| Module-wise count rates for Quadrant B Data is divided into 100 sec bins |
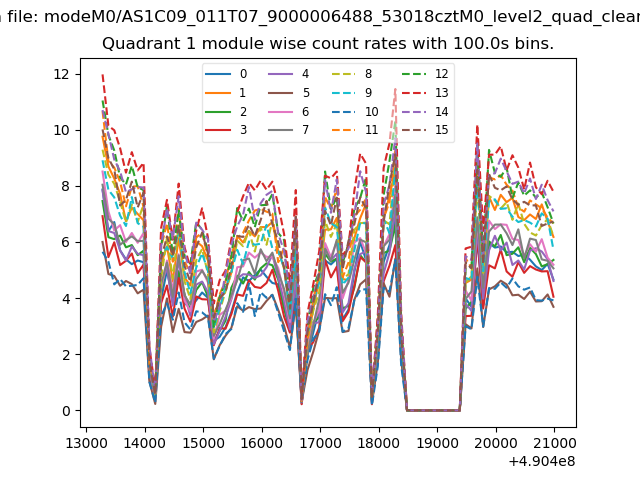 |
 |
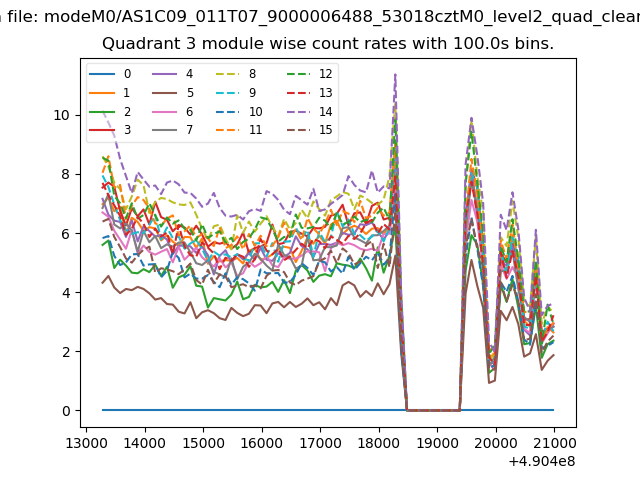
| Module-wise count rates for Quadrant C Data is divided into 100 sec bins |
 |
 |
| Module-wise count rates for Quadrant D Data is divided into 100 sec bins |
 |
 |
| Parameter | Plot |
|---|---|
| CZT HV Monitor | 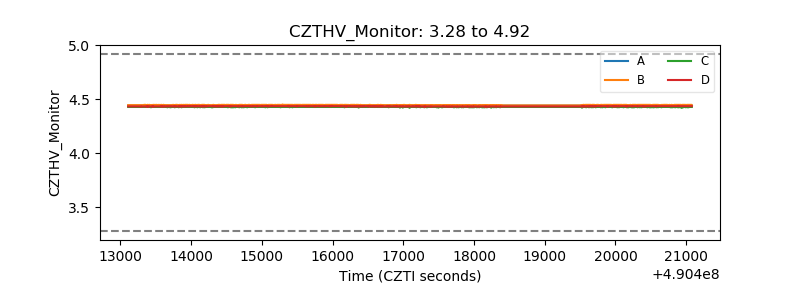 |
| D_VDD | 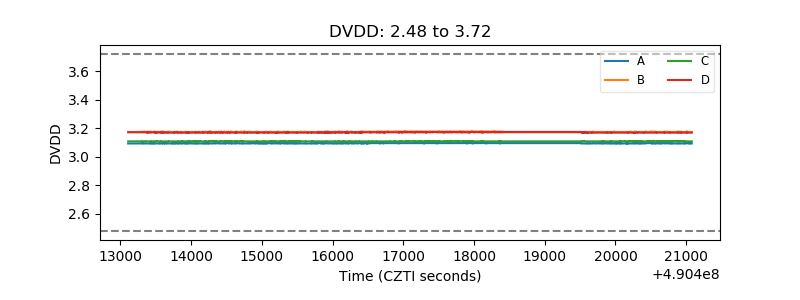 |
| Temperature 1 | 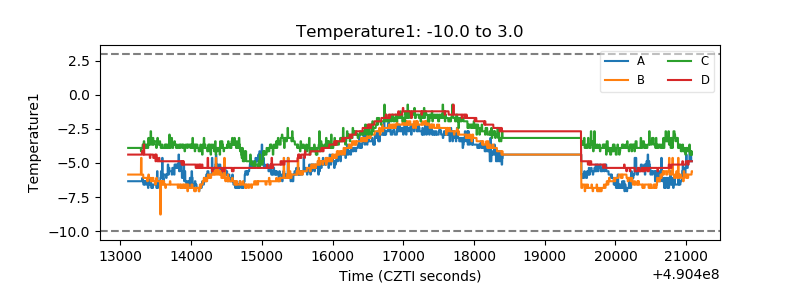 |
| Veto HV Monitor | 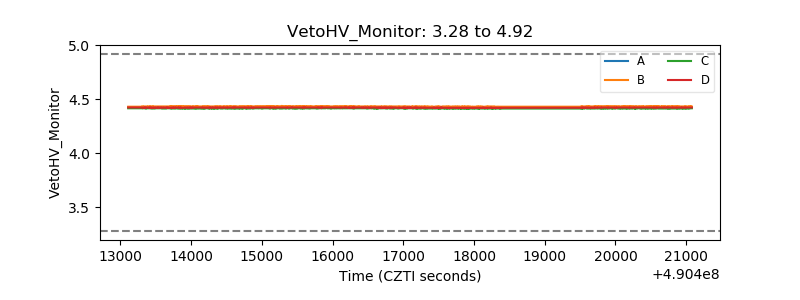 |
| Veto LLD | 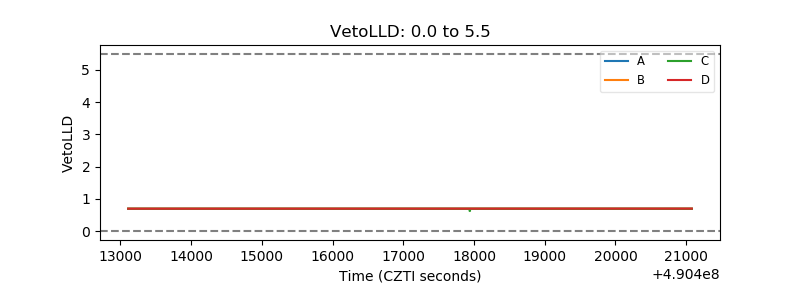 |
| Alpha Counter |  |
| _CPM_Rate | 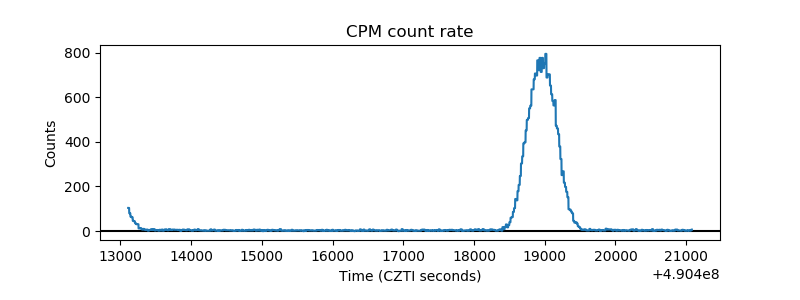 |
| CZT Counter | 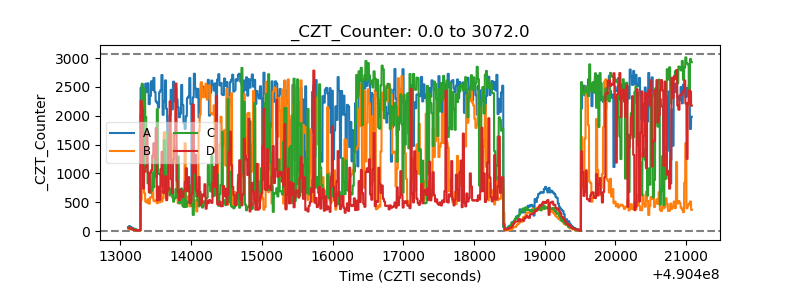 |
| +2.5 Volts monitor | 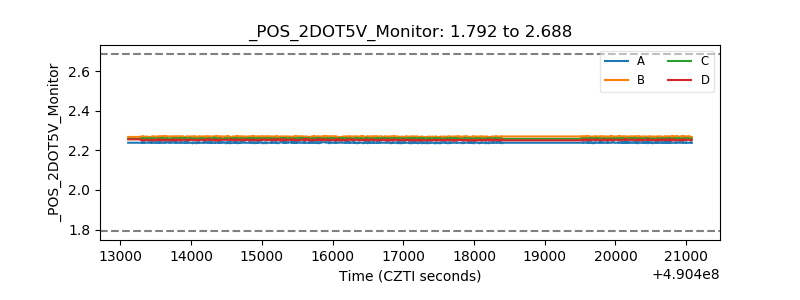 |
| +5 Volts monitor | 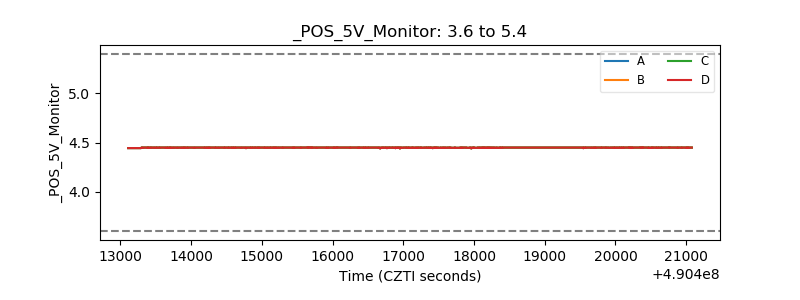 |
| _ROLL_ROT | 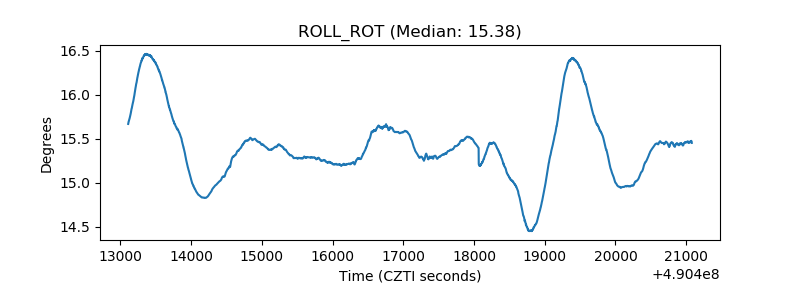 |
| _Roll_DEC | 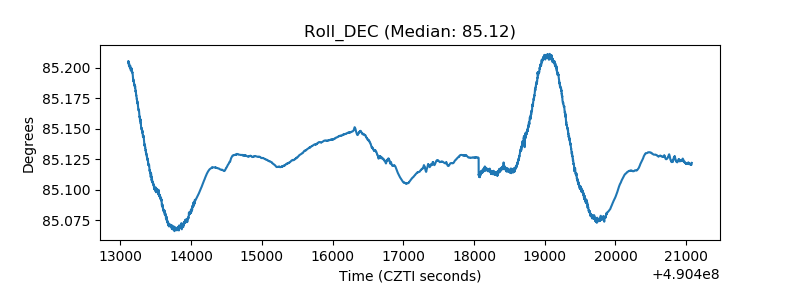 |
| _Roll_RA | 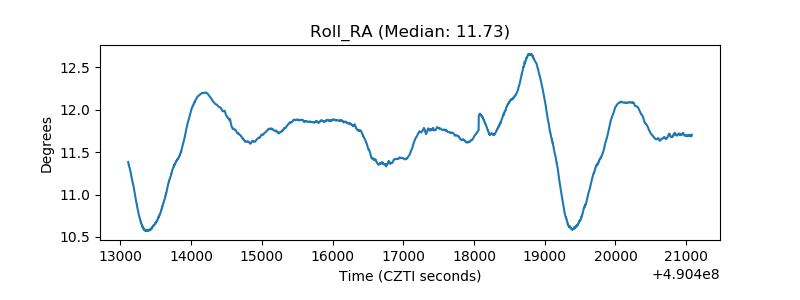 |
| Veto Counter | 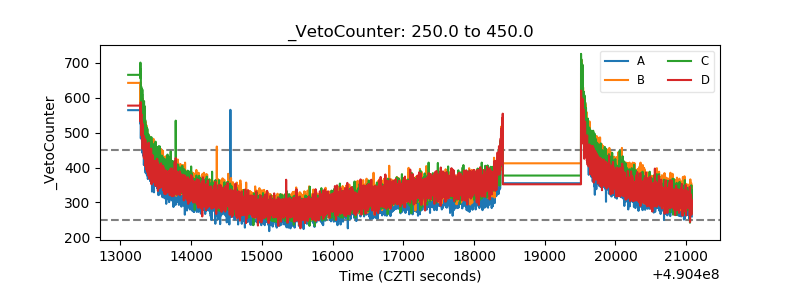 |