| Param | Original file | Final file |
|---|---|---|
| Filename | modeM0/AS1C09_011T07_9000006488_53019cztM0_level2.fits | modeM0/AS1C09_011T07_9000006488_53019cztM0_level2_quad_clean.evt |
| Size (bytes) | 971,216,640 | 54,218,880 |
| Size | 926.2 MB | 51.7 MB |
| Events in quadrant A | 13,275,468 | 43,276 |
| Events in quadrant B | 4,478,462 | 526,905 |
| Events in quadrant C | 8,237,803 | 368,243 |
| Events in quadrant D | 9,529,032 | 312,853 |
| Mode SS | |||
|---|---|---|---|
| Quadrant | BADHDUFLAG | Total packets | Discarded packets |
| A | 0 | 112 | 0 |
| B | 0 | 112 | 0 |
| C | 0 | 112 | 0 |
| D | 0 | 112 | 0 |
| Mode M9 | |||
|---|---|---|---|
| Quadrant | BADHDUFLAG | Total packets | Discarded packets |
| A | 0 | 12 | 0 |
| B | 0 | 12 | 0 |
| C | 0 | 12 | 0 |
| D | 0 | 12 | 0 |
| Mode M0 | |||
|---|---|---|---|
| Quadrant | BADHDUFLAG | Total packets | Discarded packets |
| A | 0 | 43117 | 1 |
| B | 0 | 17240 | 1 |
| C | 0 | 28308 | 1 |
| D | 0 | 32167 | 1 |
| Quadrant | Total seconds | Saturated seconds | Saturation percentage |
|---|---|---|---|
| A | 5578 | 5237 | 93.886698% |
| B | 5579 | 656 | 11.758380% |
| C | 5578 | 1889 | 33.865185% |
| D | 5578 | 2469 | 44.263177% |
Noise dominated data is calculated using 1-second bins in cleaned event files. If a bin has >2000 counts, and if more than 50% of those come from <1% of pixels, then it is considered to be noise-dominated and hence unusable.
| Quadrant | # 1 sec bins | Bins with >0 counts | Bins with >2000 counts | High rate bins dominated by noise | Noise dominated (total time) | Noise dominated (detector-on time) | Marked lightcurve |
|---|---|---|---|---|---|---|---|
| A | 6717 | 5577 | 4922 | 4922 | 73.28% | 88.26% | 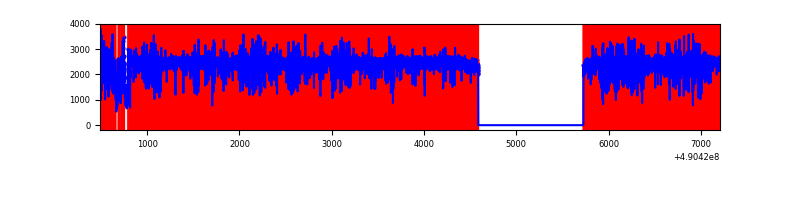 |
| B | 6719 | 5580 | 508 | 508 | 7.56% | 9.10% | 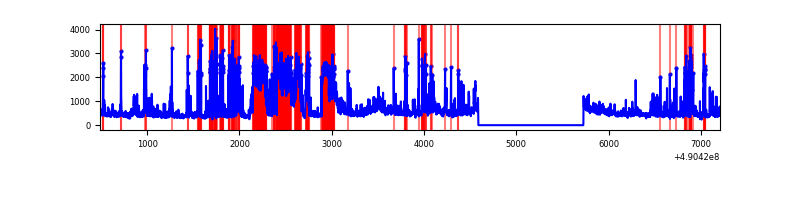 |
| C | 6718 | 5579 | 1753 | 1753 | 26.09% | 31.42% | 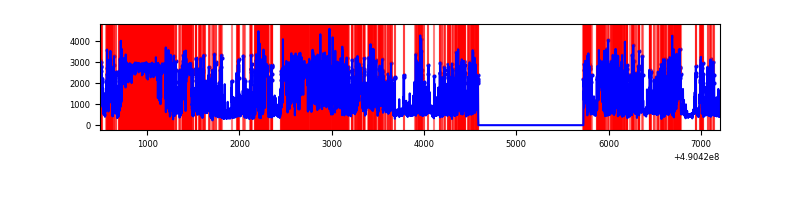 |
| D | 6718 | 5579 | 2396 | 2396 | 35.67% | 42.95% | 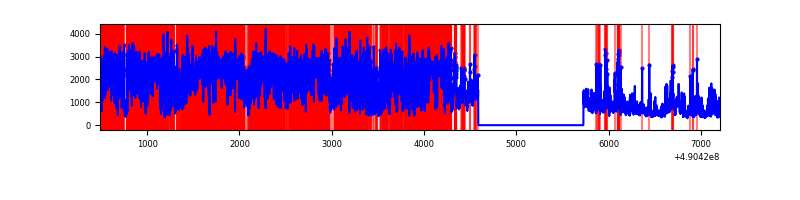 |
Top three noisy pixels from each quadrant. If the there are fewer than three noisy pixels in the level2.evt file, extra rows are filled as -1
| Pixel properties | Quadrant properties | ||||||
|---|---|---|---|---|---|---|---|
| Quadrant | DetID | PixID | Counts | Sigma | Mean | Median | Sigma |
| A | 9 | 191 | 10719798 | 155019.03 | 270 | 263 | 69.1 |
| A | 7 | 206 | 599164 | 8660.92 | 270 | 263 | 69.1 |
| A | 3 | 62 | 322748 | 4663.57 | 270 | 263 | 69.1 |
| B | 10 | 44 | 1838257 | 15854.0 | 546 | 528 | 115.9 |
| B | 10 | 128 | 162454 | 1396.93 | 546 | 528 | 115.9 |
| B | 10 | 247 | 66762 | 571.4 | 546 | 528 | 115.9 |
| C | 1 | 241 | 3023303 | 23083.64 | 471 | 464 | 131.0 |
| C | 15 | 224 | 2658669 | 20299.15 | 471 | 464 | 131.0 |
| C | 1 | 16 | 330774 | 2522.38 | 471 | 464 | 131.0 |
| D | 2 | 62 | 6792830 | 48346.74 | 484 | 461 | 140.5 |
| D | 15 | 78 | 373155 | 2652.76 | 484 | 461 | 140.5 |
| D | 2 | 249 | 93209 | 660.16 | 484 | 461 | 140.5 |
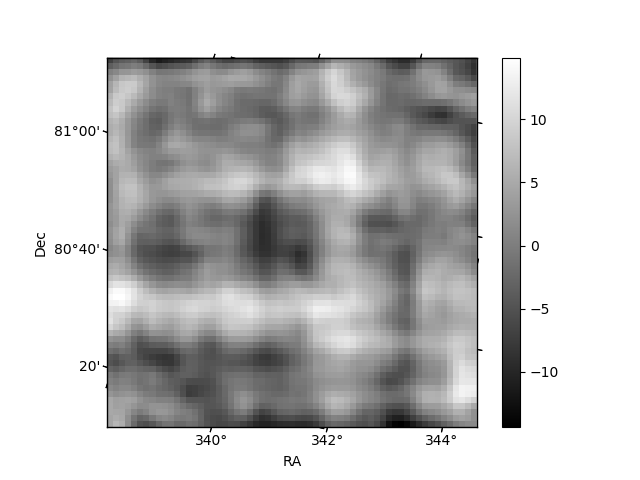
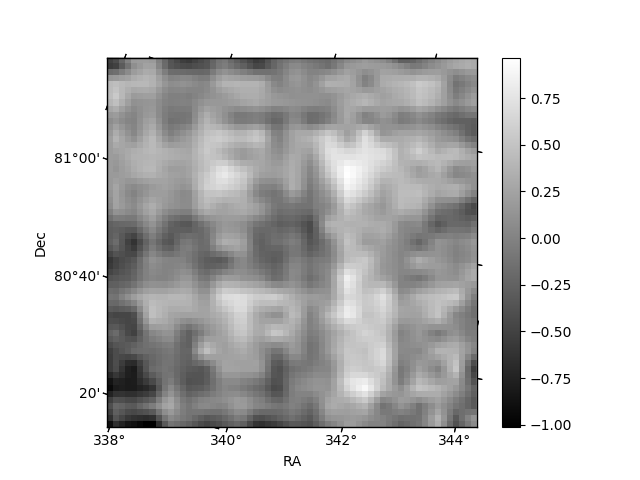
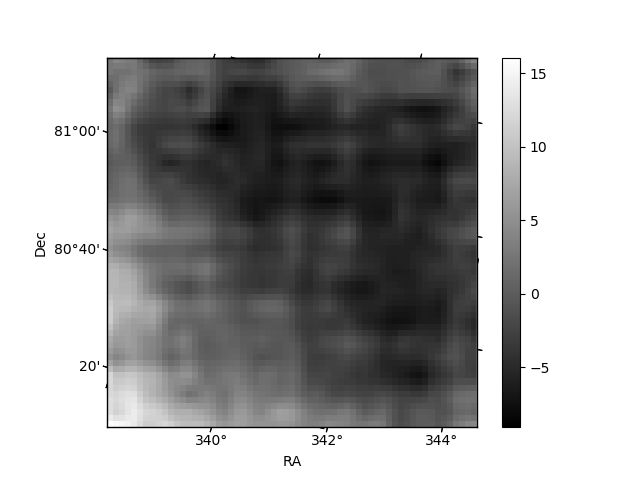
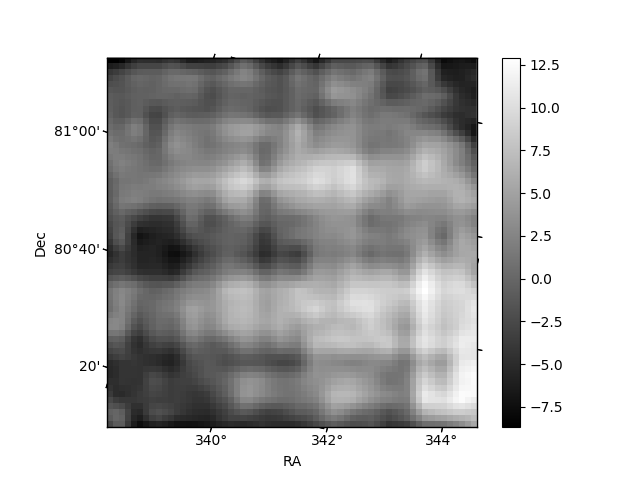
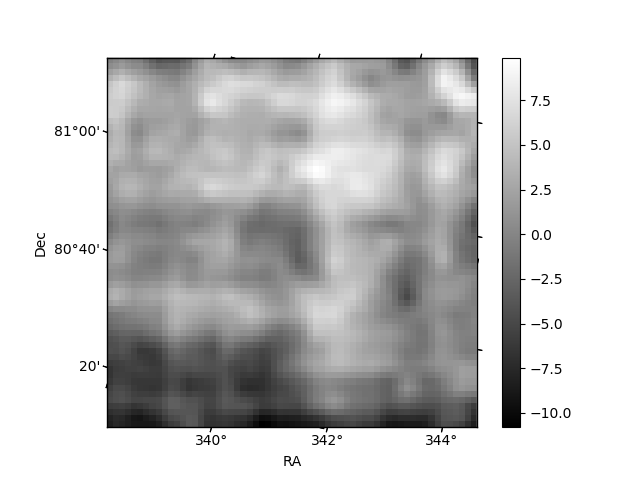
Histogram calculated using DETX and DETY for each event in the final _common_clean file
| Quadrant A | 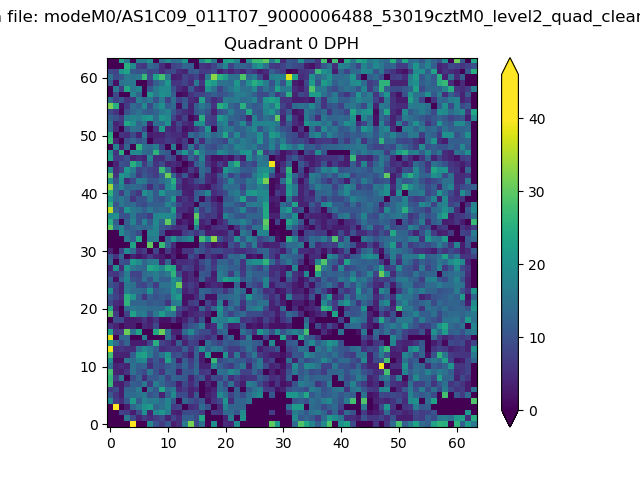 |
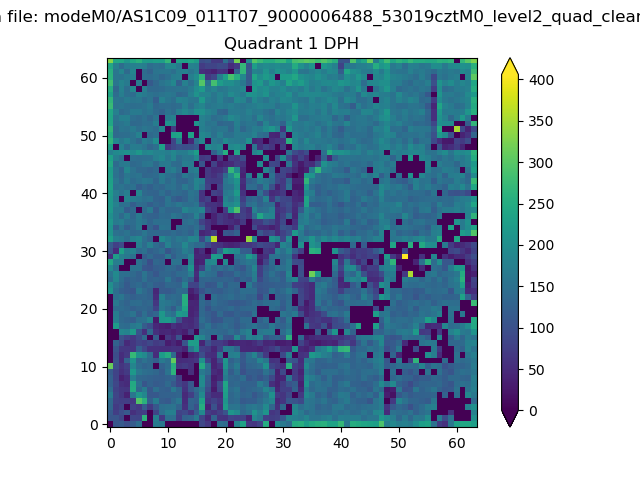 |
Quadrant B |
|---|---|---|---|
| Quadrant D |  |
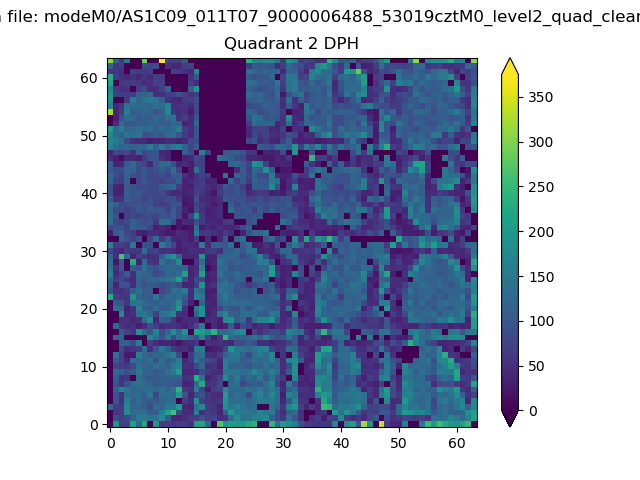 |
Quadrant C |
| Plot type | Count rate plots | Images |
|---|---|---|
| Comparison with Poisson distribution Blue bars denote a histogram of data divided into 1 sec bins. Red curve is a Poisson curve with rate = median count rate of data. |
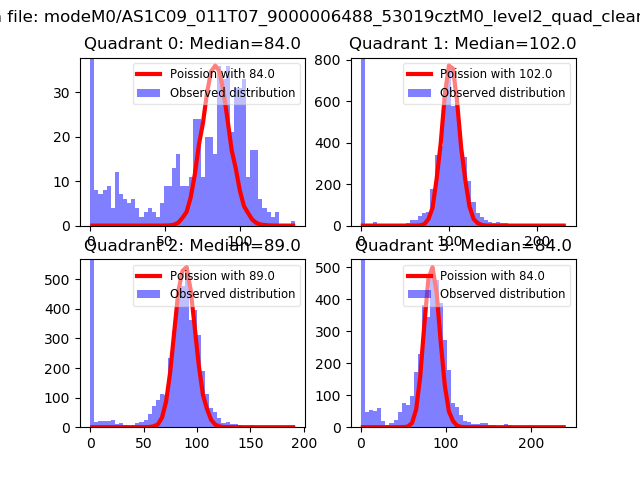 |
 |
| Quadrant-wise count rates Data is divided into 100 sec bins |
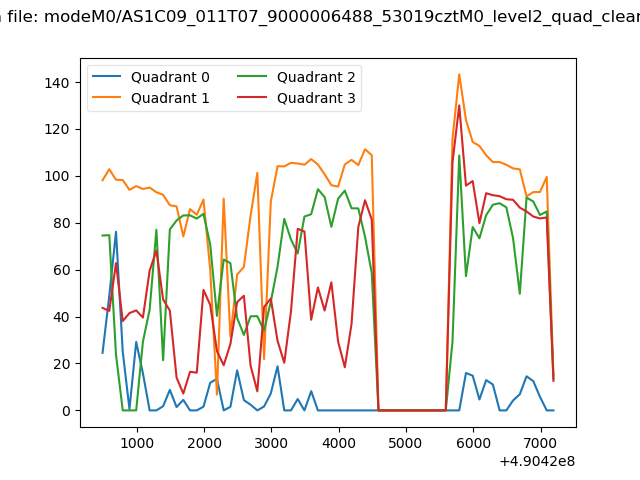 |
|
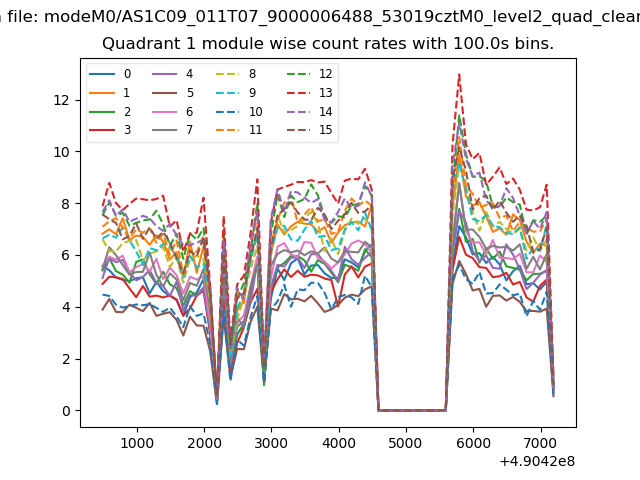
| Module-wise count rates for Quadrant A Data is divided into 100 sec bins |
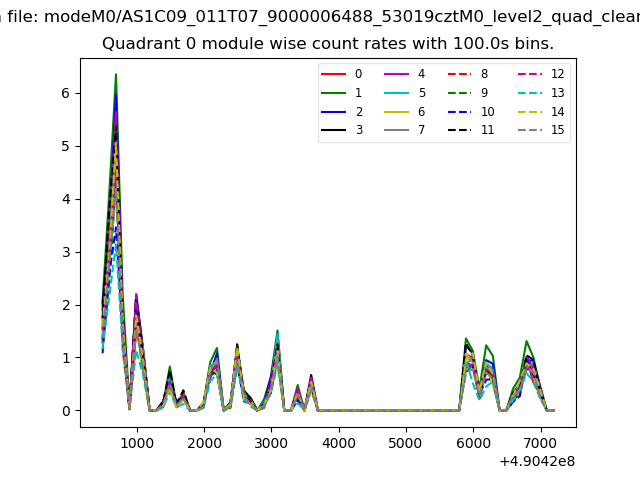 |
 |
| Module-wise count rates for Quadrant B Data is divided into 100 sec bins |
 |
 |
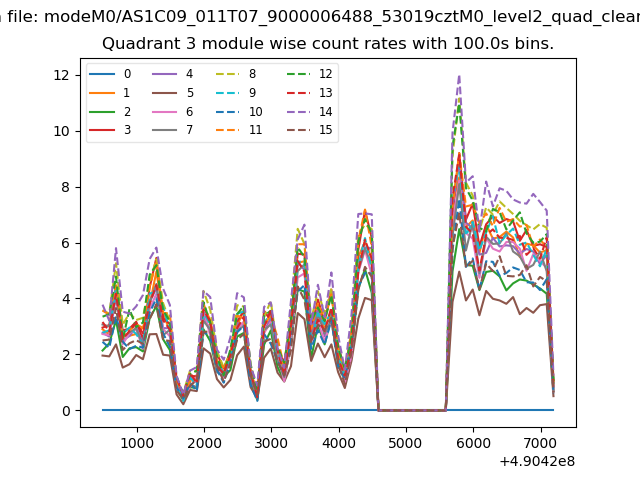
| Module-wise count rates for Quadrant C Data is divided into 100 sec bins |
 |
 |
| Module-wise count rates for Quadrant D Data is divided into 100 sec bins |
 |
 |
| Parameter | Plot |
|---|---|
| CZT HV Monitor | 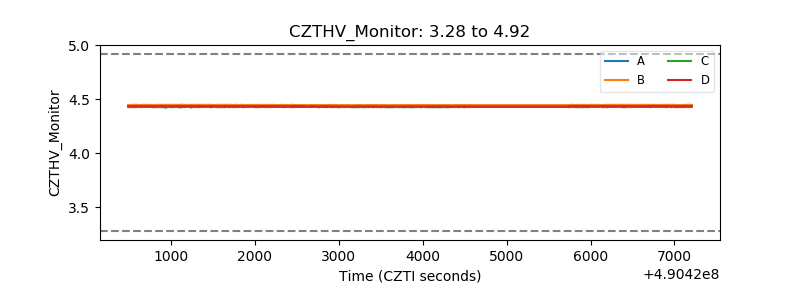 |
| D_VDD | 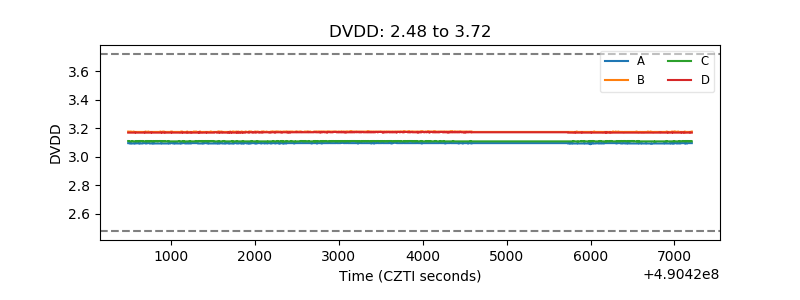 |
| Temperature 1 | 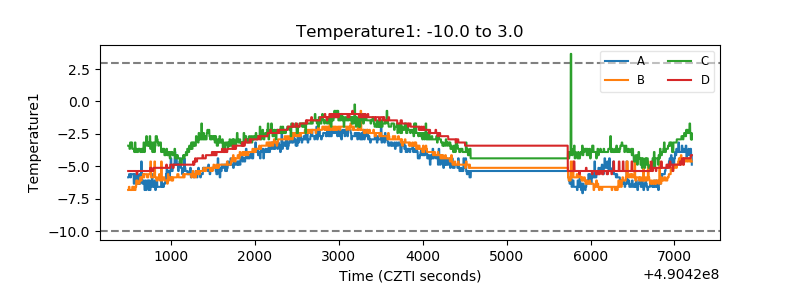 |
| Veto HV Monitor | 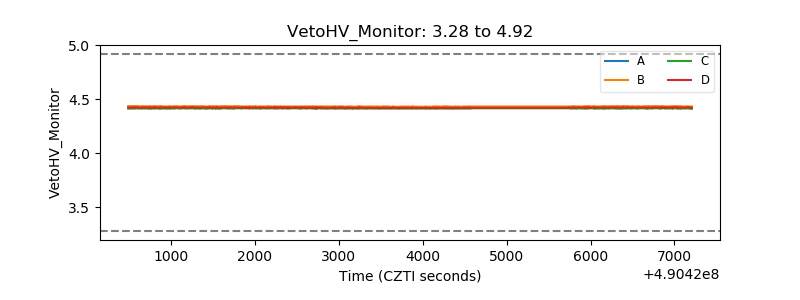 |
| Veto LLD | 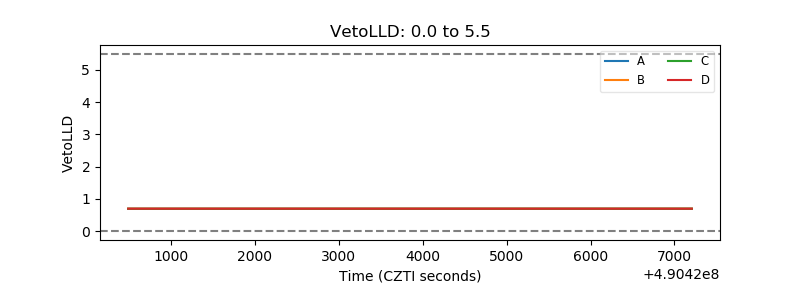 |
| Alpha Counter | 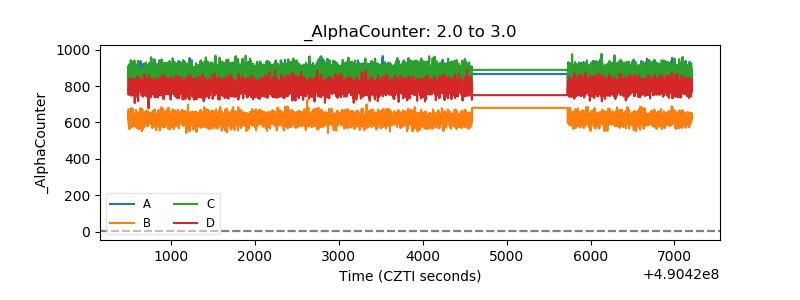 |
| _CPM_Rate | 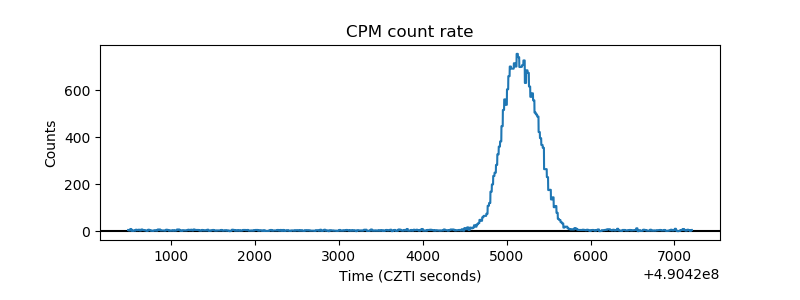 |
| CZT Counter | 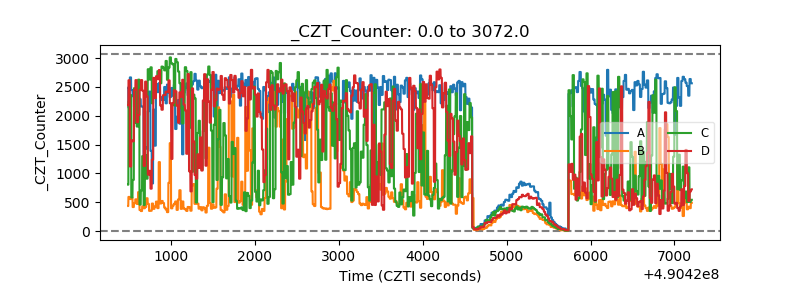 |
| +2.5 Volts monitor |  |
| +5 Volts monitor |  |
| _ROLL_ROT | 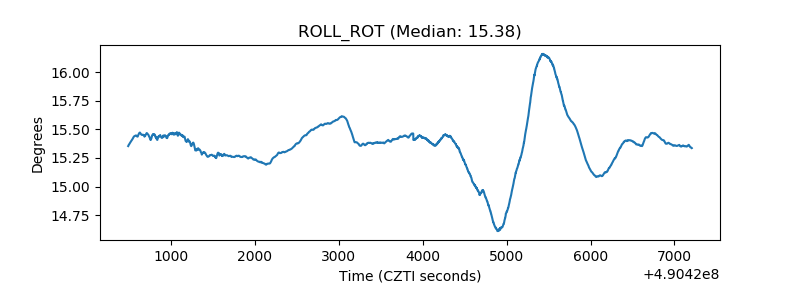 |
| _Roll_DEC | 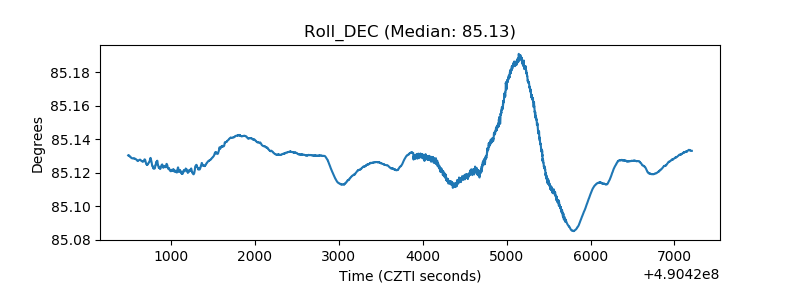 |
| _Roll_RA | 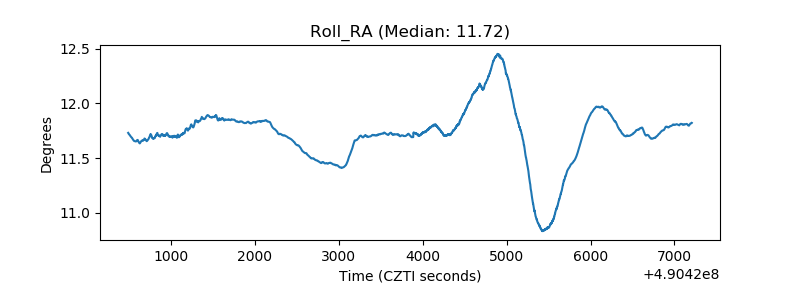 |
| Veto Counter | 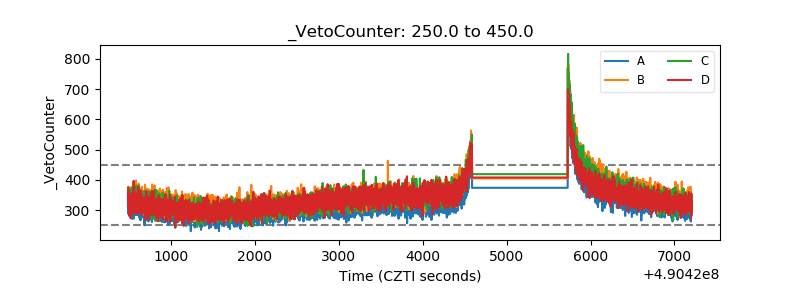 |