| Param | Original file | Final file |
|---|---|---|
| Filename | modeM0/AS1C09_011T07_9000006488_53020cztM0_level2.fits | modeM0/AS1C09_011T07_9000006488_53020cztM0_level2_quad_clean.evt |
| Size (bytes) | 865,342,080 | 59,495,040 |
| Size | 825.3 MB | 56.7 MB |
| Events in quadrant A | 13,959,437 | 5,765 |
| Events in quadrant B | 4,068,654 | 556,469 |
| Events in quadrant C | 8,366,716 | 362,832 |
| Events in quadrant D | 5,193,436 | 475,361 |
| Mode SS | |||
|---|---|---|---|
| Quadrant | BADHDUFLAG | Total packets | Discarded packets |
| A | 0 | 116 | 0 |
| B | 0 | 116 | 0 |
| C | 0 | 116 | 0 |
| D | 0 | 116 | 0 |
| Mode M9 | |||
|---|---|---|---|
| Quadrant | BADHDUFLAG | Total packets | Discarded packets |
| A | 0 | 12 | 0 |
| B | 0 | 12 | 0 |
| C | 0 | 12 | 0 |
| D | 0 | 12 | 0 |
| Mode M0 | |||
|---|---|---|---|
| Quadrant | BADHDUFLAG | Total packets | Discarded packets |
| A | 0 | 45224 | 1 |
| B | 0 | 16039 | 1 |
| C | 0 | 28840 | 1 |
| D | 0 | 19482 | 1 |
| Quadrant | Total seconds | Saturated seconds | Saturation percentage |
|---|---|---|---|
| A | 5733 | 5692 | 99.284842% |
| B | 5733 | 459 | 8.006279% |
| C | 5733 | 2014 | 35.129949% |
| D | 5733 | 388 | 6.767835% |
Noise dominated data is calculated using 1-second bins in cleaned event files. If a bin has >2000 counts, and if more than 50% of those come from <1% of pixels, then it is considered to be noise-dominated and hence unusable.
| Quadrant | # 1 sec bins | Bins with >0 counts | Bins with >2000 counts | High rate bins dominated by noise | Noise dominated (total time) | Noise dominated (detector-on time) | Marked lightcurve |
|---|---|---|---|---|---|---|---|
| A | 6902 | 5732 | 5435 | 5435 | 78.75% | 94.82% | 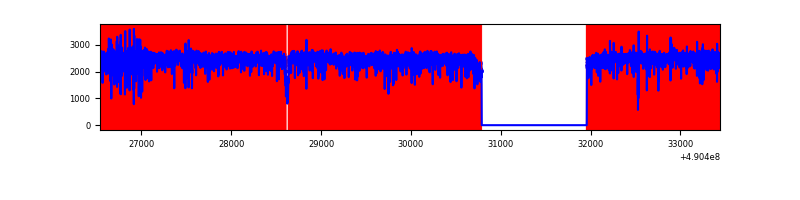 |
| B | 6903 | 5734 | 368 | 368 | 5.33% | 6.42% | 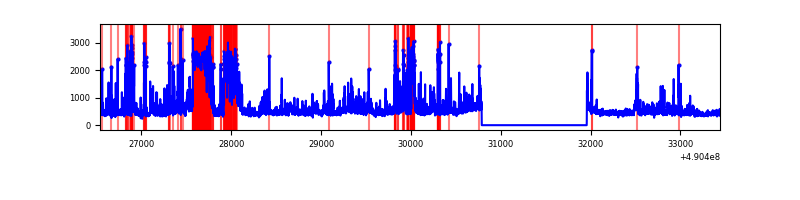 |
| C | 6903 | 5734 | 1857 | 1857 | 26.90% | 32.39% | 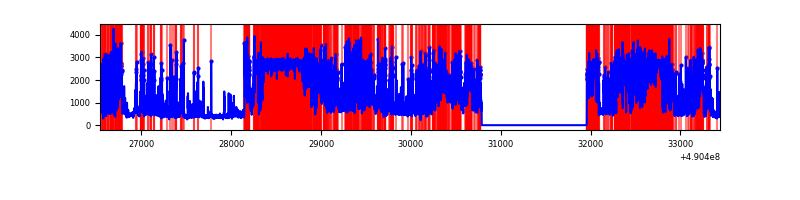 |
| D | 6903 | 5734 | 385 | 385 | 5.58% | 6.71% | 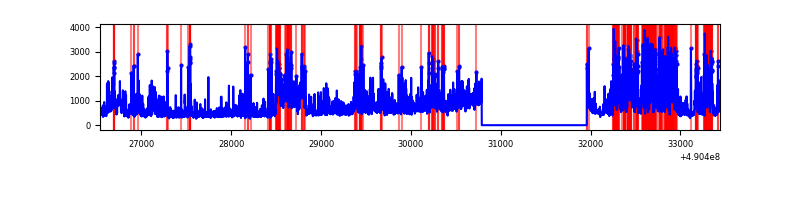 |
Top three noisy pixels from each quadrant. If the there are fewer than three noisy pixels in the level2.evt file, extra rows are filled as -1
| Pixel properties | Quadrant properties | ||||||
|---|---|---|---|---|---|---|---|
| Quadrant | DetID | PixID | Counts | Sigma | Mean | Median | Sigma |
| A | 9 | 191 | 11960022 | 278396.04 | 163 | 158 | 43.0 |
| A | 7 | 206 | 796333 | 18532.98 | 163 | 158 | 43.0 |
| A | 12 | 115 | 209382 | 4870.22 | 163 | 158 | 43.0 |
| B | 10 | 44 | 1144547 | 9514.52 | 567 | 548 | 120.2 |
| B | 10 | 128 | 188297 | 1561.49 | 567 | 548 | 120.2 |
| B | 8 | 128 | 157115 | 1302.15 | 567 | 548 | 120.2 |
| C | 1 | 241 | 2973287 | 22609.09 | 476 | 472 | 131.5 |
| C | 15 | 224 | 2784493 | 21173.26 | 476 | 472 | 131.5 |
| C | 1 | 16 | 401798 | 3052.2 | 476 | 472 | 131.5 |
| D | 2 | 62 | 1055153 | 6648.29 | 558 | 534 | 158.6 |
| D | 15 | 78 | 643469 | 4053.04 | 558 | 534 | 158.6 |
| D | 12 | 17 | 531680 | 3348.33 | 558 | 534 | 158.6 |
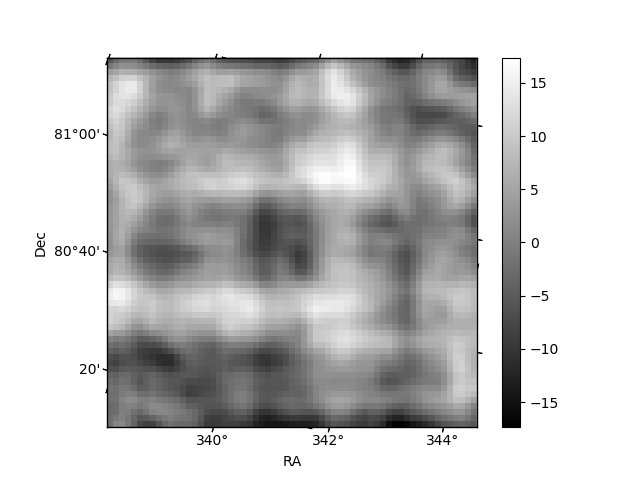
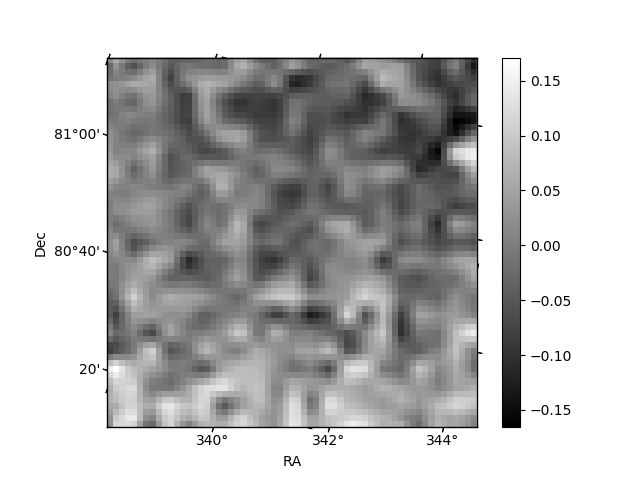
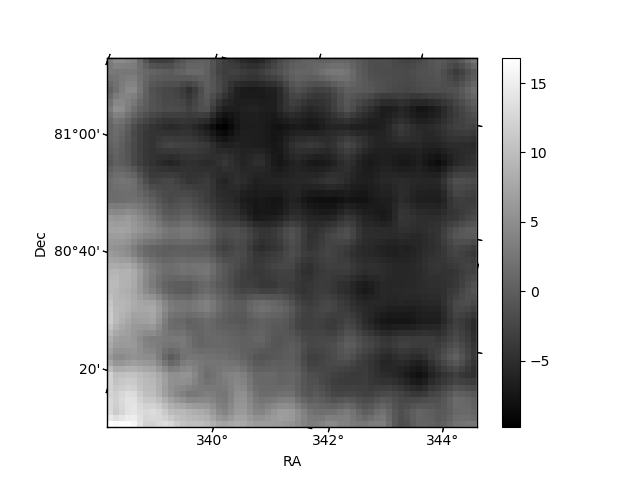
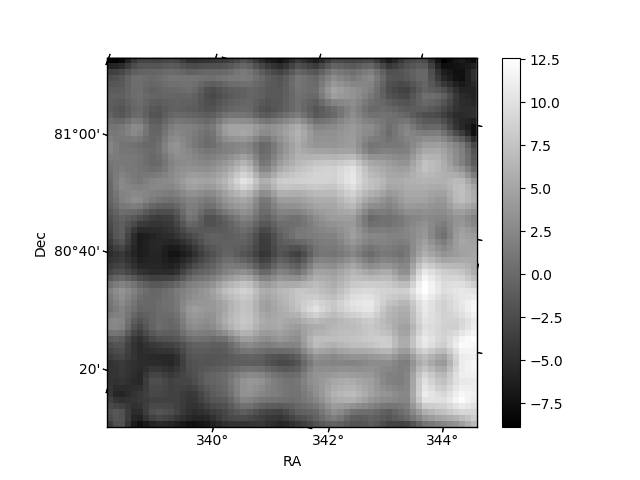
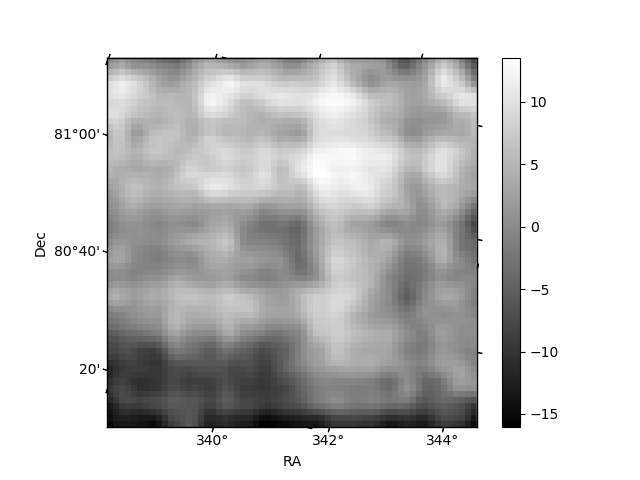
Histogram calculated using DETX and DETY for each event in the final _common_clean file
| Quadrant A | 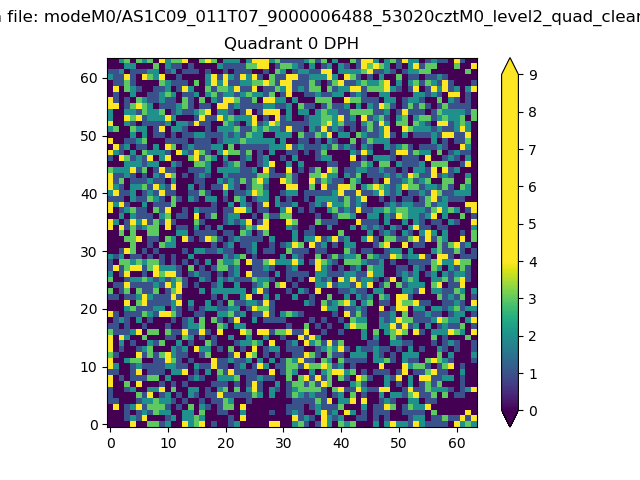 |
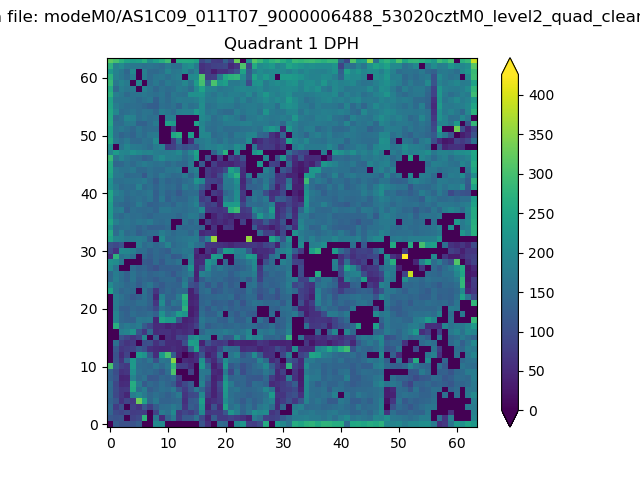 |
Quadrant B |
|---|---|---|---|
| Quadrant D | 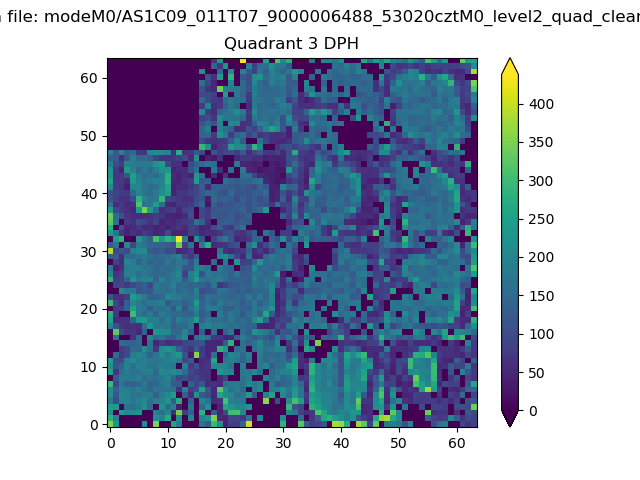 |
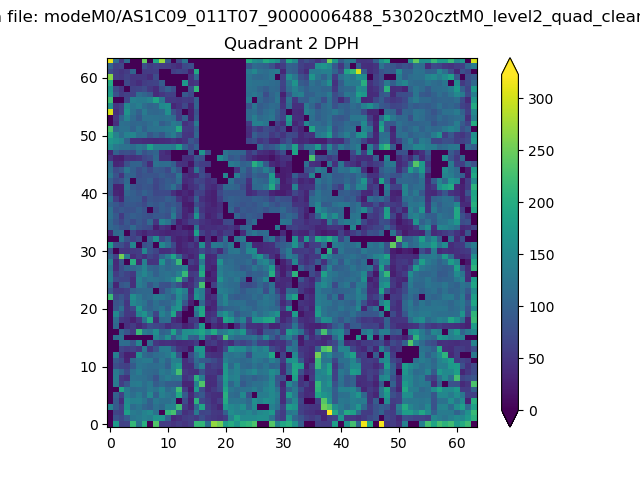 |
Quadrant C |
| Plot type | Count rate plots | Images |
|---|---|---|
| Comparison with Poisson distribution Blue bars denote a histogram of data divided into 1 sec bins. Red curve is a Poisson curve with rate = median count rate of data. |
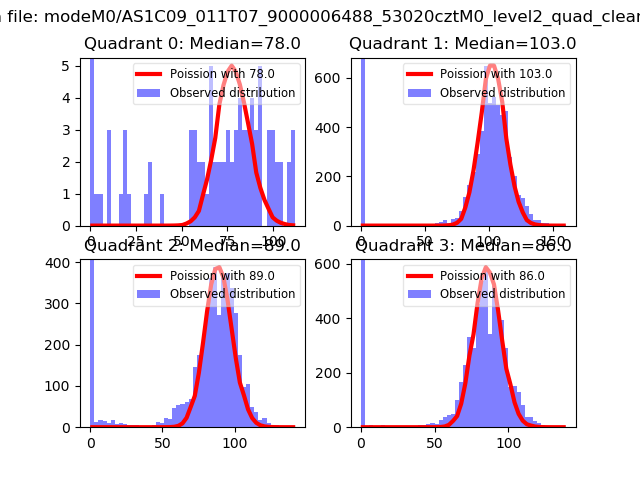 |
 |
| Quadrant-wise count rates Data is divided into 100 sec bins |
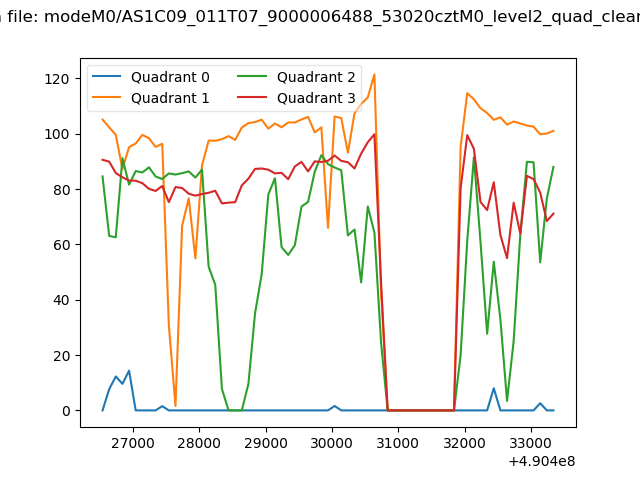 |
|
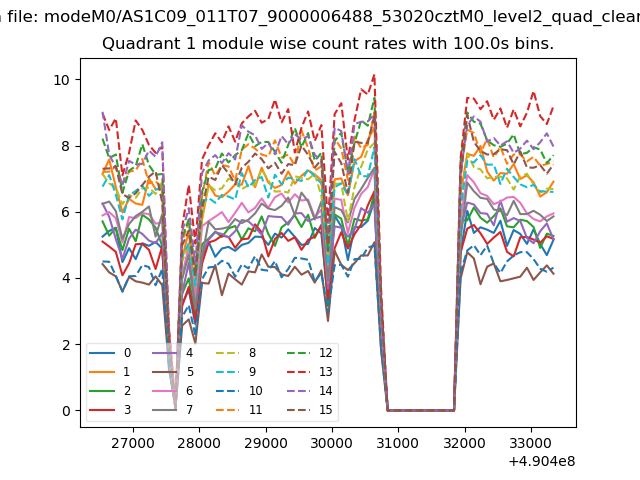
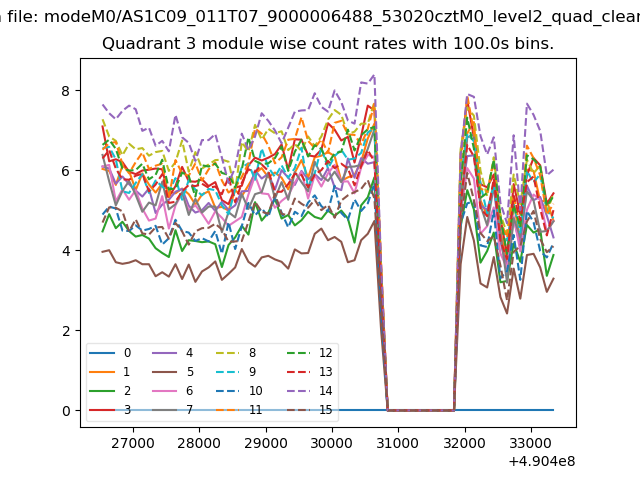
| Module-wise count rates for Quadrant A Data is divided into 100 sec bins |
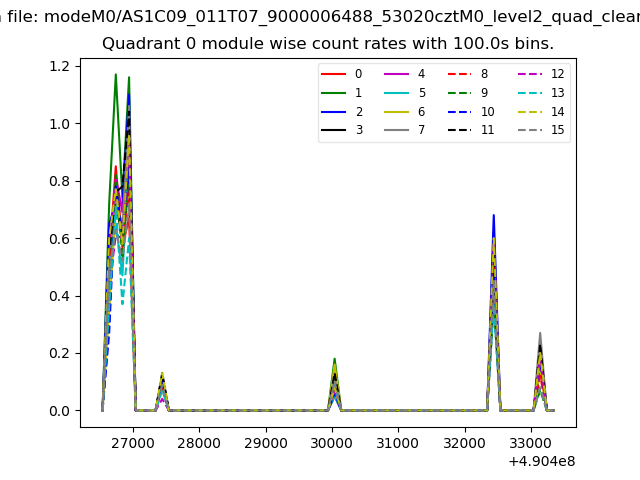 |
 |
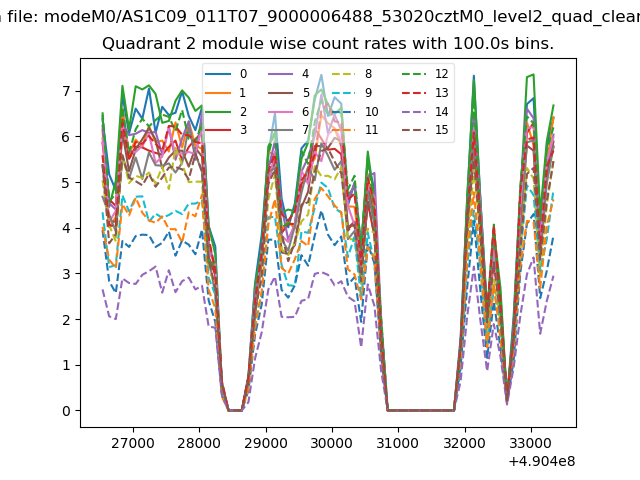
| Module-wise count rates for Quadrant B Data is divided into 100 sec bins |
 |
 |
| Module-wise count rates for Quadrant C Data is divided into 100 sec bins |
 |
 |
| Module-wise count rates for Quadrant D Data is divided into 100 sec bins |
 |
 |
| Parameter | Plot |
|---|---|
| CZT HV Monitor | 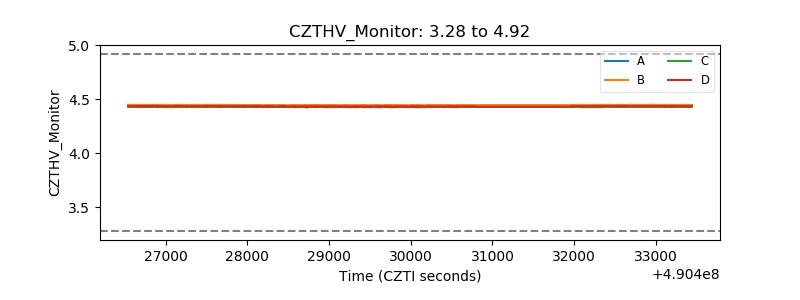 |
| D_VDD | 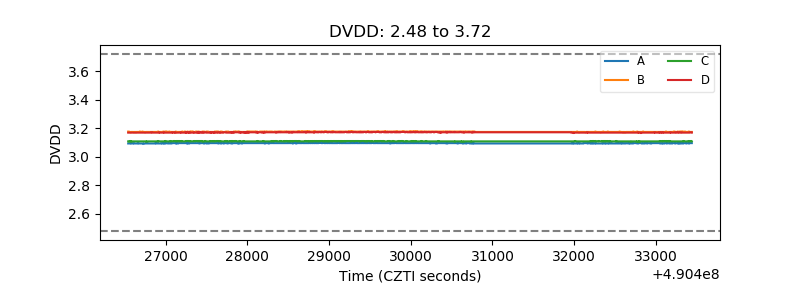 |
| Temperature 1 | 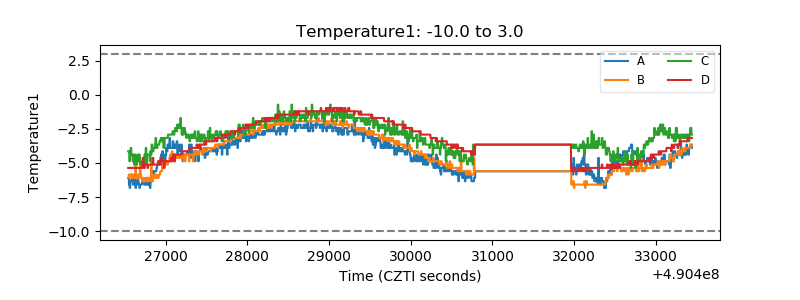 |
| Veto HV Monitor | 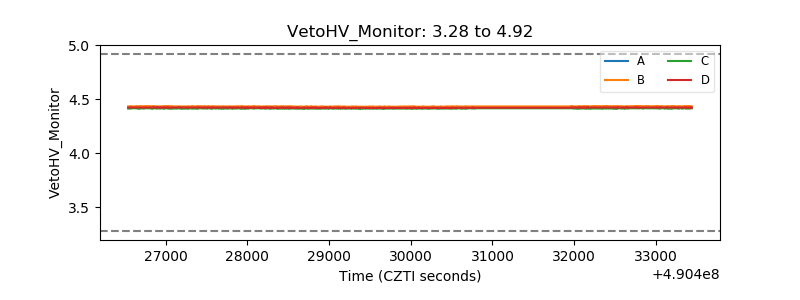 |
| Veto LLD | 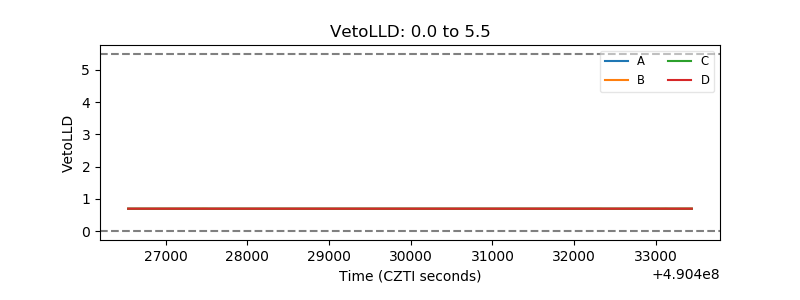 |
| Alpha Counter |  |
| _CPM_Rate | 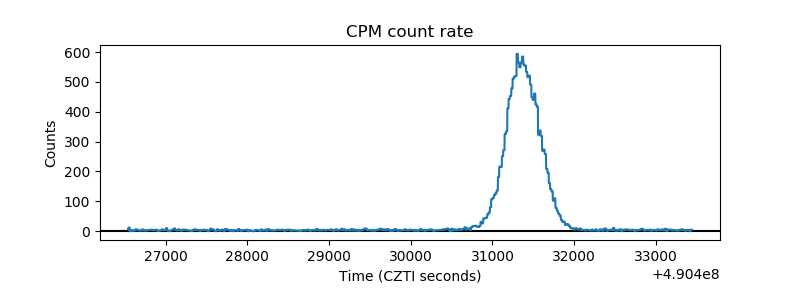 |
| CZT Counter | 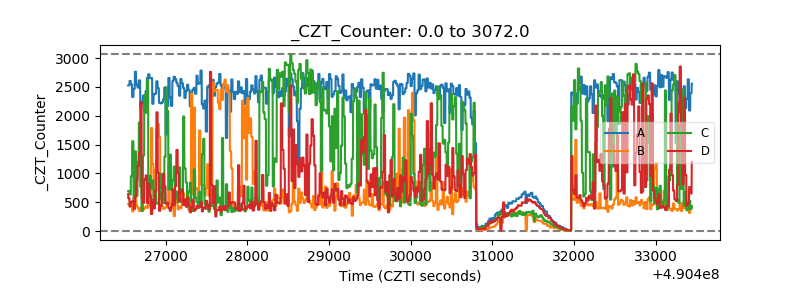 |
| +2.5 Volts monitor |  |
| +5 Volts monitor |  |
| _ROLL_ROT | 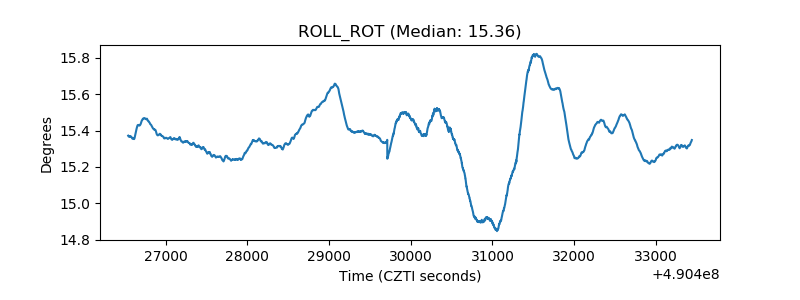 |
| _Roll_DEC | 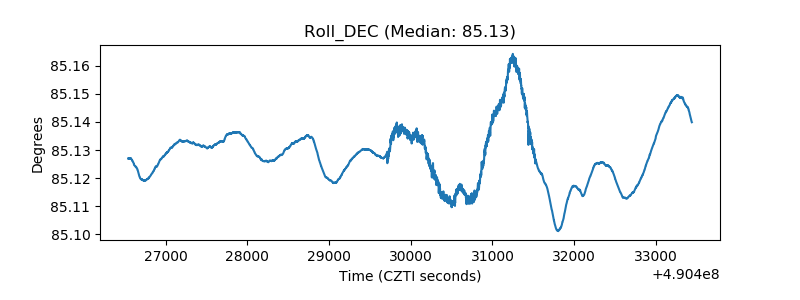 |
| _Roll_RA | 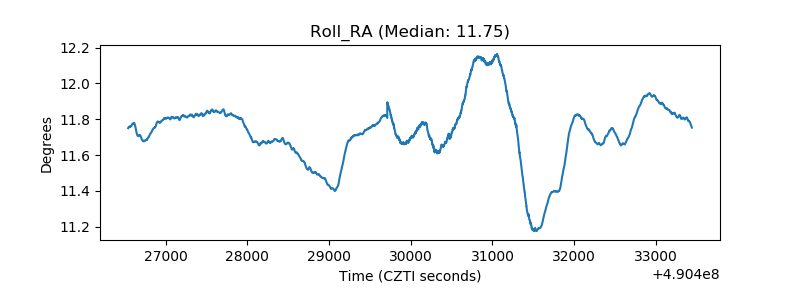 |
| Veto Counter | 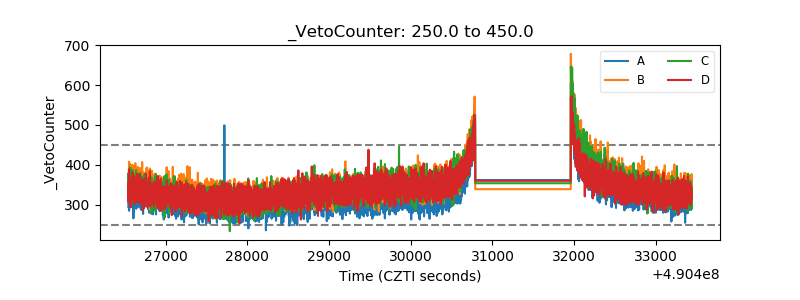 |