| Param | Original file | Final file |
|---|---|---|
| Filename | modeM0/AS1C09_011T07_9000006488_53021cztM0_level2.fits | modeM0/AS1C09_011T07_9000006488_53021cztM0_level2_quad_clean.evt |
| Size (bytes) | 1,095,471,360 | 55,218,240 |
| Size | 1.0 GB | 52.7 MB |
| Events in quadrant A | 14,841,786 | 21,798 |
| Events in quadrant B | 3,369,245 | 609,245 |
| Events in quadrant C | 13,099,058 | 201,151 |
| Events in quadrant D | 8,765,026 | 409,276 |
| Mode SS | |||
|---|---|---|---|
| Quadrant | BADHDUFLAG | Total packets | Discarded packets |
| A | 0 | 124 | 0 |
| B | 0 | 124 | 0 |
| C | 0 | 124 | 0 |
| D | 0 | 124 | 0 |
| Mode M9 | |||
|---|---|---|---|
| Quadrant | BADHDUFLAG | Total packets | Discarded packets |
| A | 0 | 11 | 0 |
| B | 0 | 11 | 0 |
| C | 0 | 11 | 0 |
| D | 0 | 11 | 0 |
| Mode M0 | |||
|---|---|---|---|
| Quadrant | BADHDUFLAG | Total packets | Discarded packets |
| A | 0 | 48162 | 1 |
| B | 0 | 14506 | 1 |
| C | 0 | 43124 | 1 |
| D | 0 | 30323 | 1 |
| Quadrant | Total seconds | Saturated seconds | Saturation percentage |
|---|---|---|---|
| A | 6166 | 6000 | 97.307817% |
| B | 6166 | 279 | 4.524813% |
| C | 6167 | 4224 | 68.493595% |
| D | 6166 | 1681 | 27.262407% |
Noise dominated data is calculated using 1-second bins in cleaned event files. If a bin has >2000 counts, and if more than 50% of those come from <1% of pixels, then it is considered to be noise-dominated and hence unusable.
| Quadrant | # 1 sec bins | Bins with >0 counts | Bins with >2000 counts | High rate bins dominated by noise | Noise dominated (total time) | Noise dominated (detector-on time) | Marked lightcurve |
|---|---|---|---|---|---|---|---|
| A | 7245 | 6165 | 5686 | 5686 | 78.48% | 92.23% | 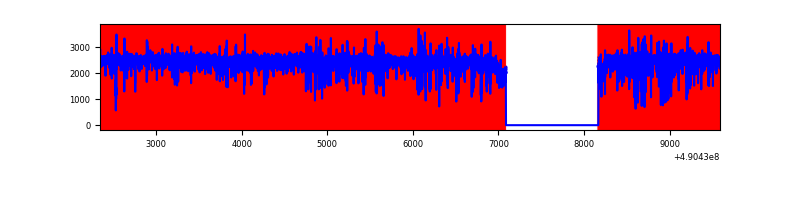 |
| B | 7246 | 6166 | 148 | 148 | 2.04% | 2.40% | 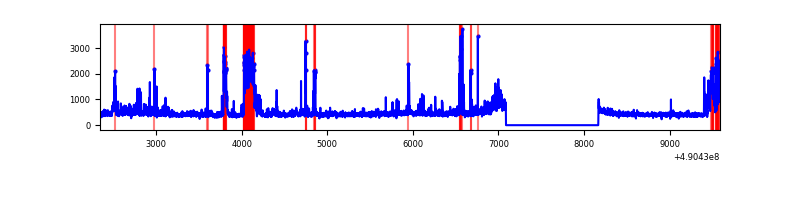 |
| C | 7246 | 6166 | 4026 | 4026 | 55.56% | 65.29% | 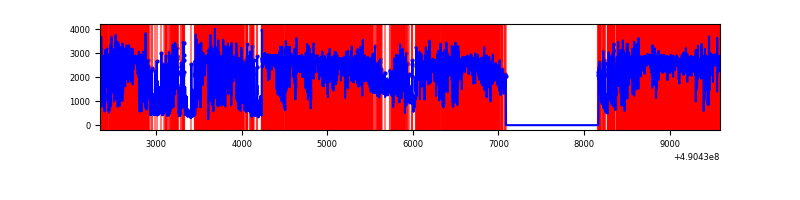 |
| D | 7246 | 6166 | 1578 | 1578 | 21.78% | 25.59% | 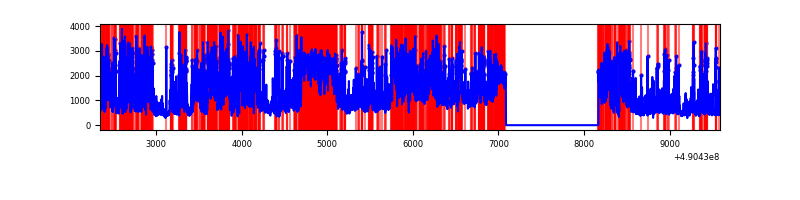 |
Top three noisy pixels from each quadrant. If the there are fewer than three noisy pixels in the level2.evt file, extra rows are filled as -1
| Pixel properties | Quadrant properties | ||||||
|---|---|---|---|---|---|---|---|
| Quadrant | DetID | PixID | Counts | Sigma | Mean | Median | Sigma |
| A | 9 | 191 | 12840365 | 201295.39 | 249 | 244 | 63.8 |
| A | 7 | 206 | 741847 | 11626.16 | 249 | 244 | 63.8 |
| A | 0 | 8 | 61922 | 966.93 | 249 | 244 | 63.8 |
| B | 10 | 44 | 594267 | 4431.9 | 627 | 606 | 134.0 |
| B | 4 | 81 | 53506 | 394.92 | 627 | 606 | 134.0 |
| B | 7 | 252 | 50239 | 370.53 | 627 | 606 | 134.0 |
| C | 1 | 241 | 8184216 | 69278.59 | 426 | 420 | 118.1 |
| C | 15 | 224 | 2299397 | 19461.62 | 426 | 420 | 118.1 |
| C | 9 | 38 | 400409 | 3386.04 | 426 | 420 | 118.1 |
| D | 12 | 17 | 3269786 | 20974.05 | 543 | 517 | 155.9 |
| D | 2 | 62 | 1524688 | 9778.35 | 543 | 517 | 155.9 |
| D | 15 | 78 | 687687 | 4408.55 | 543 | 517 | 155.9 |
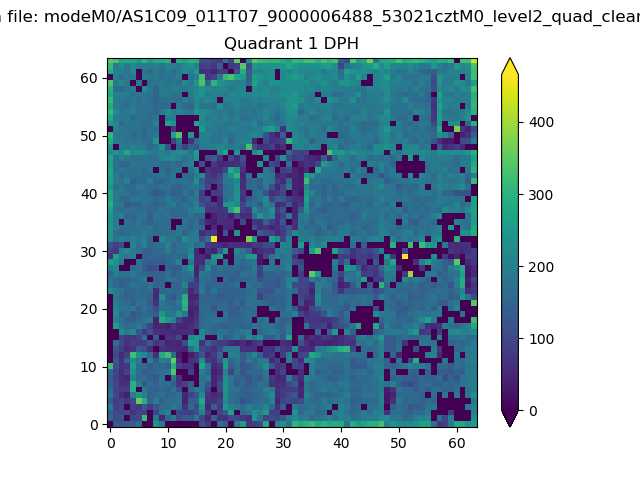
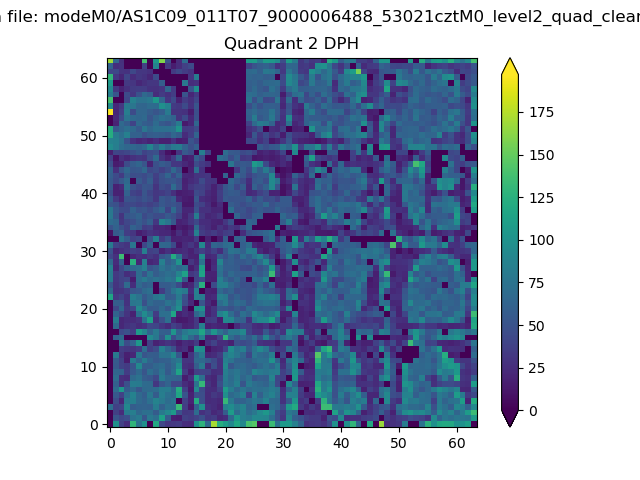
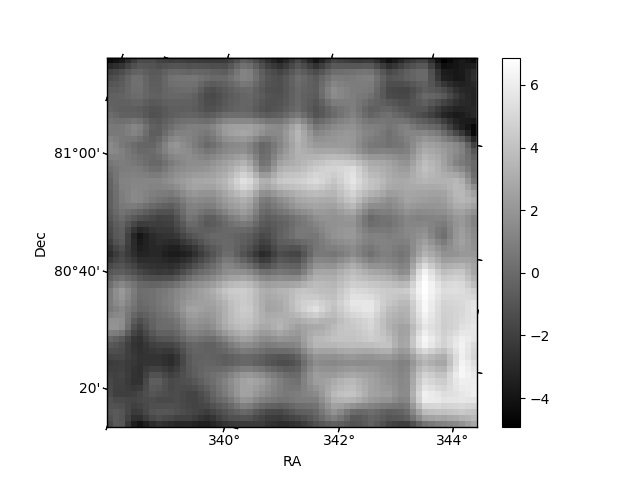
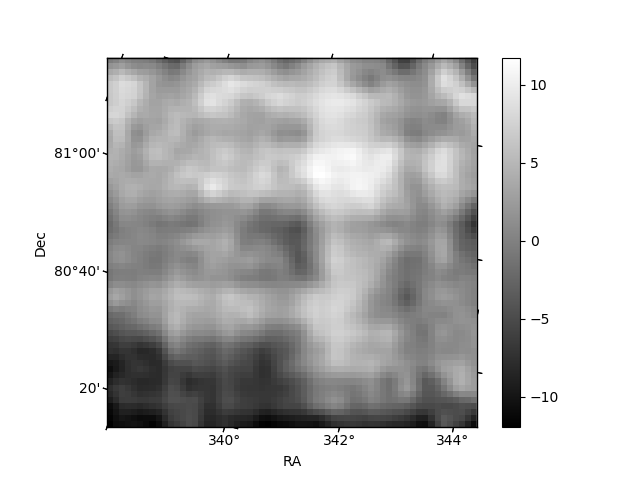
Histogram calculated using DETX and DETY for each event in the final _common_clean file
| Quadrant A |  |
 |
Quadrant B |
|---|---|---|---|
| Quadrant D |  |
 |
Quadrant C |
| Plot type | Count rate plots | Images |
|---|---|---|
| Comparison with Poisson distribution Blue bars denote a histogram of data divided into 1 sec bins. Red curve is a Poisson curve with rate = median count rate of data. |
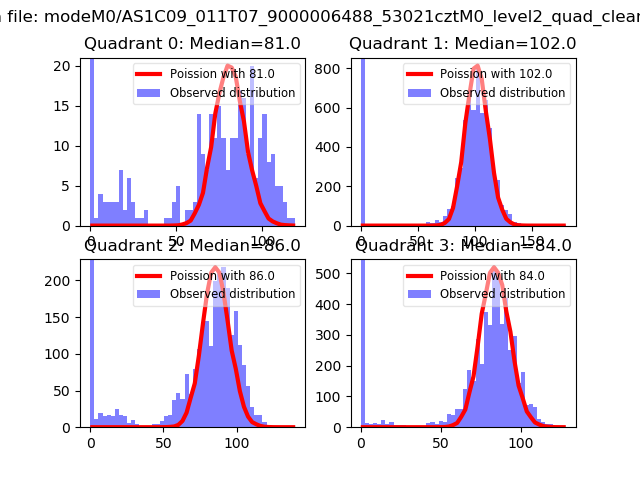 |
 |
| Quadrant-wise count rates Data is divided into 100 sec bins |
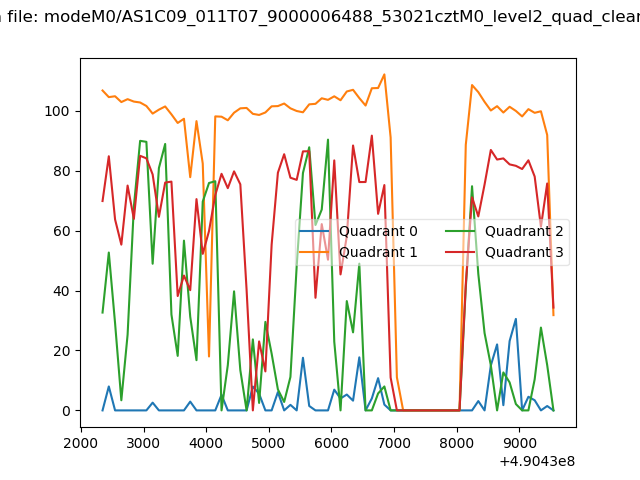 |
|
| Module-wise count rates for Quadrant A Data is divided into 100 sec bins |
 |
 |
| Module-wise count rates for Quadrant B Data is divided into 100 sec bins |
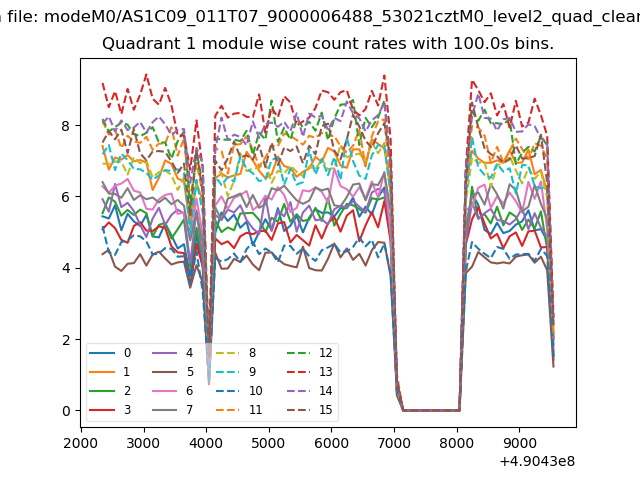 |
 |
| Module-wise count rates for Quadrant C Data is divided into 100 sec bins |
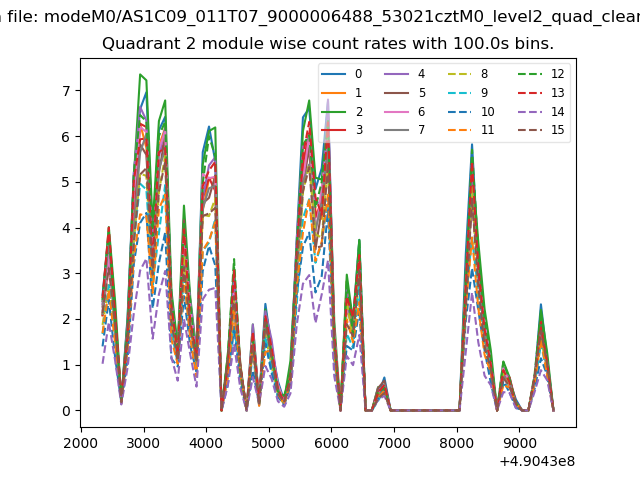 |
 |
| Module-wise count rates for Quadrant D Data is divided into 100 sec bins |
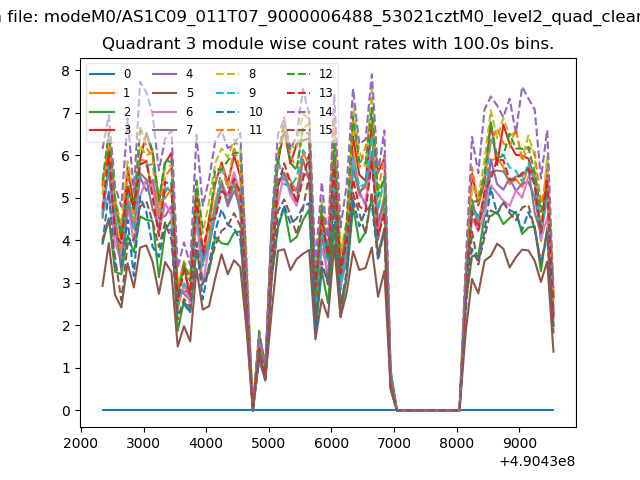 |
 |
| Parameter | Plot |
|---|---|
| CZT HV Monitor | 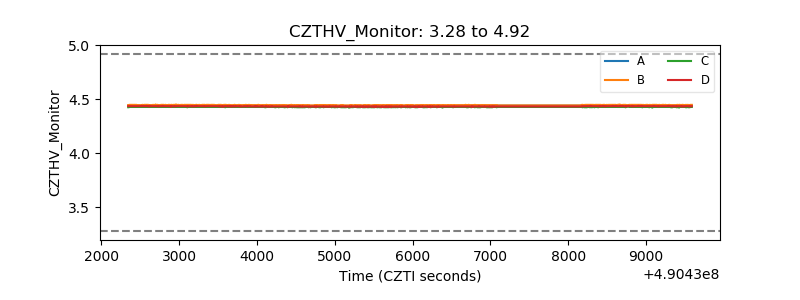 |
| D_VDD | 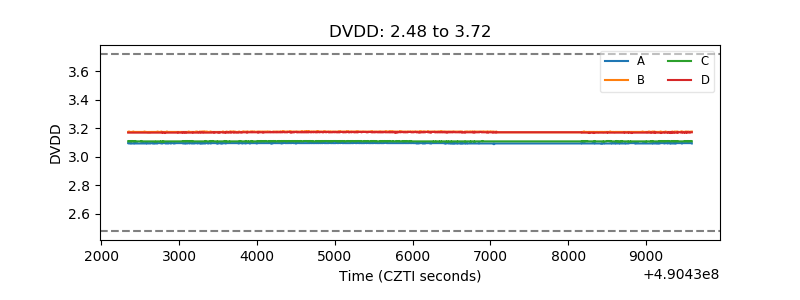 |
| Temperature 1 | 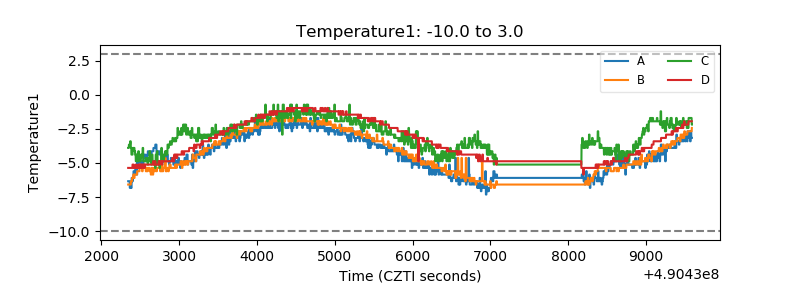 |
| Veto HV Monitor | 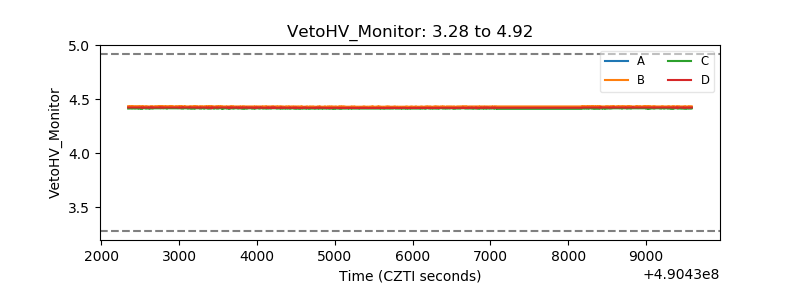 |
| Veto LLD | 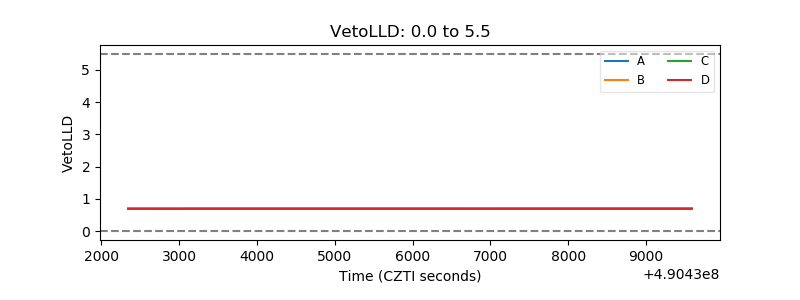 |
| Alpha Counter | 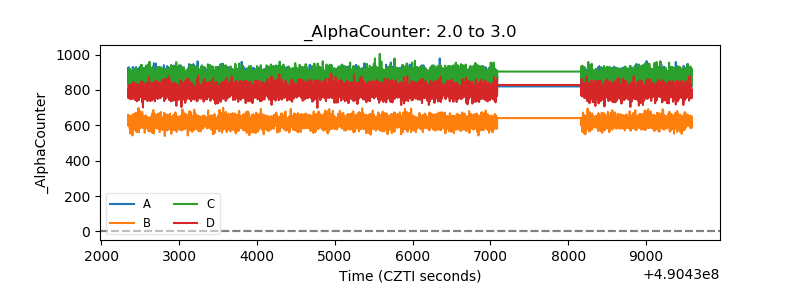 |
| _CPM_Rate | 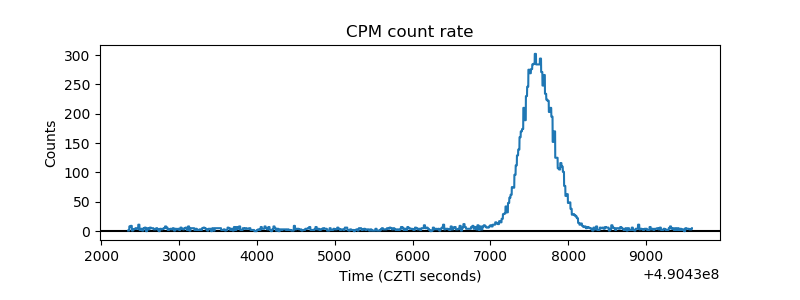 |
| CZT Counter | 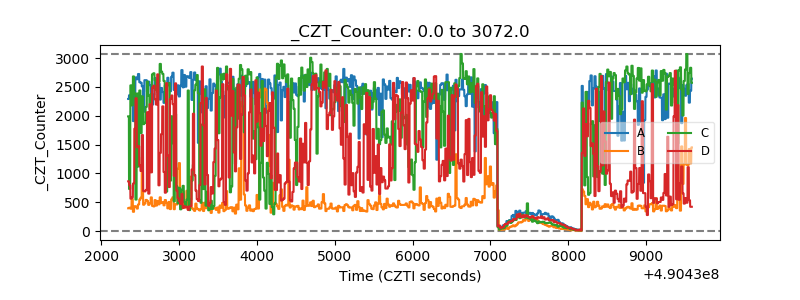 |
| +2.5 Volts monitor | 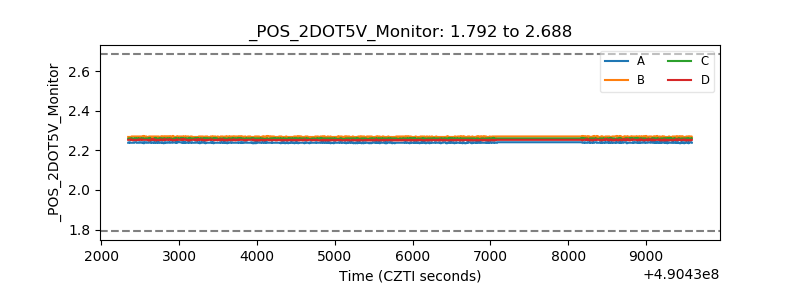 |
| +5 Volts monitor | 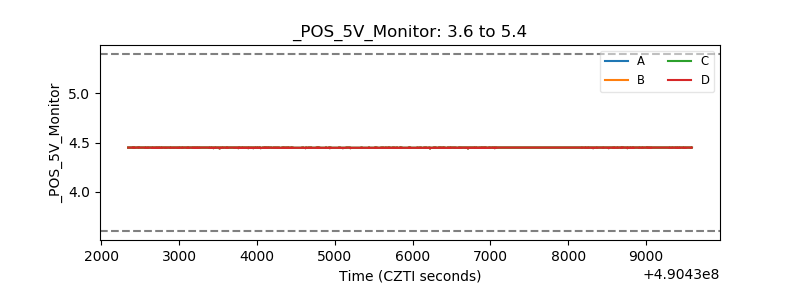 |
| _ROLL_ROT | 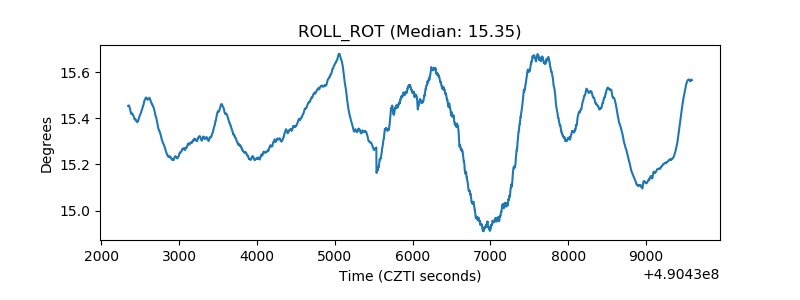 |
| _Roll_DEC | 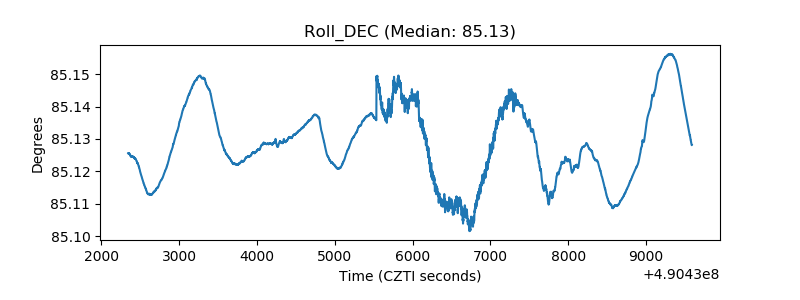 |
| _Roll_RA | 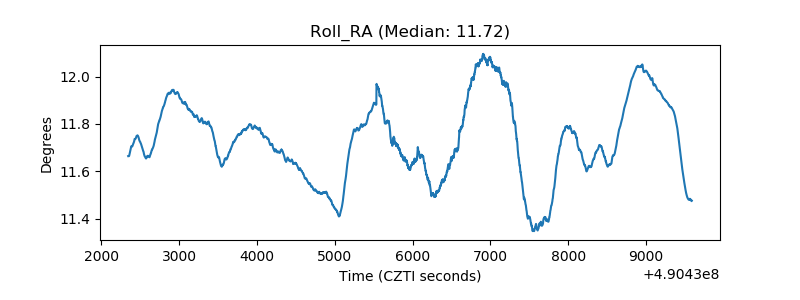 |
| Veto Counter | 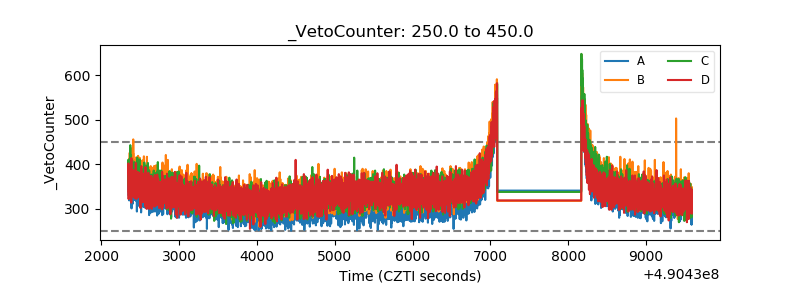 |