| Param | Original file | Final file |
|---|---|---|
| Filename | modeM0/AS1C09_011T07_9000006488_53022cztM0_level2.fits | modeM0/AS1C09_011T07_9000006488_53022cztM0_level2_quad_clean.evt |
| Size (bytes) | 1,061,087,040 | 62,202,240 |
| Size | 1011.9 MB | 59.3 MB |
| Events in quadrant A | 15,666,835 | 22,863 |
| Events in quadrant B | 4,363,068 | 605,401 |
| Events in quadrant C | 11,511,966 | 319,146 |
| Events in quadrant D | 7,235,460 | 483,874 |
| Mode SS | |||
|---|---|---|---|
| Quadrant | BADHDUFLAG | Total packets | Discarded packets |
| A | 0 | 130 | 0 |
| B | 0 | 130 | 0 |
| C | 0 | 130 | 0 |
| D | 0 | 130 | 0 |
| Mode M9 | |||
|---|---|---|---|
| Quadrant | BADHDUFLAG | Total packets | Discarded packets |
| A | 0 | 9 | 0 |
| B | 0 | 9 | 0 |
| C | 0 | 9 | 0 |
| D | 0 | 9 | 0 |
| Mode M0 | |||
|---|---|---|---|
| Quadrant | BADHDUFLAG | Total packets | Discarded packets |
| A | 0 | 50819 | 43 |
| B | 0 | 17800 | 5 |
| C | 0 | 38694 | 17 |
| D | 0 | 26005 | 9 |
| Quadrant | Total seconds | Saturated seconds | Saturation percentage |
|---|---|---|---|
| A | 6480 | 6290 | 97.067901% |
| B | 6484 | 576 | 8.883405% |
| C | 6485 | 3176 | 48.974557% |
| D | 6484 | 1032 | 15.916101% |
Noise dominated data is calculated using 1-second bins in cleaned event files. If a bin has >2000 counts, and if more than 50% of those come from <1% of pixels, then it is considered to be noise-dominated and hence unusable.
| Quadrant | # 1 sec bins | Bins with >0 counts | Bins with >2000 counts | High rate bins dominated by noise | Noise dominated (total time) | Noise dominated (detector-on time) | Marked lightcurve |
|---|---|---|---|---|---|---|---|
| A | 7385 | 6481 | 5983 | 5983 | 81.02% | 92.32% | 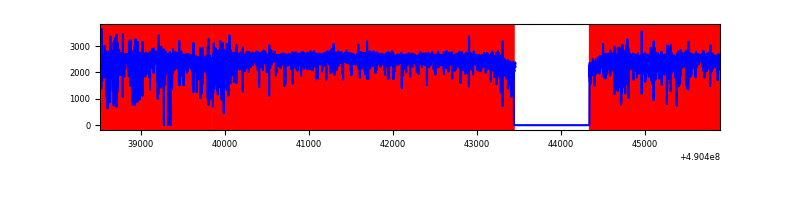 |
| B | 7387 | 6487 | 383 | 383 | 5.18% | 5.90% | 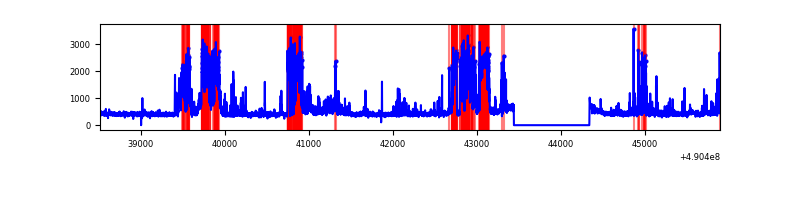 |
| C | 7387 | 6486 | 3042 | 3042 | 41.18% | 46.90% | 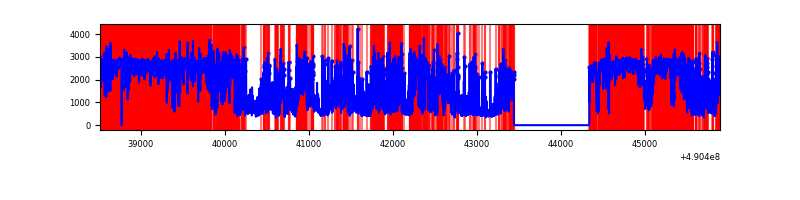 |
| D | 7387 | 6487 | 935 | 935 | 12.66% | 14.41% | 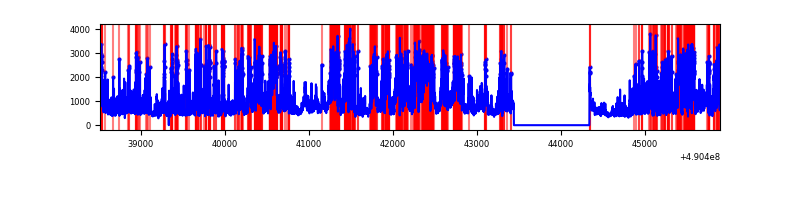 |
Top three noisy pixels from each quadrant. If the there are fewer than three noisy pixels in the level2.evt file, extra rows are filled as -1
| Pixel properties | Quadrant properties | ||||||
|---|---|---|---|---|---|---|---|
| Quadrant | DetID | PixID | Counts | Sigma | Mean | Median | Sigma |
| A | 9 | 191 | 13056711 | 210155.64 | 242 | 237 | 62.1 |
| A | 15 | 190 | 691879 | 11132.6 | 242 | 237 | 62.1 |
| A | 7 | 206 | 674404 | 10851.32 | 242 | 237 | 62.1 |
| B | 10 | 44 | 1433056 | 10394.2 | 639 | 618 | 137.8 |
| B | 4 | 81 | 99921 | 720.57 | 639 | 618 | 137.8 |
| B | 10 | 191 | 88135 | 635.05 | 639 | 618 | 137.8 |
| C | 1 | 241 | 5662052 | 40986.92 | 497 | 491 | 138.1 |
| C | 15 | 224 | 2260340 | 16360.19 | 497 | 491 | 138.1 |
| C | 9 | 38 | 852736 | 6169.83 | 497 | 491 | 138.1 |
| D | 12 | 17 | 2723802 | 15525.53 | 614 | 585 | 175.4 |
| D | 2 | 153 | 461259 | 2626.38 | 614 | 585 | 175.4 |
| D | 15 | 78 | 361285 | 2056.41 | 614 | 585 | 175.4 |
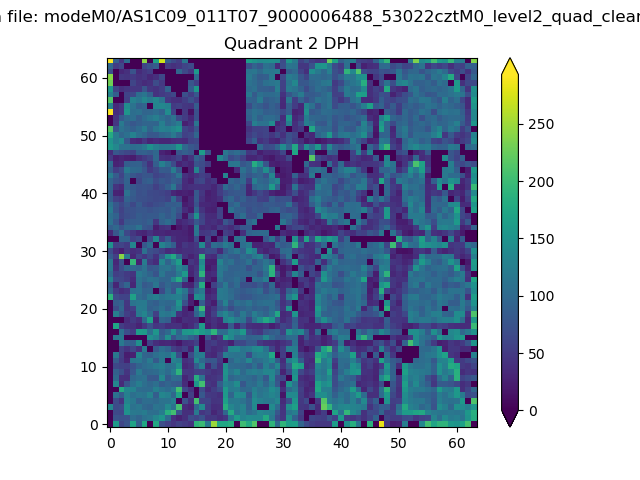
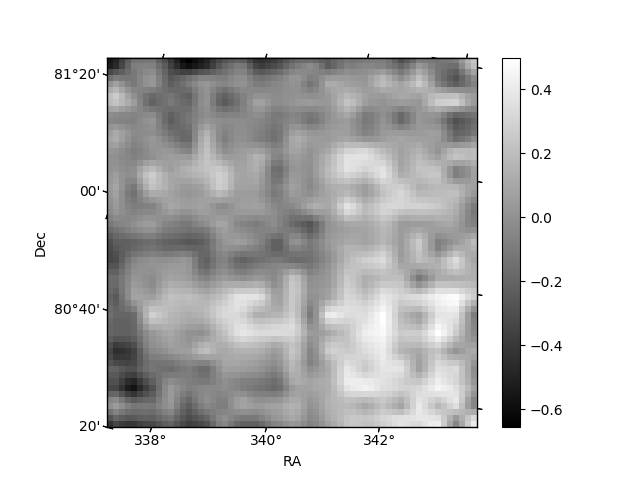
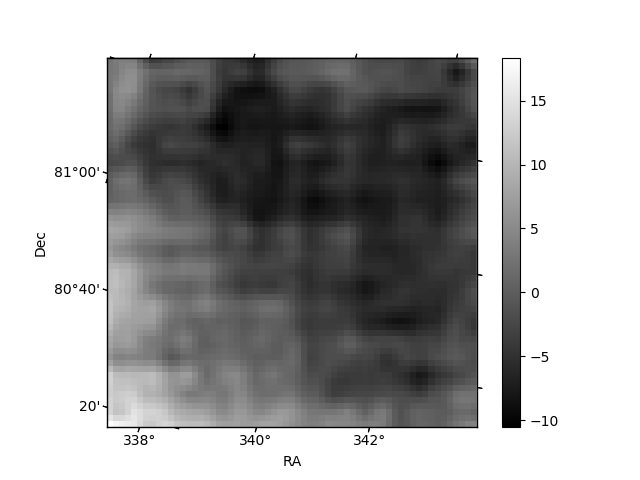
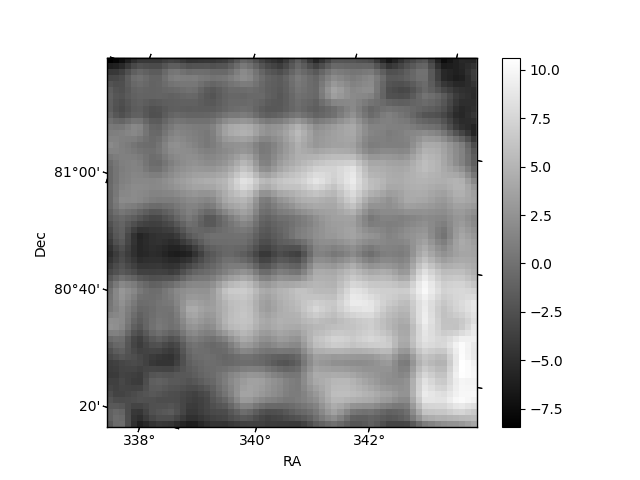
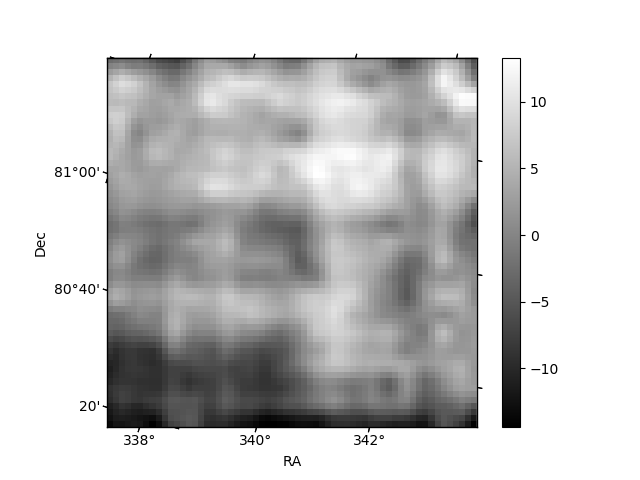
Histogram calculated using DETX and DETY for each event in the final _common_clean file
| Quadrant A | 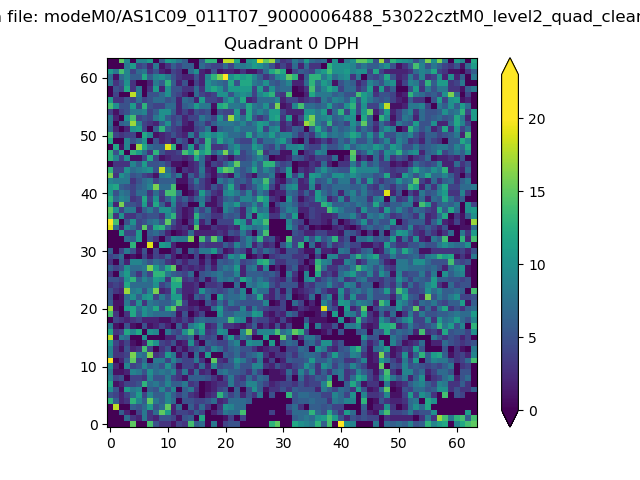 |
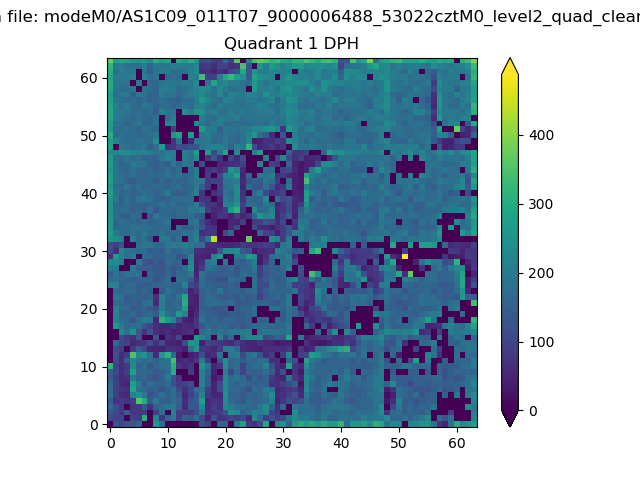 |
Quadrant B |
|---|---|---|---|
| Quadrant D | 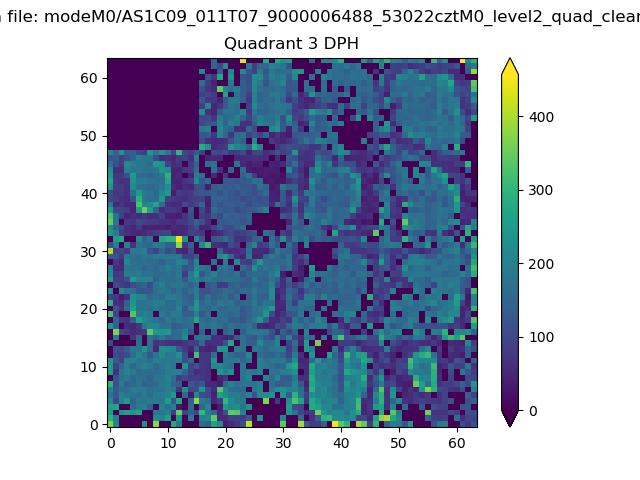 |
 |
Quadrant C |
| Plot type | Count rate plots | Images |
|---|---|---|
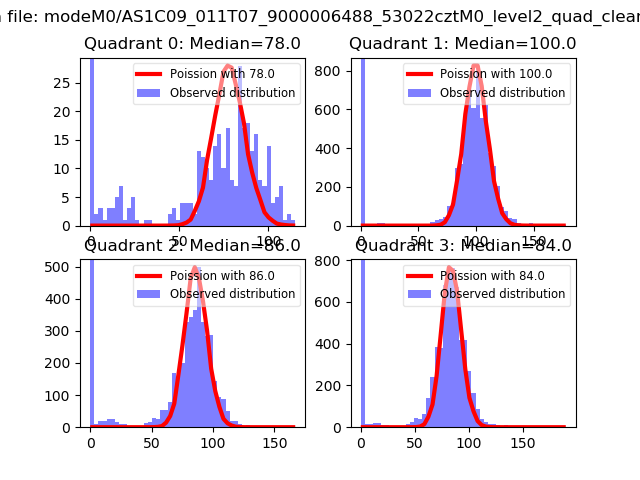
| Comparison with Poisson distribution Blue bars denote a histogram of data divided into 1 sec bins. Red curve is a Poisson curve with rate = median count rate of data. |
 |
 |
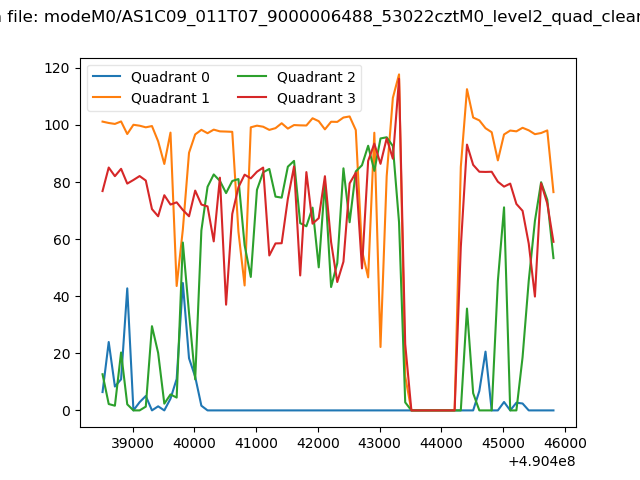
| Quadrant-wise count rates Data is divided into 100 sec bins |
 |
|
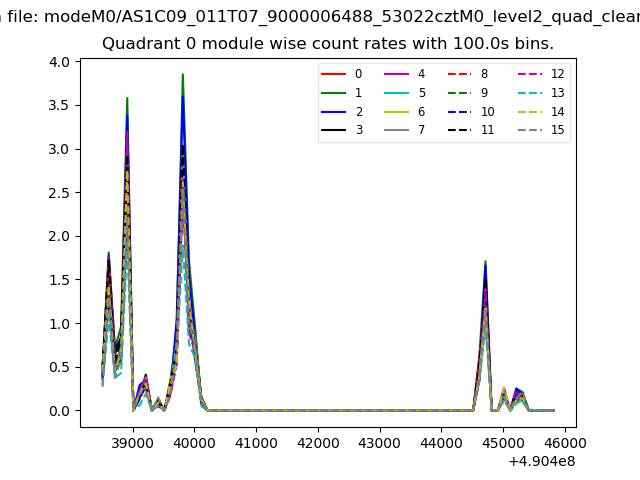
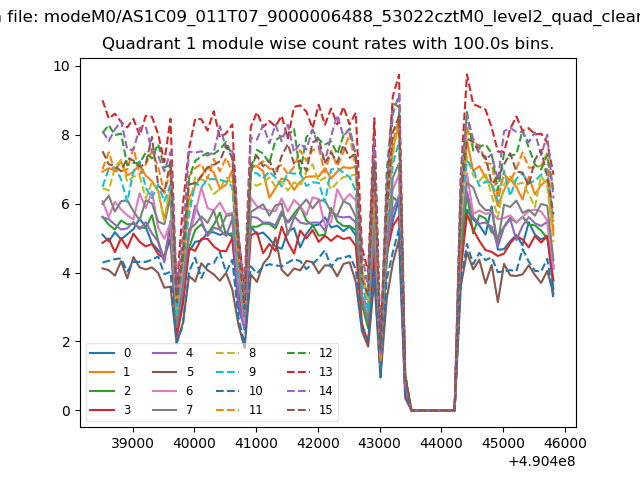
| Module-wise count rates for Quadrant A Data is divided into 100 sec bins |
 |
 |
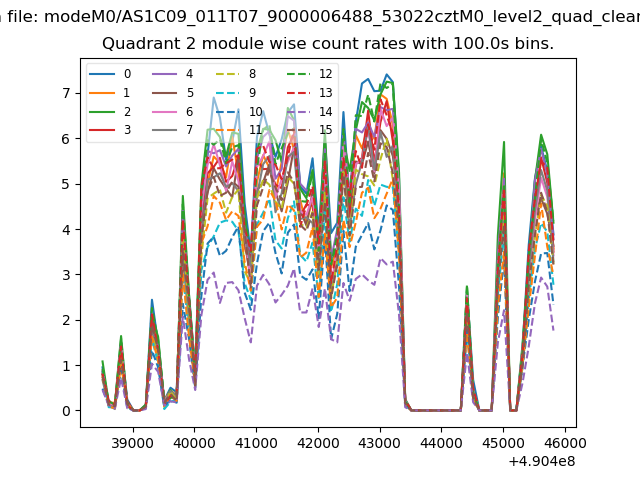
| Module-wise count rates for Quadrant B Data is divided into 100 sec bins |
 |
 |
| Module-wise count rates for Quadrant C Data is divided into 100 sec bins |
 |
 |
| Module-wise count rates for Quadrant D Data is divided into 100 sec bins |
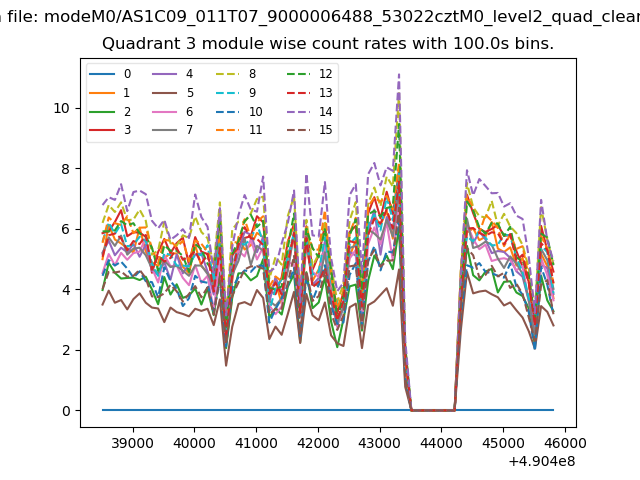 |
 |
| Parameter | Plot |
|---|---|
| CZT HV Monitor | 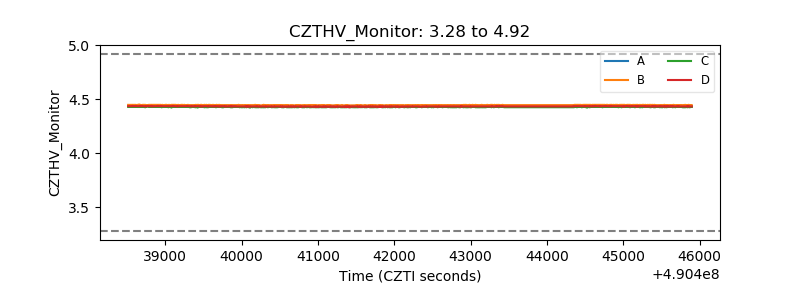 |
| D_VDD | 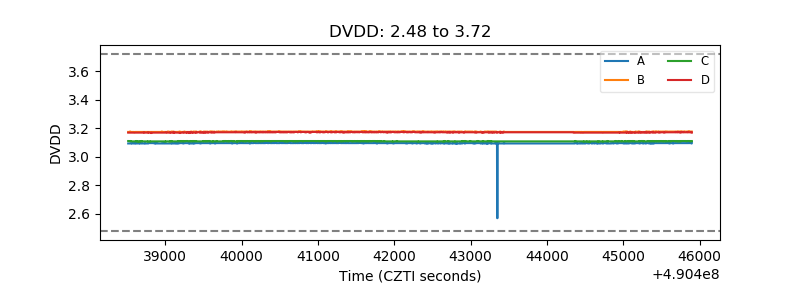 |
| Temperature 1 | 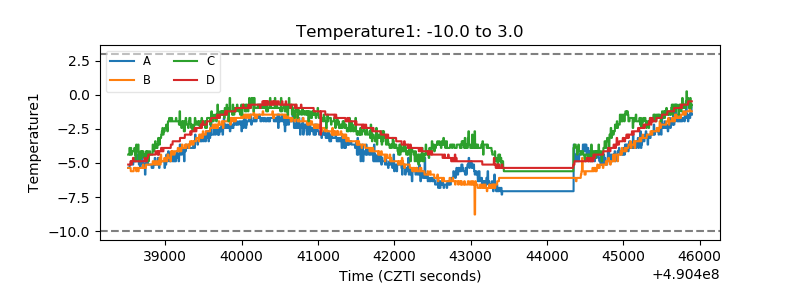 |
| Veto HV Monitor | 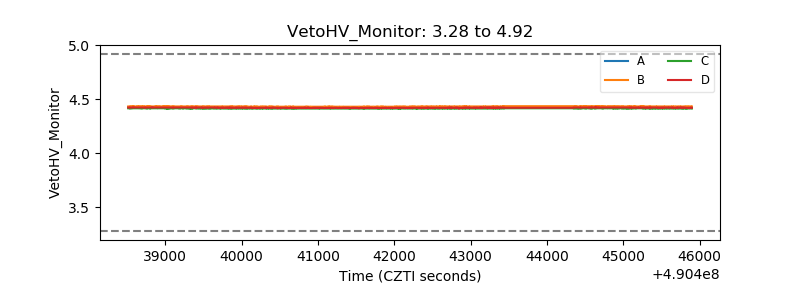 |
| Veto LLD | 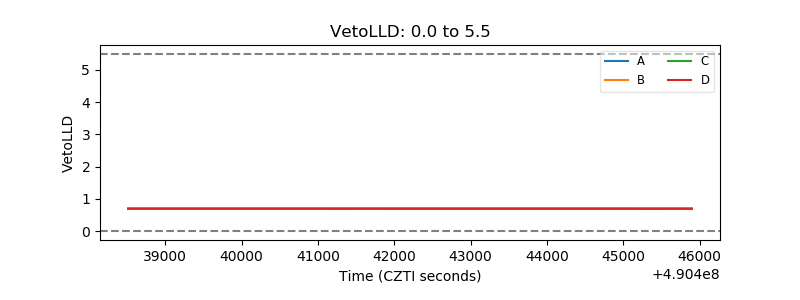 |
| Alpha Counter | 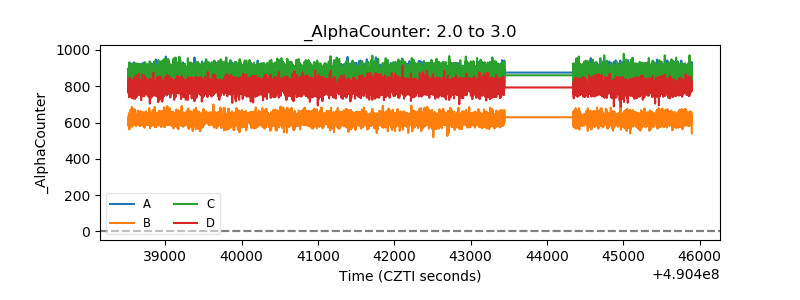 |
| _CPM_Rate | 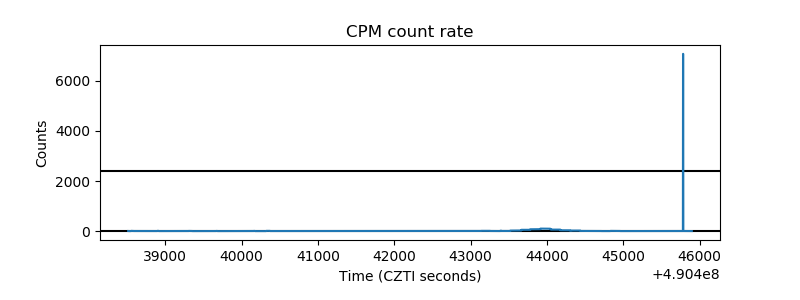 |
| CZT Counter | 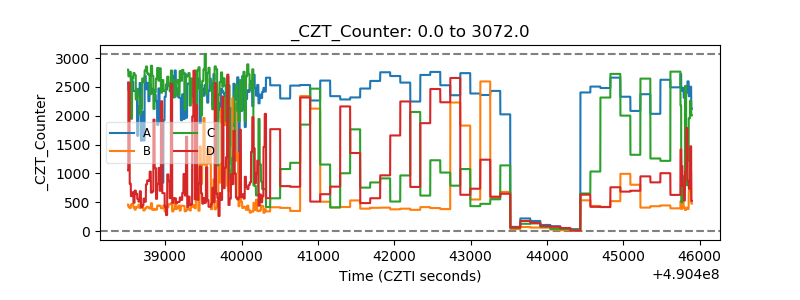 |
| +2.5 Volts monitor | 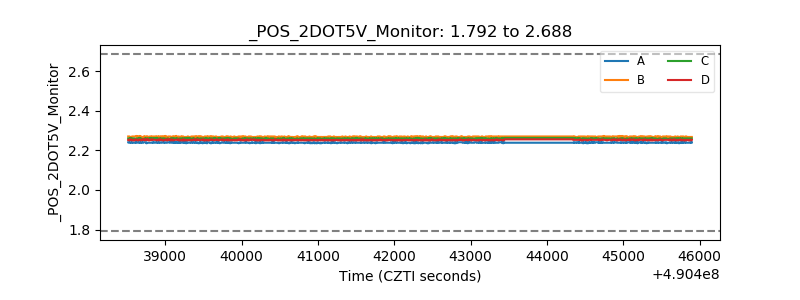 |
| +5 Volts monitor | 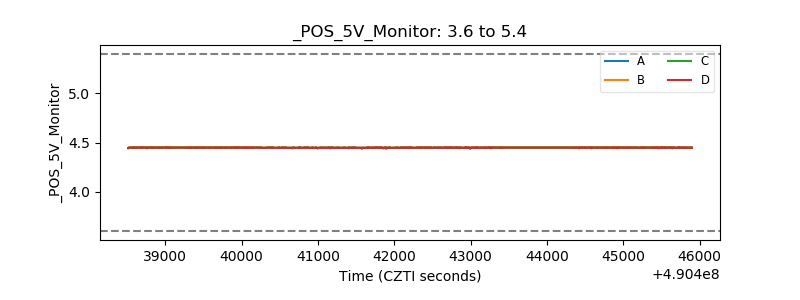 |
| _ROLL_ROT | 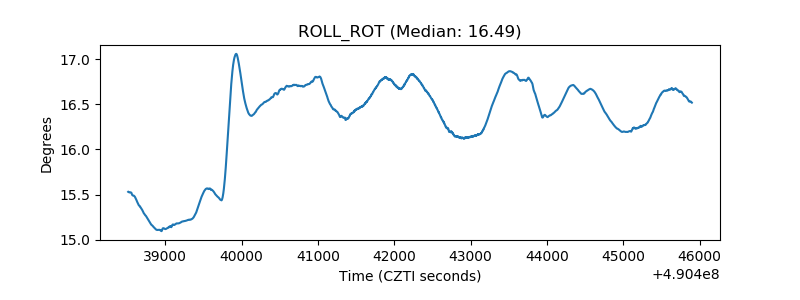 |
| _Roll_DEC | 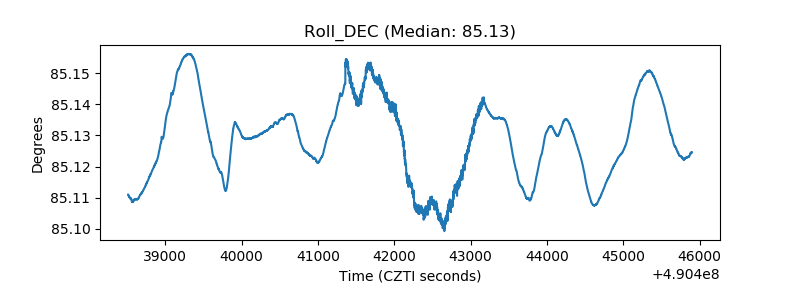 |
| _Roll_RA | 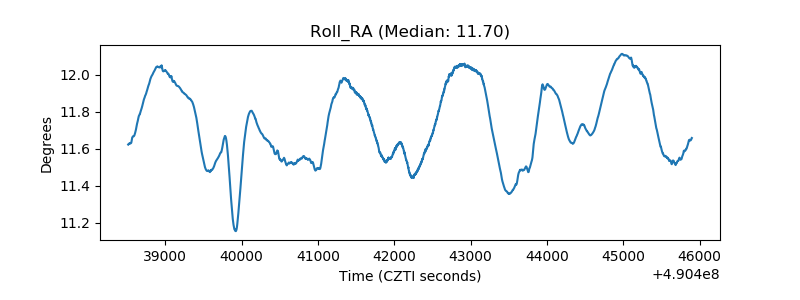 |
| Veto Counter | 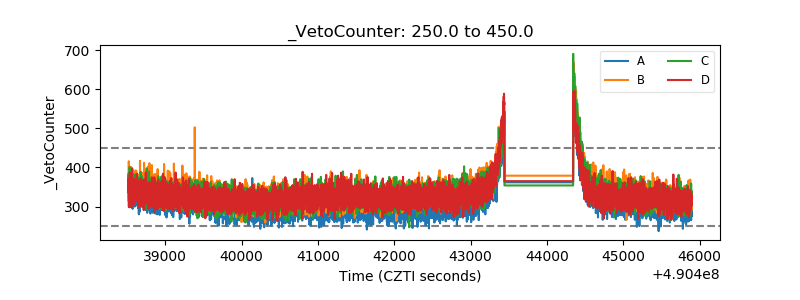 |