| Param | Original file | Final file |
|---|---|---|
| Filename | modeM0/AS1C09_011T07_9000006488_53023cztM0_level2.fits | modeM0/AS1C09_011T07_9000006488_53023cztM0_level2_quad_clean.evt |
| Size (bytes) | 1,250,017,920 | 68,535,360 |
| Size | 1.2 GB | 65.4 MB |
| Events in quadrant A | 16,510,505 | 3,314 |
| Events in quadrant B | 5,625,391 | 698,329 |
| Events in quadrant C | 13,442,403 | 349,793 |
| Events in quadrant D | 10,153,974 | 535,860 |
| Mode SS | |||
|---|---|---|---|
| Quadrant | BADHDUFLAG | Total packets | Discarded packets |
| A | 0 | 142 | 0 |
| B | 0 | 142 | 0 |
| C | 0 | 142 | 0 |
| D | 0 | 142 | 0 |
| Mode M9 | |||
|---|---|---|---|
| Quadrant | BADHDUFLAG | Total packets | Discarded packets |
| A | 0 | 4 | 0 |
| B | 0 | 4 | 0 |
| C | 0 | 4 | 0 |
| D | 0 | 4 | 0 |
| Mode M0 | |||
|---|---|---|---|
| Quadrant | BADHDUFLAG | Total packets | Discarded packets |
| A | 0 | 53751 | 6 |
| B | 0 | 21684 | 1 |
| C | 0 | 44739 | 1 |
| D | 0 | 34982 | 1 |
| Quadrant | Total seconds | Saturated seconds | Saturation percentage |
|---|---|---|---|
| A | 6997 | 6974 | 99.671288% |
| B | 6997 | 848 | 12.119480% |
| C | 6999 | 3999 | 57.136734% |
| D | 6999 | 2279 | 32.561795% |
Noise dominated data is calculated using 1-second bins in cleaned event files. If a bin has >2000 counts, and if more than 50% of those come from <1% of pixels, then it is considered to be noise-dominated and hence unusable.
| Quadrant | # 1 sec bins | Bins with >0 counts | Bins with >2000 counts | High rate bins dominated by noise | Noise dominated (total time) | Noise dominated (detector-on time) | Marked lightcurve |
|---|---|---|---|---|---|---|---|
| A | 7427 | 6996 | 6390 | 6390 | 86.04% | 91.34% | 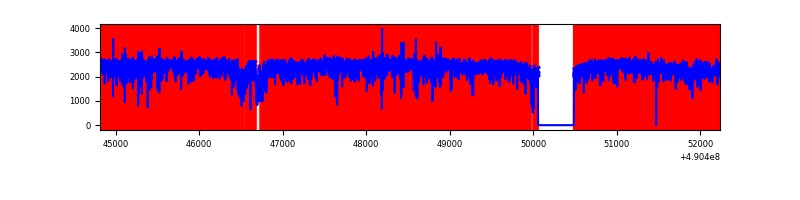 |
| B | 7428 | 6999 | 506 | 506 | 6.81% | 7.23% | 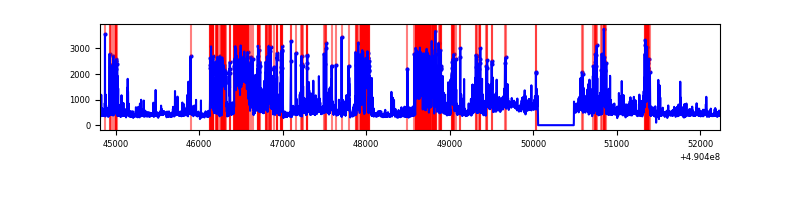 |
| C | 7429 | 6999 | 3686 | 3686 | 49.62% | 52.66% | 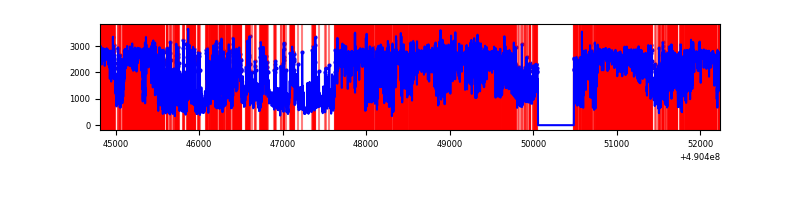 |
| D | 7428 | 6998 | 2021 | 2021 | 27.21% | 28.88% | 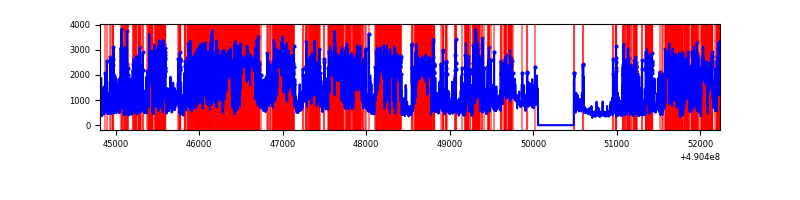 |
Top three noisy pixels from each quadrant. If the there are fewer than three noisy pixels in the level2.evt file, extra rows are filled as -1
| Pixel properties | Quadrant properties | ||||||
|---|---|---|---|---|---|---|---|
| Quadrant | DetID | PixID | Counts | Sigma | Mean | Median | Sigma |
| A | 9 | 191 | 14024764 | 280716.34 | 185 | 181 | 50.0 |
| A | 7 | 206 | 1220315 | 24422.23 | 185 | 181 | 50.0 |
| A | 15 | 190 | 355356 | 7109.19 | 185 | 181 | 50.0 |
| B | 10 | 44 | 1745427 | 11483.48 | 714 | 692 | 151.9 |
| B | 10 | 191 | 279120 | 1832.56 | 714 | 692 | 151.9 |
| B | 2 | 249 | 274224 | 1800.33 | 714 | 692 | 151.9 |
| C | 1 | 241 | 6476722 | 40122.08 | 566 | 558 | 161.4 |
| C | 15 | 224 | 2343684 | 14516.48 | 566 | 558 | 161.4 |
| C | 9 | 38 | 1464456 | 9069.35 | 566 | 558 | 161.4 |
| D | 12 | 17 | 5702184 | 29210.65 | 660 | 630 | 195.2 |
| D | 15 | 78 | 387549 | 1982.29 | 660 | 630 | 195.2 |
| D | 8 | 176 | 336393 | 1720.21 | 660 | 630 | 195.2 |
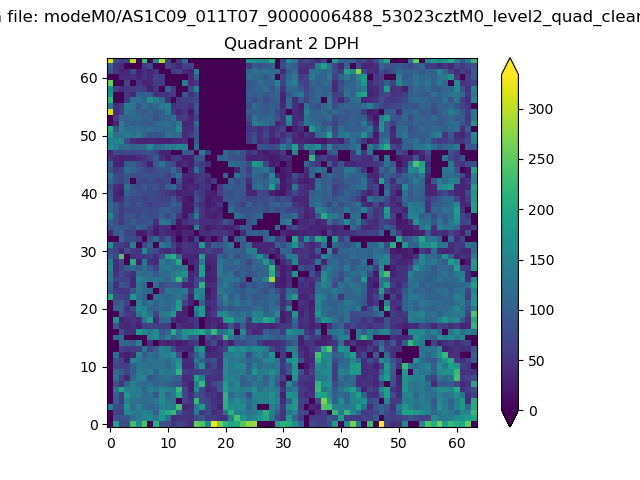
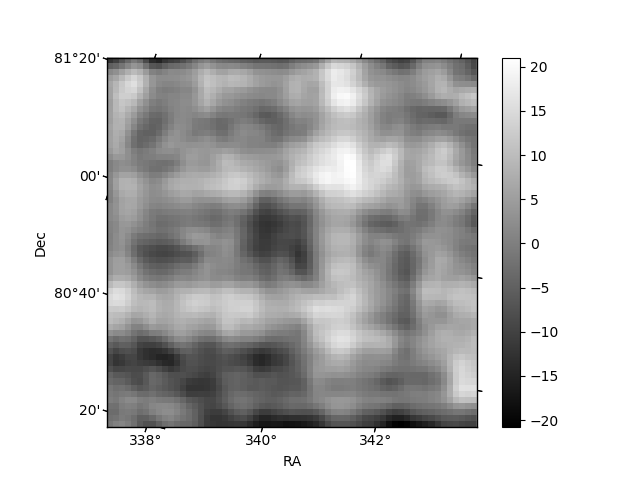
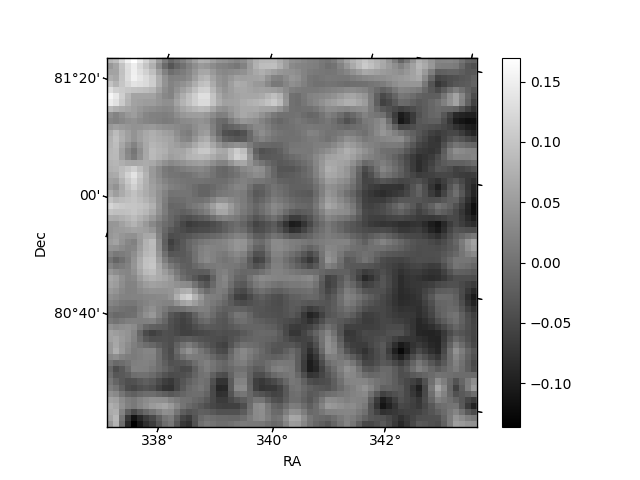
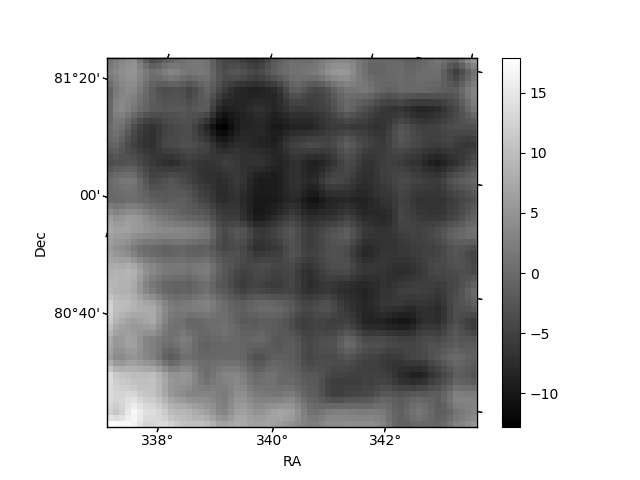
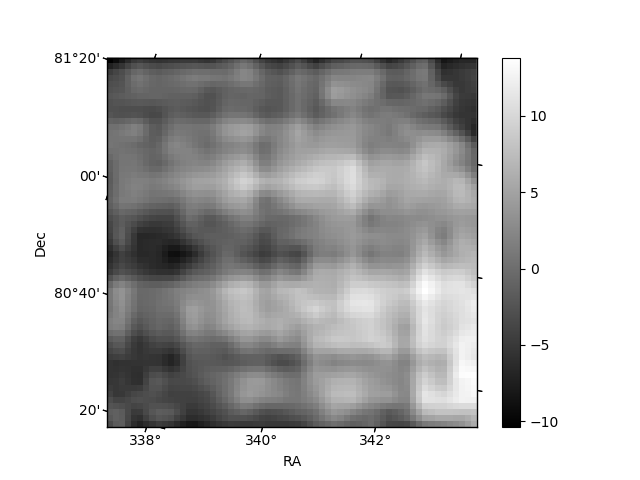
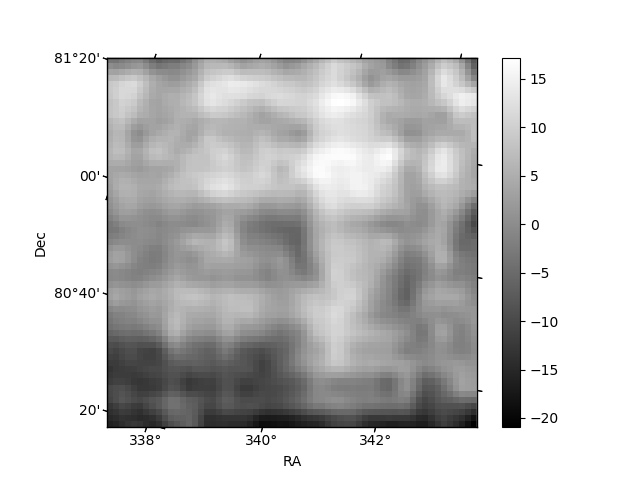
Histogram calculated using DETX and DETY for each event in the final _common_clean file
| Quadrant A | 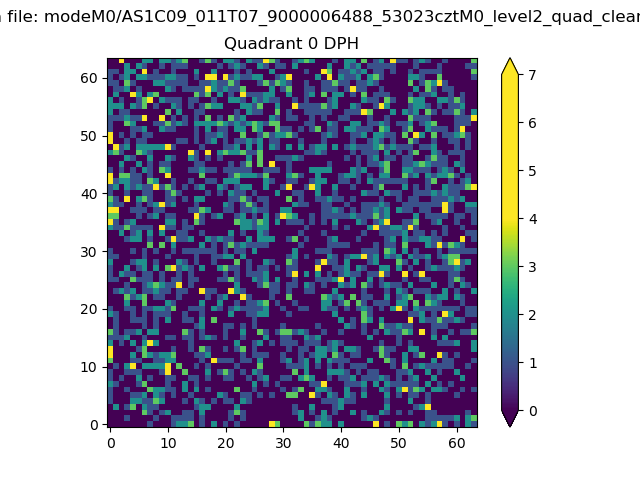 |
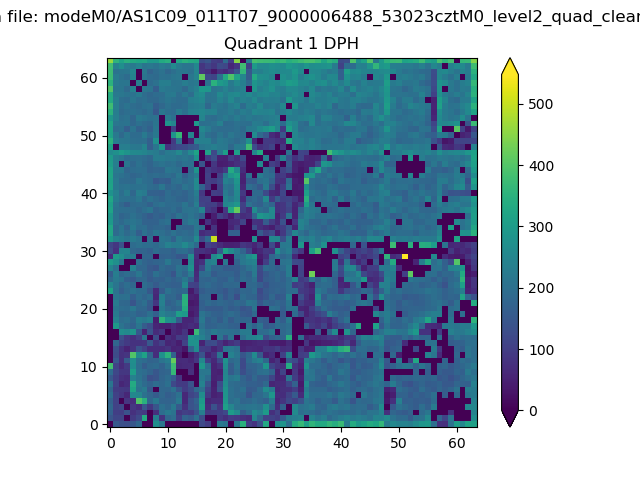 |
Quadrant B |
|---|---|---|---|
| Quadrant D | 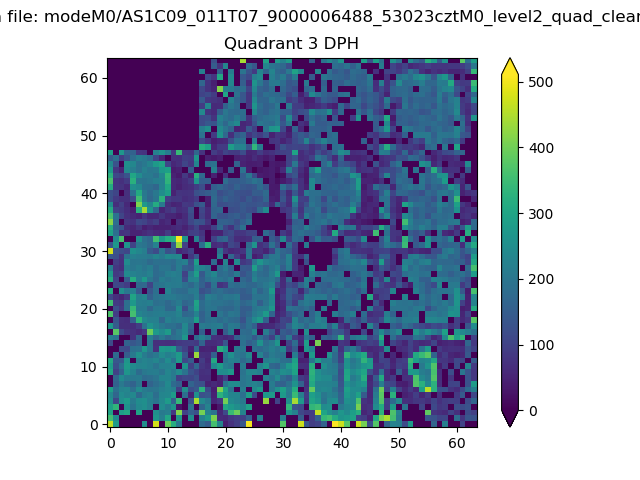 |
 |
Quadrant C |
| Plot type | Count rate plots | Images |
|---|---|---|
| Comparison with Poisson distribution Blue bars denote a histogram of data divided into 1 sec bins. Red curve is a Poisson curve with rate = median count rate of data. |
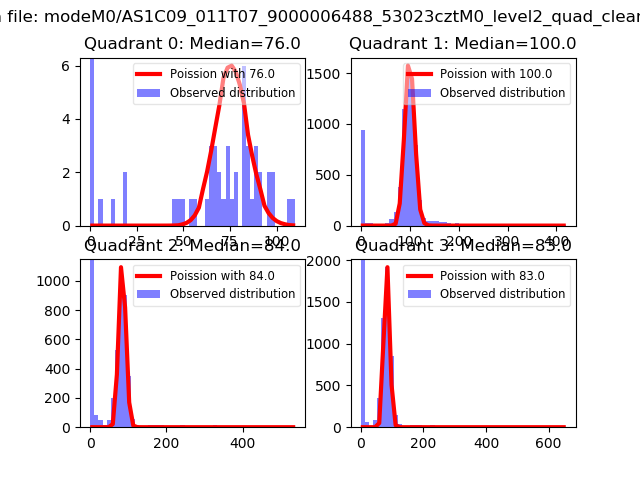 |
 |
| Quadrant-wise count rates Data is divided into 100 sec bins |
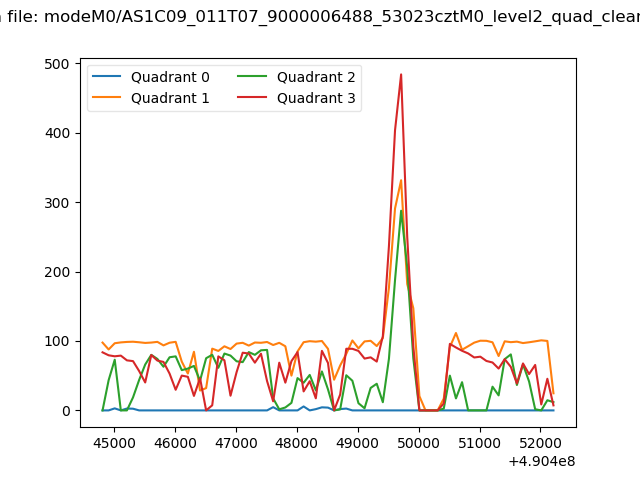 |
|
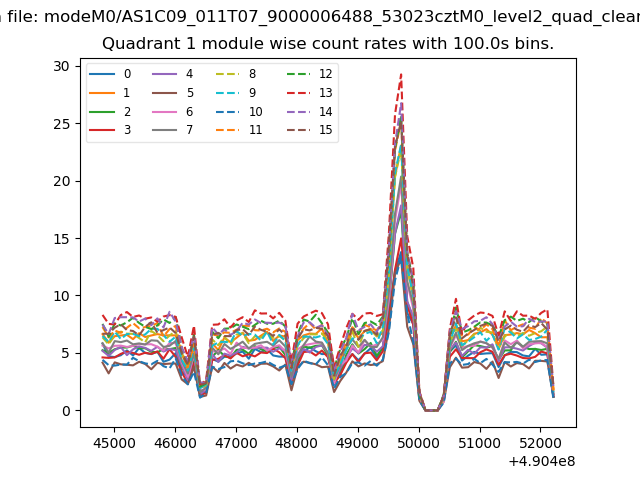
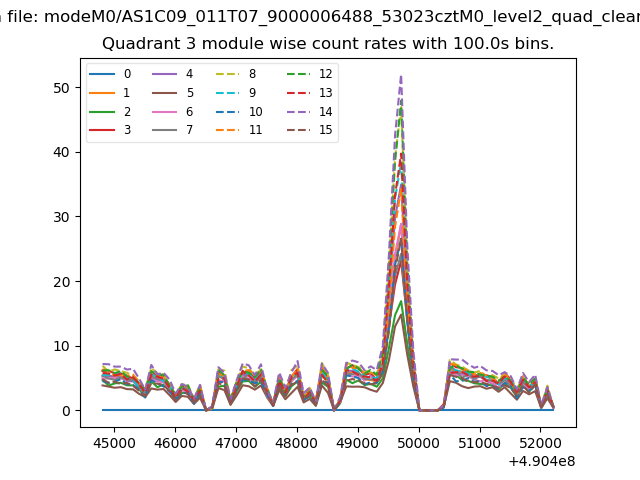
| Module-wise count rates for Quadrant A Data is divided into 100 sec bins |
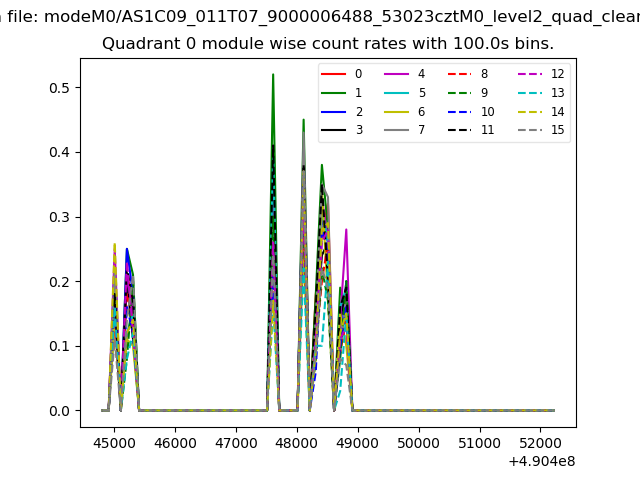 |
 |
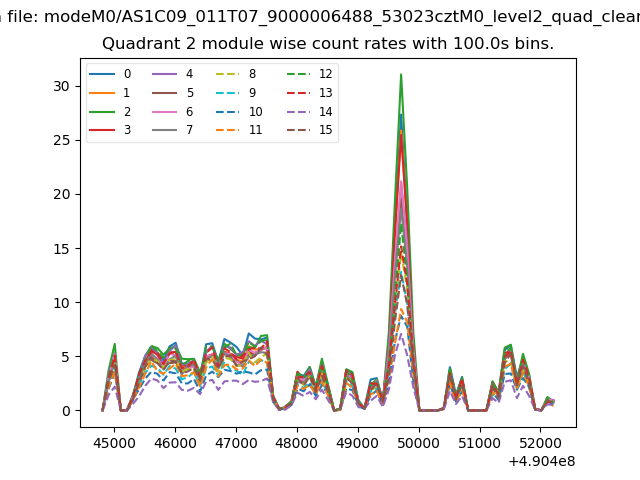
| Module-wise count rates for Quadrant B Data is divided into 100 sec bins |
 |
 |
| Module-wise count rates for Quadrant C Data is divided into 100 sec bins |
 |
 |
| Module-wise count rates for Quadrant D Data is divided into 100 sec bins |
 |
 |
| Parameter | Plot |
|---|---|
| CZT HV Monitor |  |
| D_VDD | 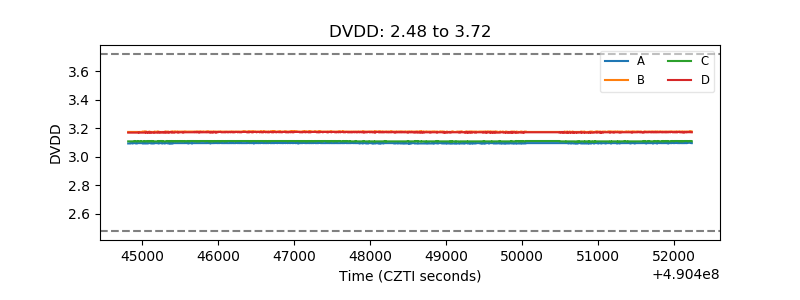 |
| Temperature 1 | 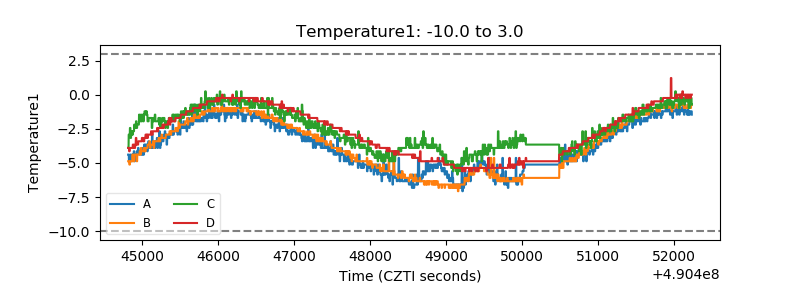 |
| Veto HV Monitor | 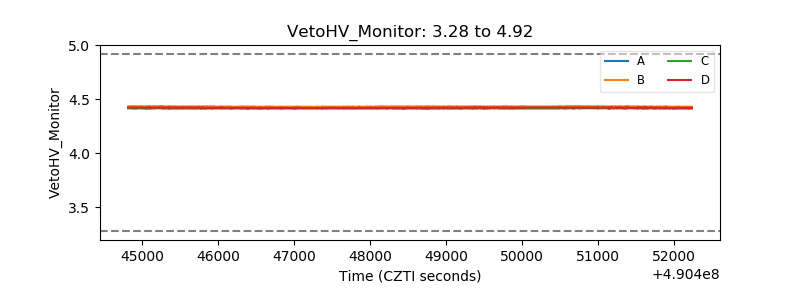 |
| Veto LLD | 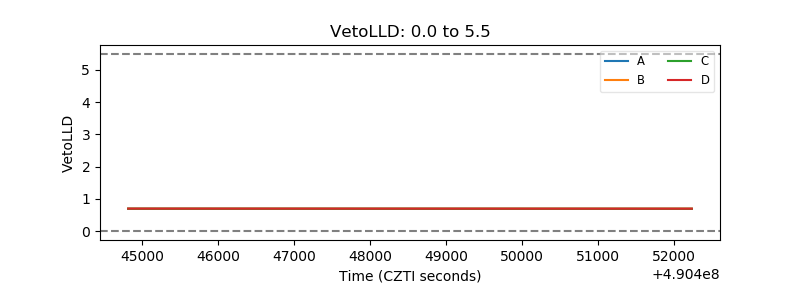 |
| Alpha Counter | 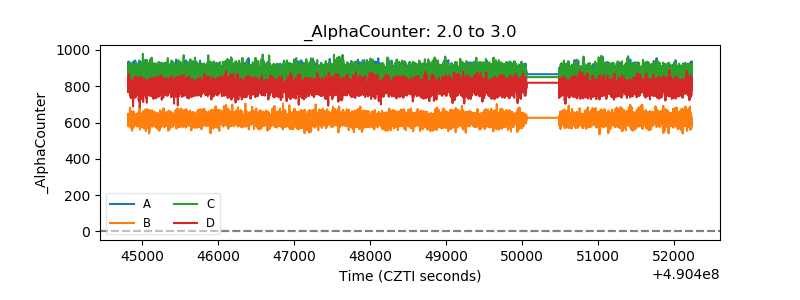 |
| _CPM_Rate | 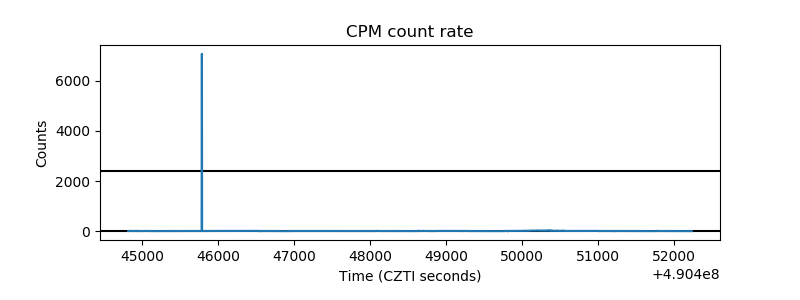 |
| CZT Counter | 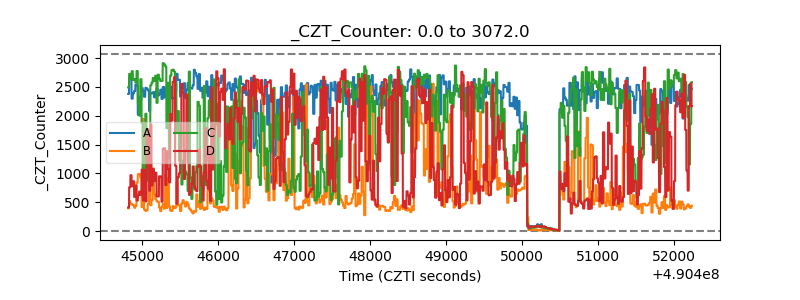 |
| +2.5 Volts monitor | 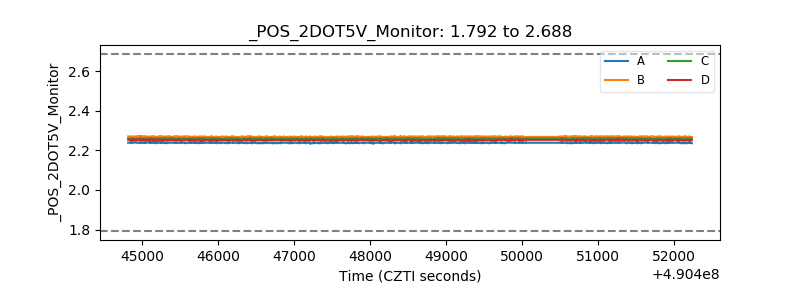 |
| +5 Volts monitor | 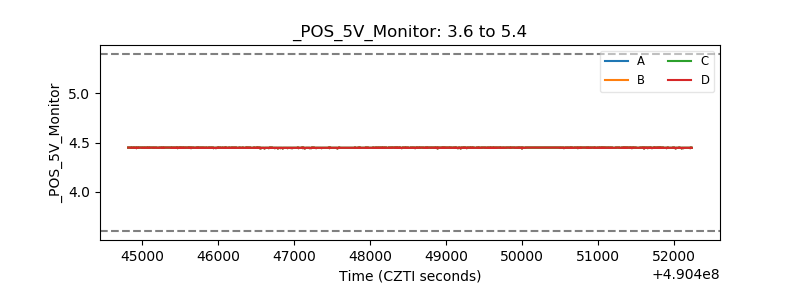 |
| _ROLL_ROT | 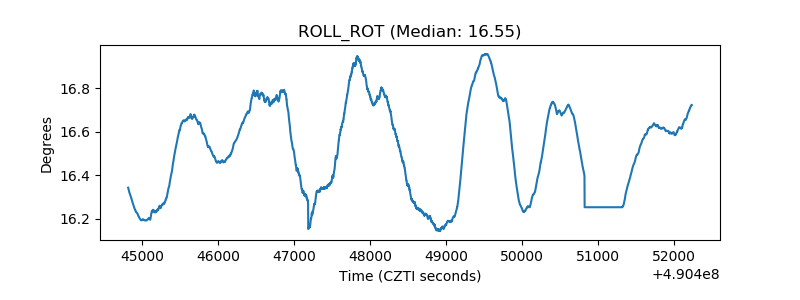 |
| _Roll_DEC | 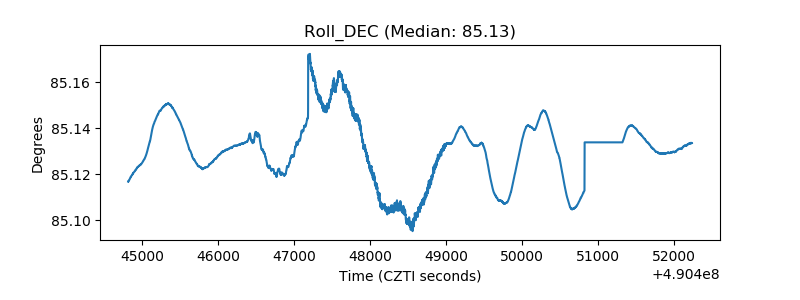 |
| _Roll_RA | 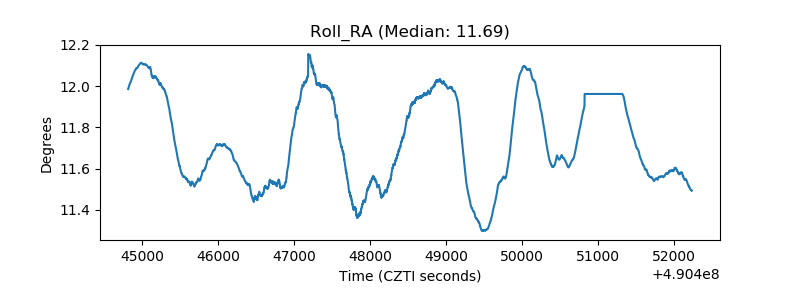 |
| Veto Counter | 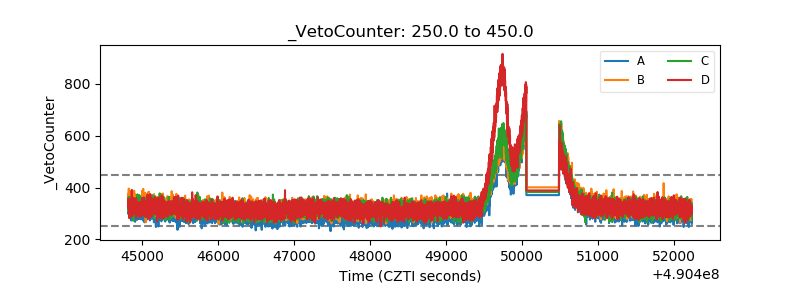 |