| Param | Original file | Final file |
|---|---|---|
| Filename | modeM0/AS1C09_011T07_9000006488_53024cztM0_level2.fits | modeM0/AS1C09_011T07_9000006488_53024cztM0_level2_quad_clean.evt |
| Size (bytes) | 1,145,468,160 | 73,874,880 |
| Size | 1.1 GB | 70.5 MB |
| Events in quadrant A | 17,068,613 | 1,076 |
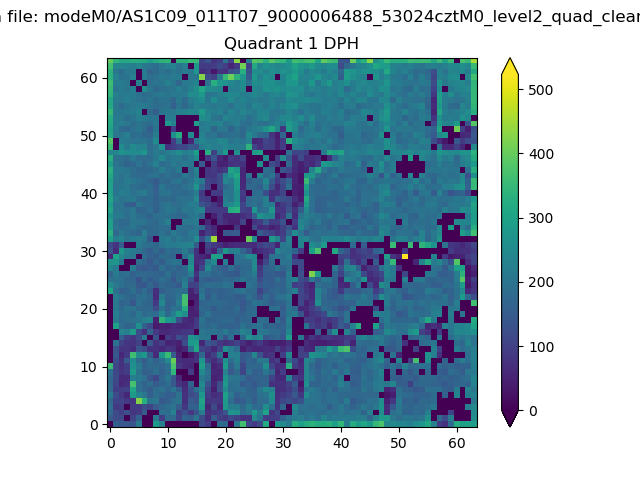
| Events in quadrant B | 5,493,130 | 690,138 |
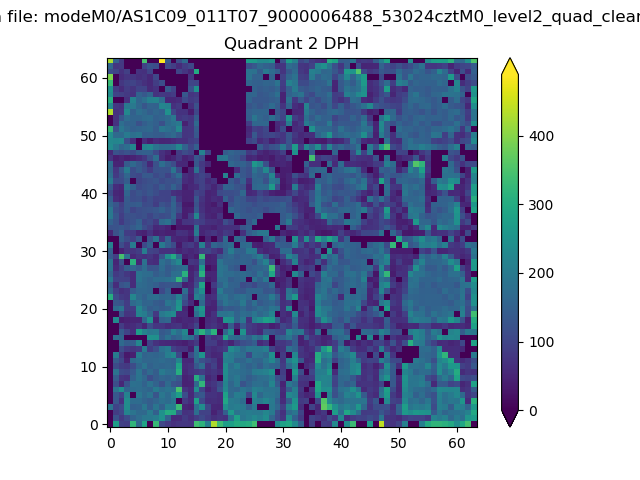
| Events in quadrant C | 10,821,686 | 497,532 |
| Events in quadrant D | 8,451,193 | 537,099 |
| Mode SS | |||
|---|---|---|---|
| Quadrant | BADHDUFLAG | Total packets | Discarded packets |
| A | 0 | 146 | 0 |
| B | 0 | 146 | 0 |
| C | 0 | 146 | 0 |
| D | 0 | 146 | 0 |
| Mode M0 | |||
|---|---|---|---|
| Quadrant | BADHDUFLAG | Total packets | Discarded packets |
| A | 0 | 55672 | 19 |
| B | 0 | 21395 | 0 |
| C | 0 | 37267 | 3 |
| D | 0 | 30132 | 0 |
| Quadrant | Total seconds | Saturated seconds | Saturation percentage |
|---|---|---|---|
| A | 7335 | 7328 | 99.904567% |
| B | 7337 | 695 | 9.472536% |
| C | 7337 | 2226 | 30.339376% |
| D | 7337 | 1521 | 20.730544% |
Noise dominated data is calculated using 1-second bins in cleaned event files. If a bin has >2000 counts, and if more than 50% of those come from <1% of pixels, then it is considered to be noise-dominated and hence unusable.
| Quadrant | # 1 sec bins | Bins with >0 counts | Bins with >2000 counts | High rate bins dominated by noise | Noise dominated (total time) | Noise dominated (detector-on time) | Marked lightcurve |
|---|---|---|---|---|---|---|---|
| A | 7336 | 7334 | 6826 | 6826 | 93.05% | 93.07% | 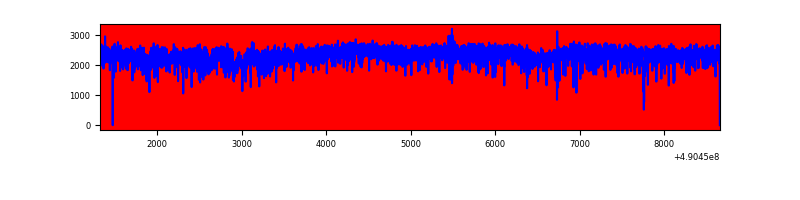 |
| B | 7338 | 7338 | 568 | 568 | 7.74% | 7.74% | 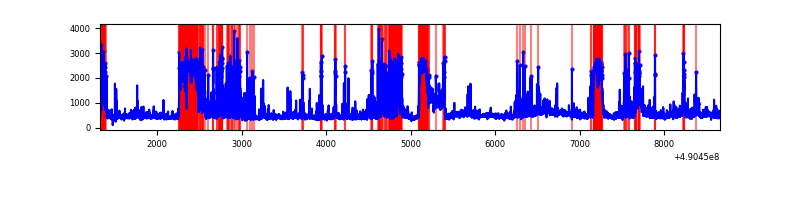 |
| C | 7337 | 7337 | 2057 | 2057 | 28.04% | 28.04% | 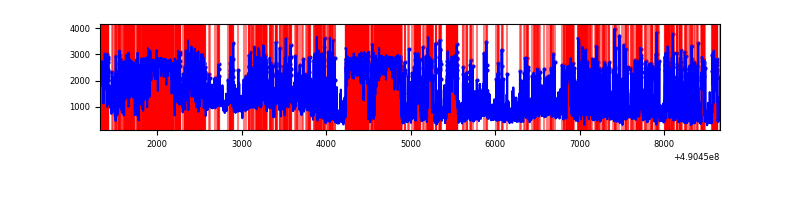 |
| D | 7337 | 7337 | 1403 | 1403 | 19.12% | 19.12% | 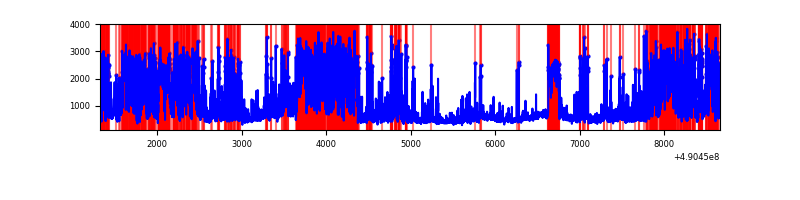 |
Top three noisy pixels from each quadrant. If the there are fewer than three noisy pixels in the level2.evt file, extra rows are filled as -1
| Pixel properties | Quadrant properties | ||||||
|---|---|---|---|---|---|---|---|
| Quadrant | DetID | PixID | Counts | Sigma | Mean | Median | Sigma |
| A | 9 | 191 | 15613637 | 497662.94 | 118 | 115 | 31.4 |
| A | 7 | 206 | 455014 | 14499.38 | 118 | 115 | 31.4 |
| A | 15 | 190 | 295799 | 9424.59 | 118 | 115 | 31.4 |
| B | 10 | 44 | 1681816 | 10856.79 | 728 | 703 | 154.8 |
| B | 2 | 249 | 419963 | 2707.62 | 728 | 703 | 154.8 |
| B | 10 | 191 | 81600 | 522.44 | 728 | 703 | 154.8 |
| C | 15 | 224 | 2755525 | 15483.8 | 649 | 643 | 177.9 |
| C | 1 | 241 | 2617951 | 14710.57 | 649 | 643 | 177.9 |
| C | 9 | 38 | 1678770 | 9431.91 | 649 | 643 | 177.9 |
| D | 12 | 17 | 3310752 | 16437.9 | 688 | 655 | 201.4 |
| D | 8 | 176 | 824577 | 4091.59 | 688 | 655 | 201.4 |
| D | 2 | 62 | 395638 | 1961.48 | 688 | 655 | 201.4 |
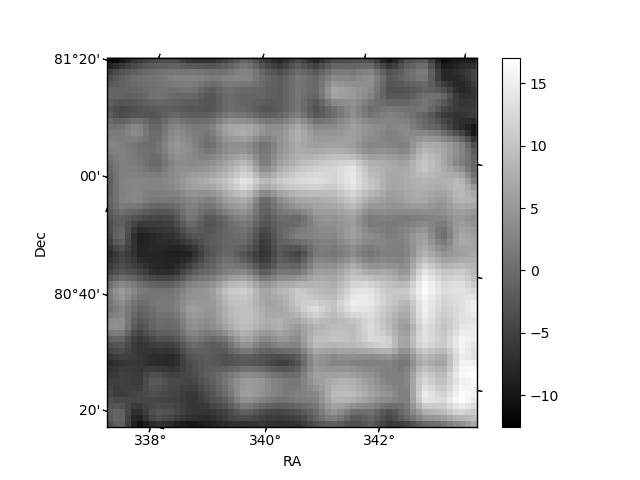
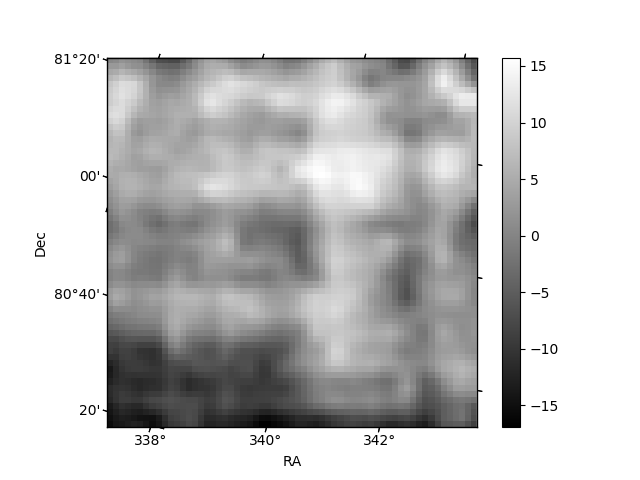
Histogram calculated using DETX and DETY for each event in the final _common_clean file
| Quadrant A | 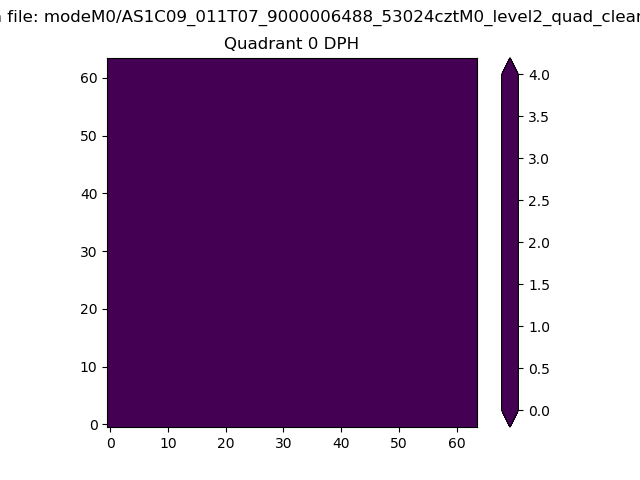 |
 |
Quadrant B |
|---|---|---|---|
| Quadrant D | 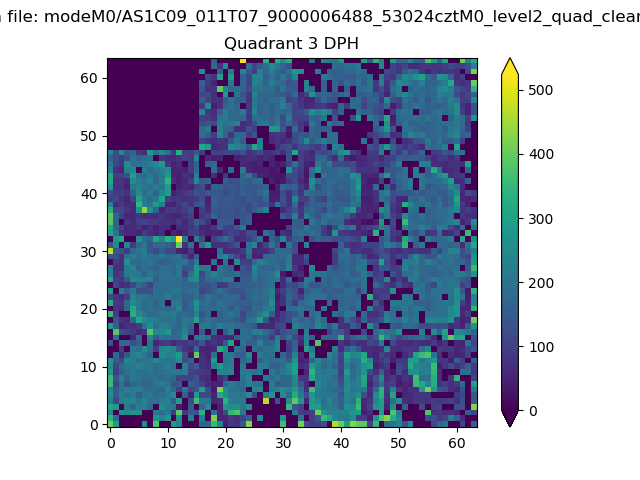 |
 |
Quadrant C |
| Plot type | Count rate plots | Images |
|---|---|---|
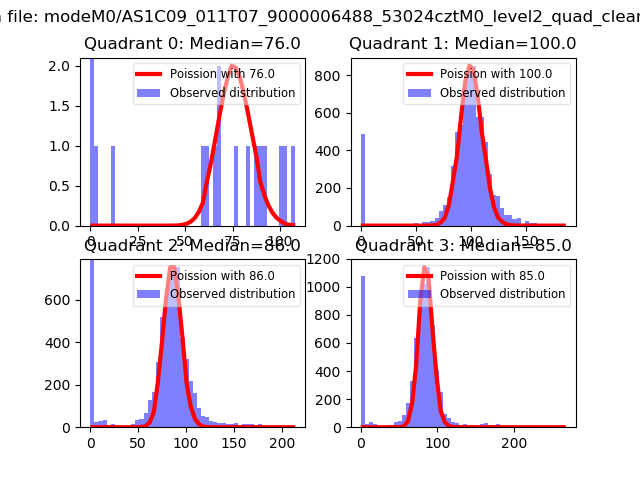
| Comparison with Poisson distribution Blue bars denote a histogram of data divided into 1 sec bins. Red curve is a Poisson curve with rate = median count rate of data. |
 |
 |
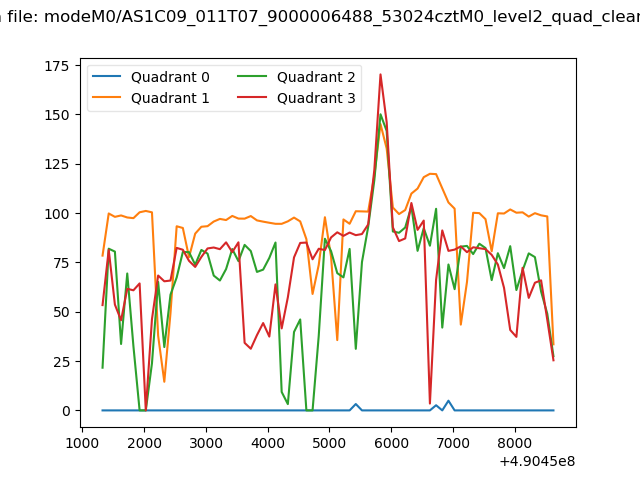
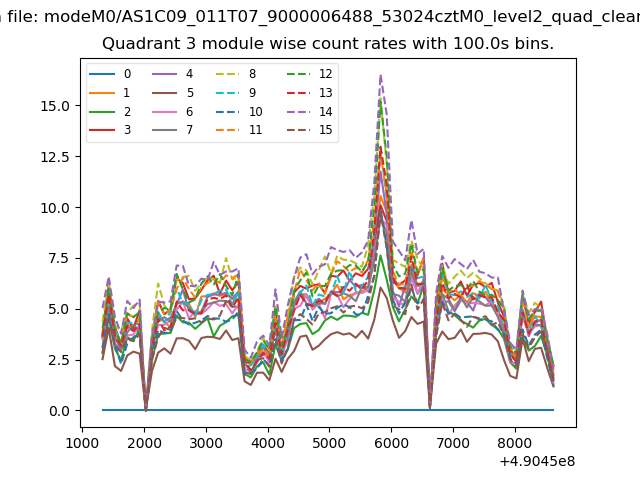
| Quadrant-wise count rates Data is divided into 100 sec bins |
 |
|
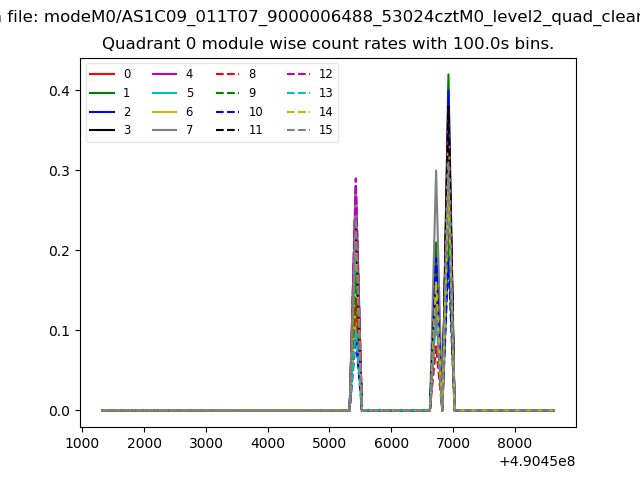
| Module-wise count rates for Quadrant A Data is divided into 100 sec bins |
 |
 |
| Module-wise count rates for Quadrant B Data is divided into 100 sec bins |
 |
 |
| Module-wise count rates for Quadrant C Data is divided into 100 sec bins |
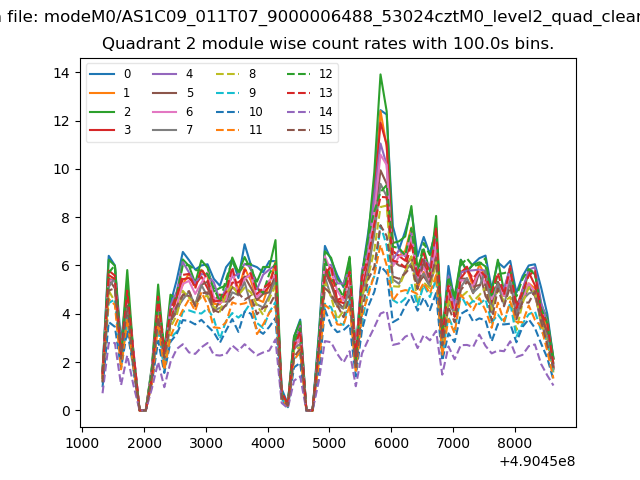 |
 |
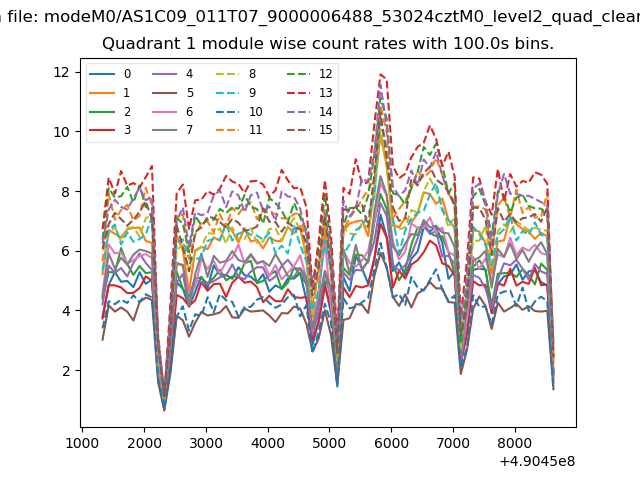
| Module-wise count rates for Quadrant D Data is divided into 100 sec bins |
 |
 |
| Parameter | Plot |
|---|---|
| CZT HV Monitor | 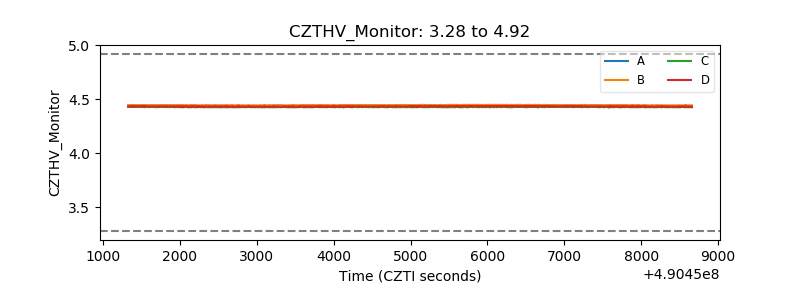 |
| D_VDD | 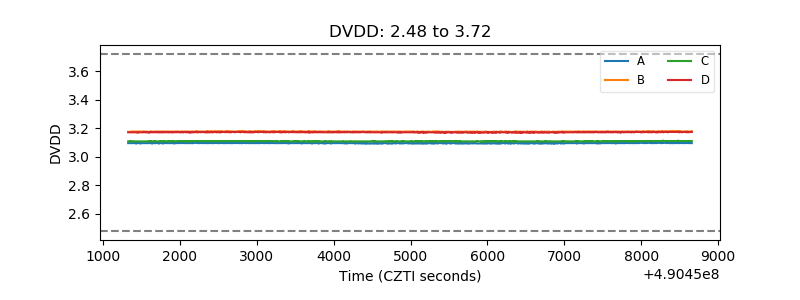 |
| Temperature 1 | 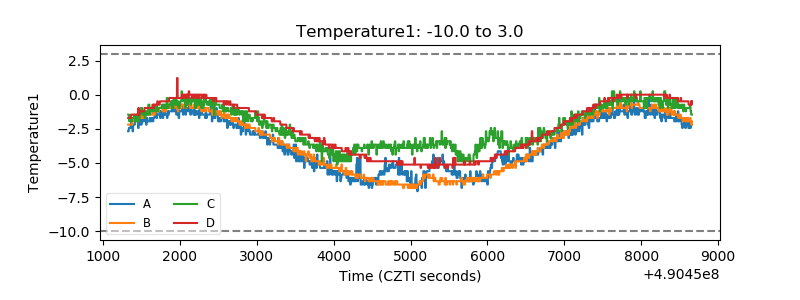 |
| Veto HV Monitor | 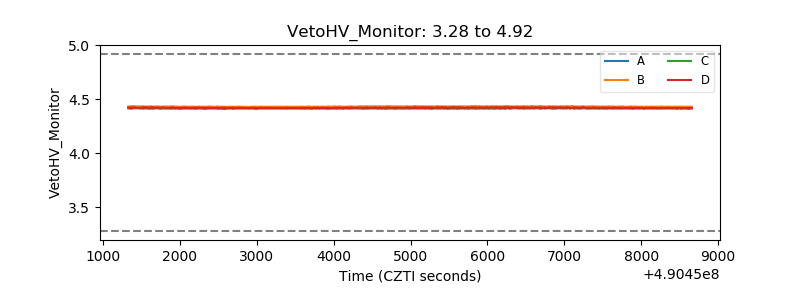 |
| Veto LLD | 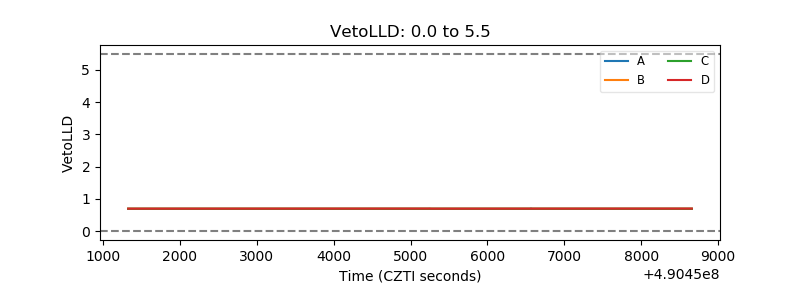 |
| Alpha Counter | 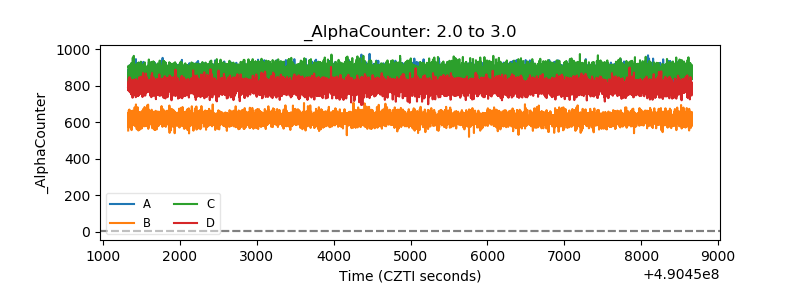 |
| _CPM_Rate | 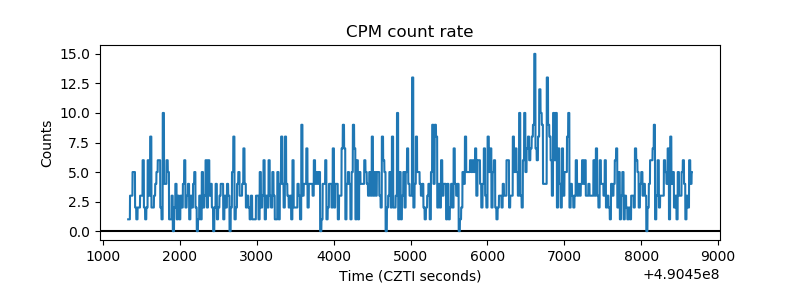 |
| CZT Counter | 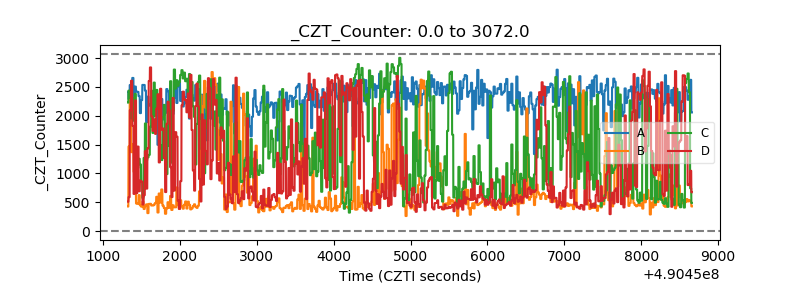 |
| +2.5 Volts monitor |  |
| +5 Volts monitor | 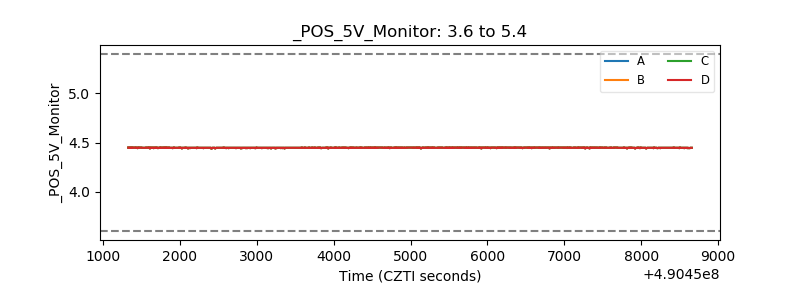 |
| _ROLL_ROT | 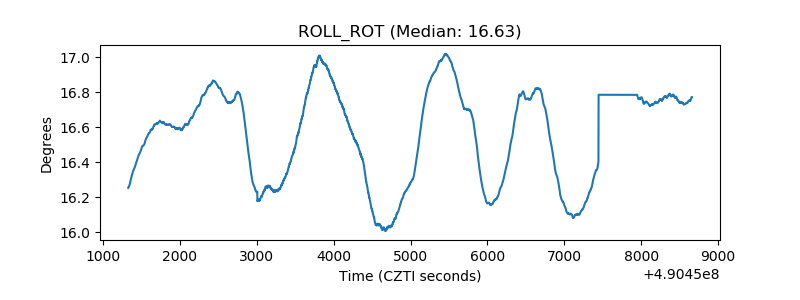 |
| _Roll_DEC | 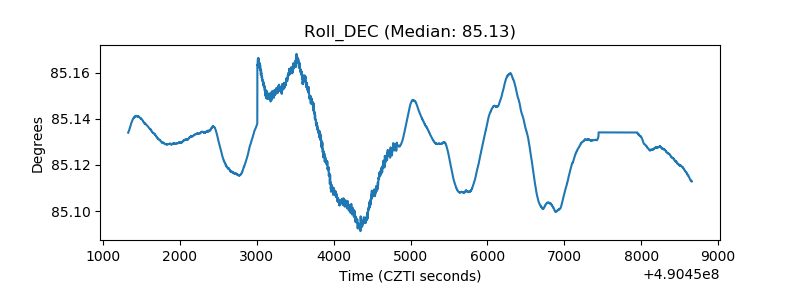 |
| _Roll_RA | 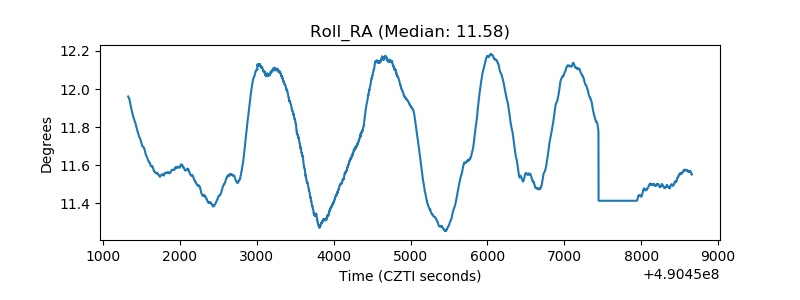 |
| Veto Counter | 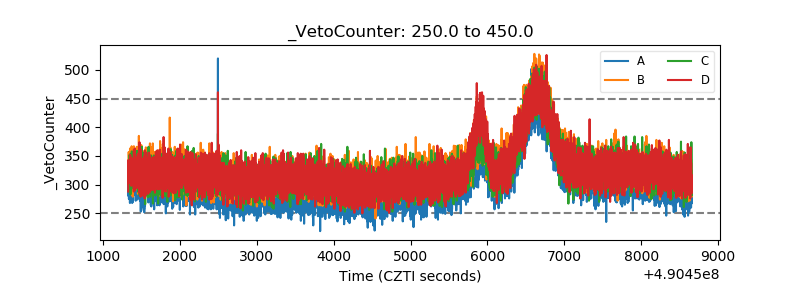 |