| Param | Original file | Final file |
|---|---|---|
| Filename | modeM0/AS1C09_011T07_9000006488_53025cztM0_level2.fits | modeM0/AS1C09_011T07_9000006488_53025cztM0_level2_quad_clean.evt |
| Size (bytes) | 1,036,491,840 | 68,944,320 |
| Size | 988.5 MB | 65.8 MB |
| Events in quadrant A | 16,306,910 | 1,712 |
| Events in quadrant B | 5,250,238 | 621,889 |
| Events in quadrant C | 6,919,723 | 539,582 |
| Events in quadrant D | 9,352,967 | 440,369 |
| Mode SS | |||
|---|---|---|---|
| Quadrant | BADHDUFLAG | Total packets | Discarded packets |
| A | 0 | 138 | 0 |
| B | 0 | 138 | 0 |
| C | 0 | 138 | 0 |
| D | 0 | 138 | 0 |
| Mode M0 | |||
|---|---|---|---|
| Quadrant | BADHDUFLAG | Total packets | Discarded packets |
| A | 0 | 53142 | 0 |
| B | 0 | 20438 | 0 |
| C | 0 | 25368 | 0 |
| D | 0 | 32613 | 1 |
| Quadrant | Total seconds | Saturated seconds | Saturation percentage |
|---|---|---|---|
| A | 6945 | 6931 | 99.798416% |
| B | 6946 | 794 | 11.431039% |
| C | 6946 | 1031 | 14.843075% |
| D | 6945 | 2079 | 29.935205% |
Noise dominated data is calculated using 1-second bins in cleaned event files. If a bin has >2000 counts, and if more than 50% of those come from <1% of pixels, then it is considered to be noise-dominated and hence unusable.
| Quadrant | # 1 sec bins | Bins with >0 counts | Bins with >2000 counts | High rate bins dominated by noise | Noise dominated (total time) | Noise dominated (detector-on time) | Marked lightcurve |
|---|---|---|---|---|---|---|---|
| A | 6944 | 6944 | 6523 | 6523 | 93.94% | 93.94% | 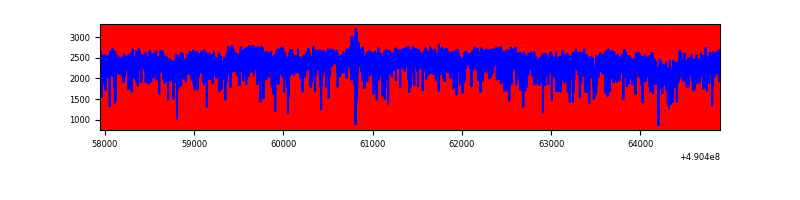 |
| B | 6946 | 6946 | 627 | 627 | 9.03% | 9.03% | 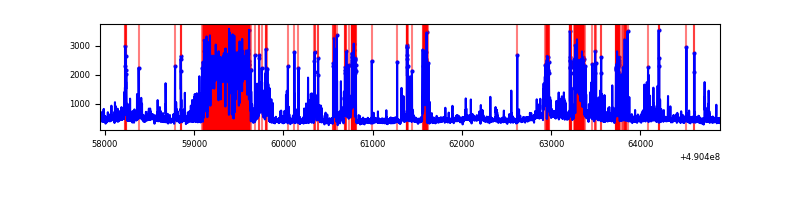 |
| C | 6946 | 6946 | 990 | 990 | 14.25% | 14.25% | 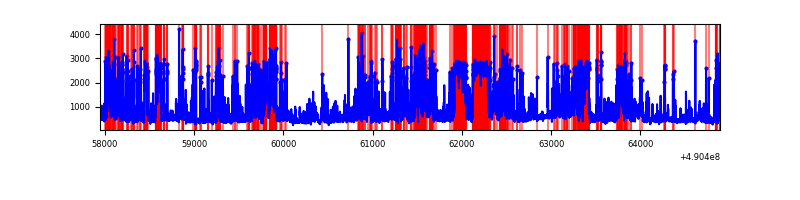 |
| D | 6944 | 6944 | 1964 | 1964 | 28.28% | 28.28% | 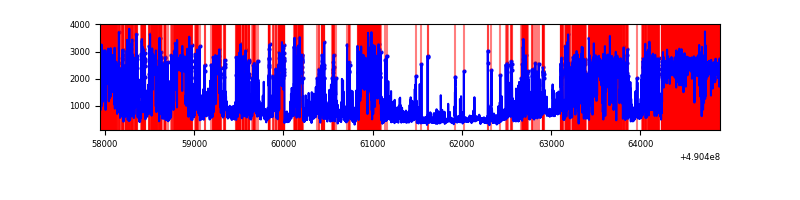 |
Top three noisy pixels from each quadrant. If the there are fewer than three noisy pixels in the level2.evt file, extra rows are filled as -1
| Pixel properties | Quadrant properties | ||||||
|---|---|---|---|---|---|---|---|
| Quadrant | DetID | PixID | Counts | Sigma | Mean | Median | Sigma |
| A | 9 | 191 | 15458638 | 527088.36 | 108 | 105 | 29.3 |
| A | 7 | 206 | 233897 | 7971.59 | 108 | 105 | 29.3 |
| A | 15 | 190 | 59104 | 2011.68 | 108 | 105 | 29.3 |
| B | 10 | 44 | 1466246 | 10184.36 | 680 | 657 | 143.9 |
| B | 2 | 249 | 277918 | 1926.68 | 680 | 657 | 143.9 |
| B | 4 | 81 | 160923 | 1113.69 | 680 | 657 | 143.9 |
| C | 15 | 224 | 1823302 | 10174.13 | 653 | 647 | 179.1 |
| C | 1 | 241 | 1443976 | 8056.72 | 653 | 647 | 179.1 |
| C | 7 | 80 | 247658 | 1378.83 | 653 | 647 | 179.1 |
| D | 12 | 17 | 3400051 | 19400.57 | 609 | 581 | 175.2 |
| D | 8 | 176 | 1748809 | 9977.03 | 609 | 581 | 175.2 |
| D | 15 | 78 | 435166 | 2480.15 | 609 | 581 | 175.2 |
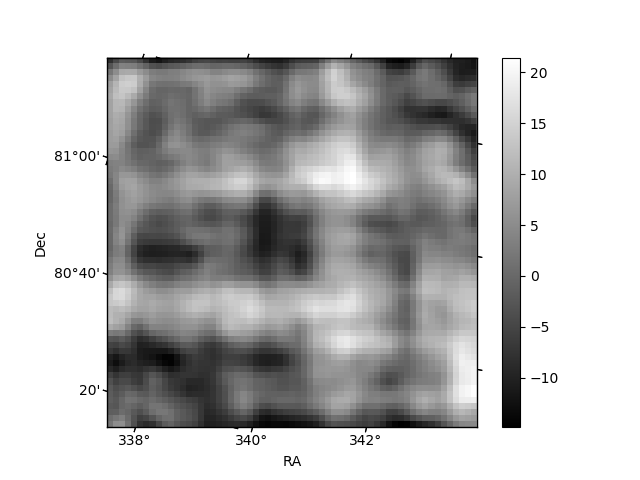
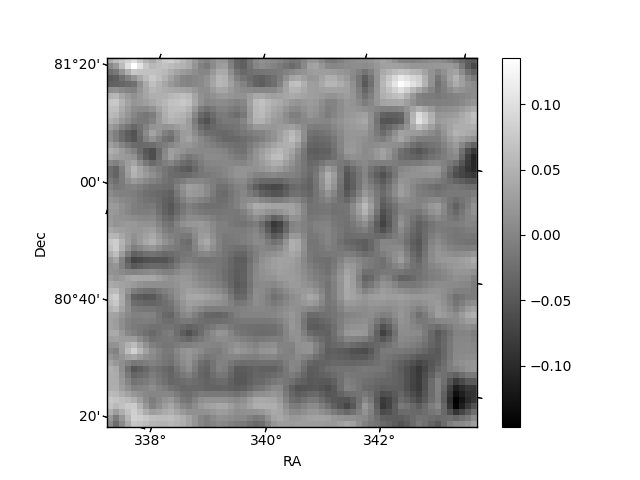
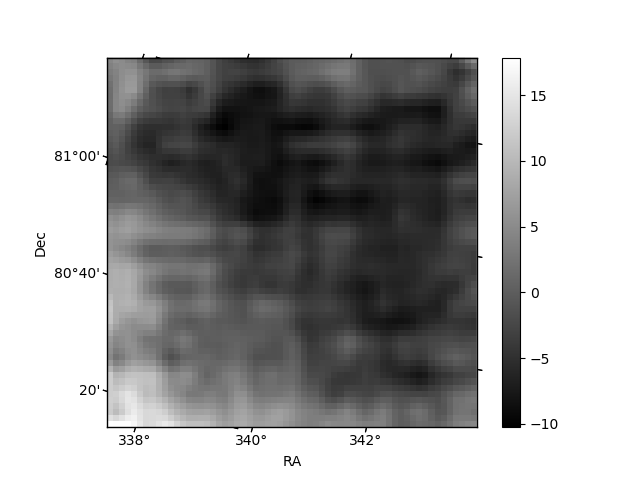
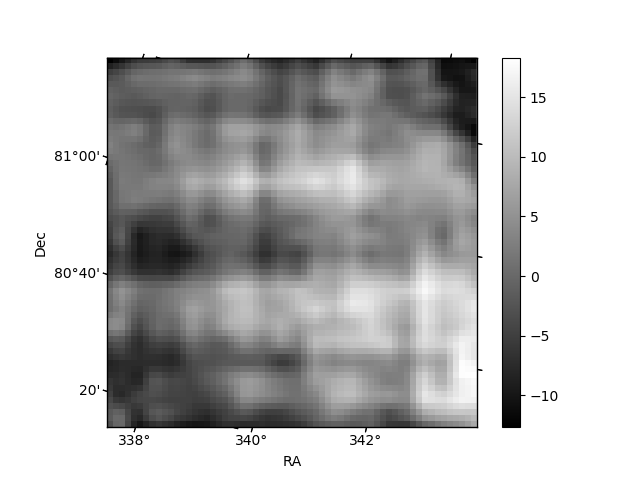
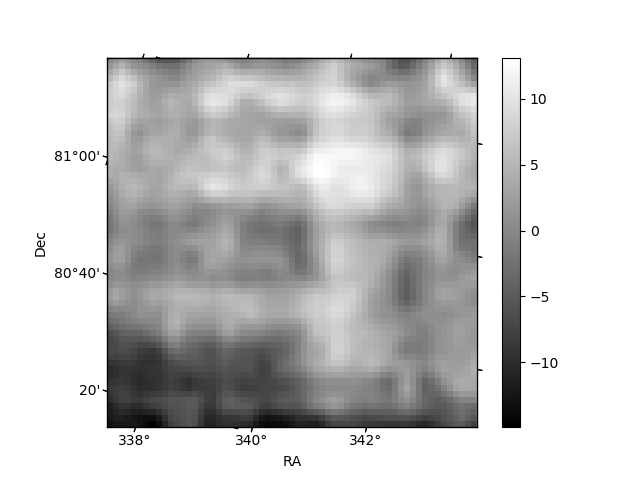
Histogram calculated using DETX and DETY for each event in the final _common_clean file
| Quadrant A | 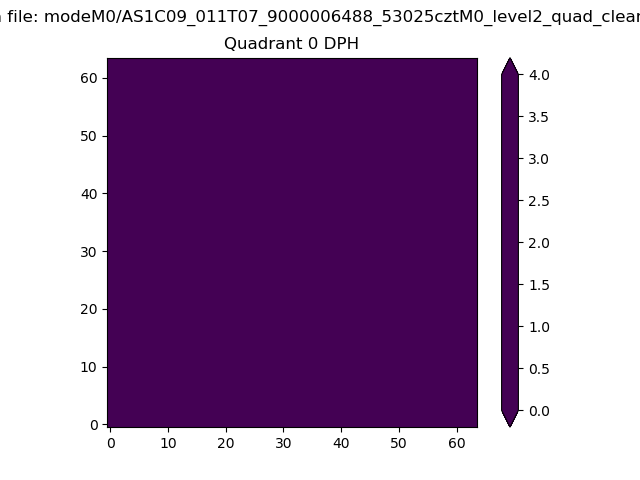 |
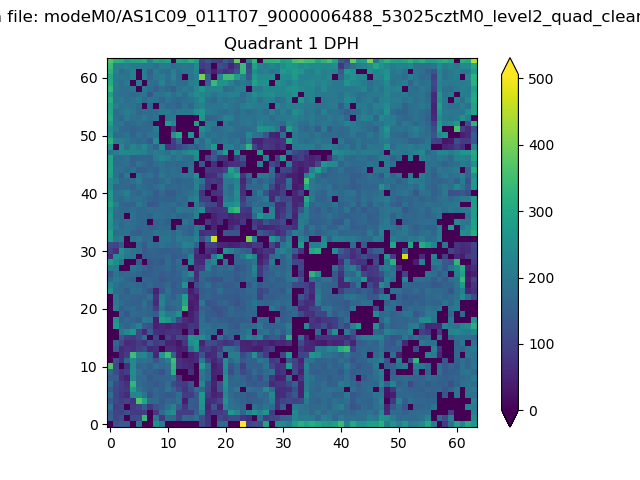 |
Quadrant B |
|---|---|---|---|
| Quadrant D | 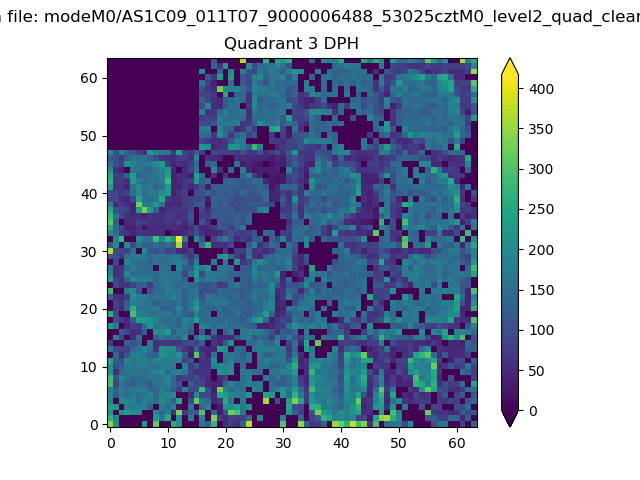 |
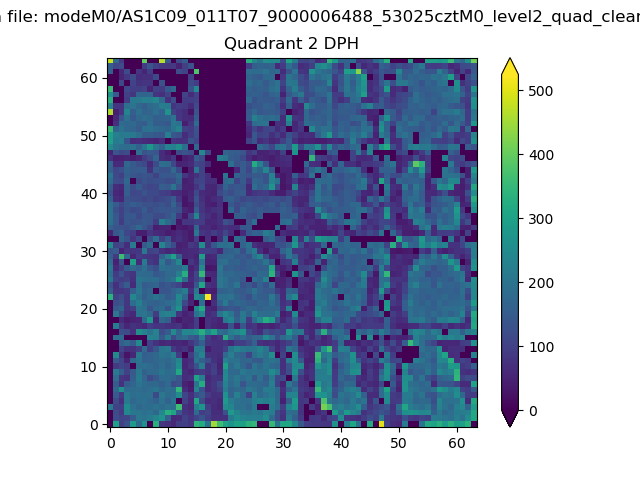 |
Quadrant C |
| Plot type | Count rate plots | Images |
|---|---|---|
| Comparison with Poisson distribution Blue bars denote a histogram of data divided into 1 sec bins. Red curve is a Poisson curve with rate = median count rate of data. |
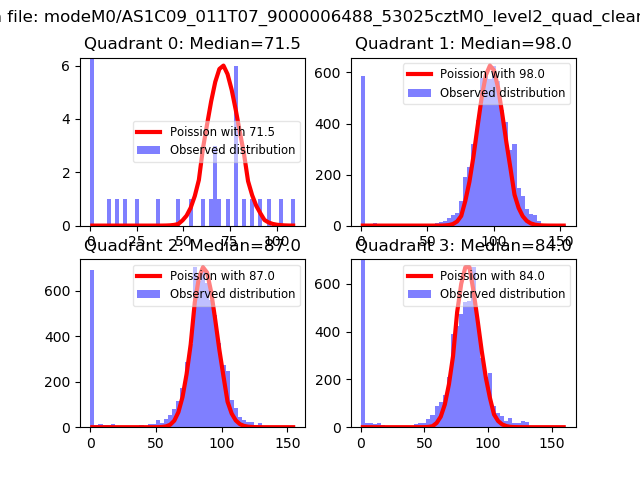 |
 |
| Quadrant-wise count rates Data is divided into 100 sec bins |
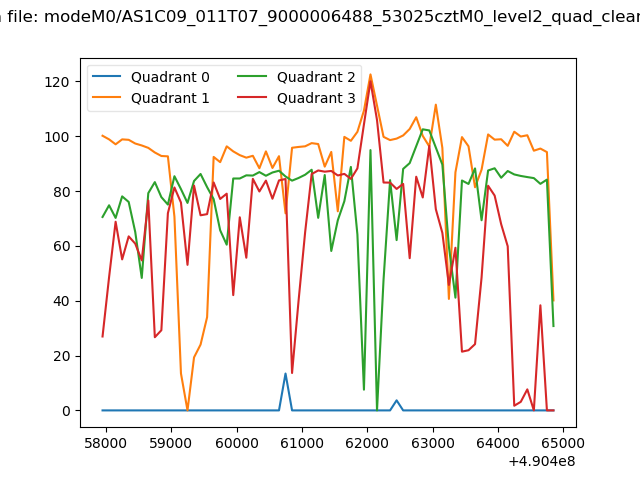 |
|
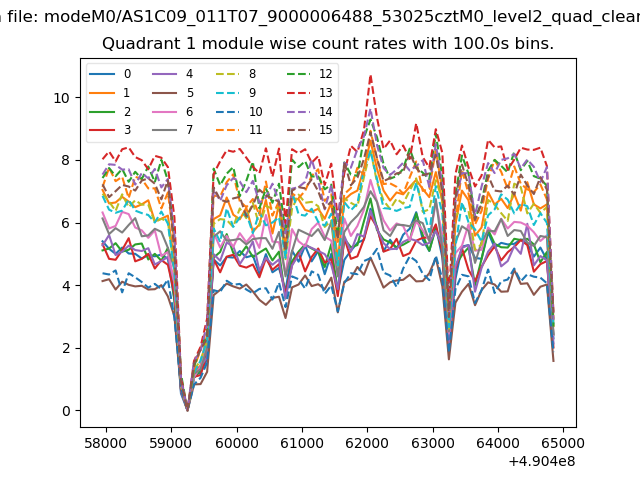
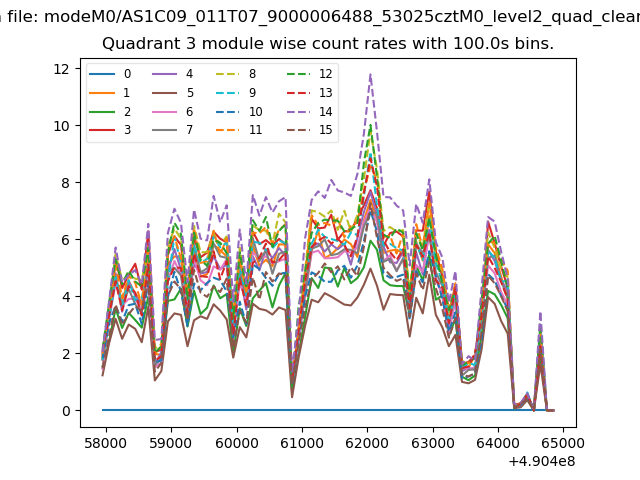
| Module-wise count rates for Quadrant A Data is divided into 100 sec bins |
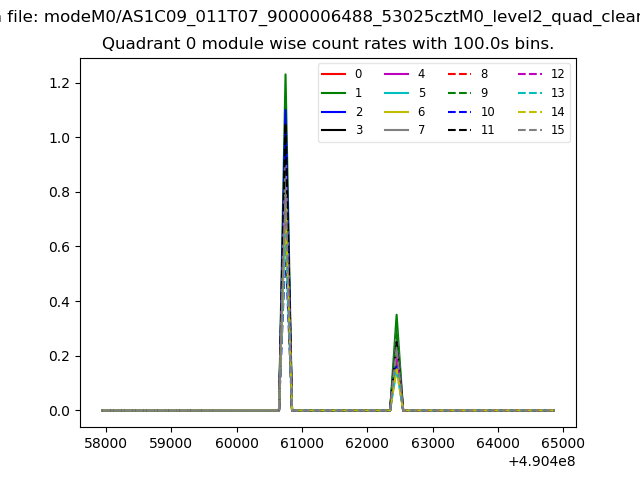 |
 |
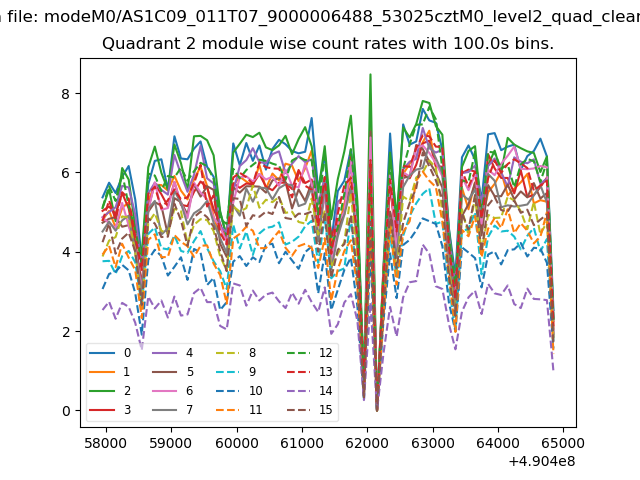
| Module-wise count rates for Quadrant B Data is divided into 100 sec bins |
 |
 |
| Module-wise count rates for Quadrant C Data is divided into 100 sec bins |
 |
 |
| Module-wise count rates for Quadrant D Data is divided into 100 sec bins |
 |
 |
| Parameter | Plot |
|---|---|
| CZT HV Monitor | 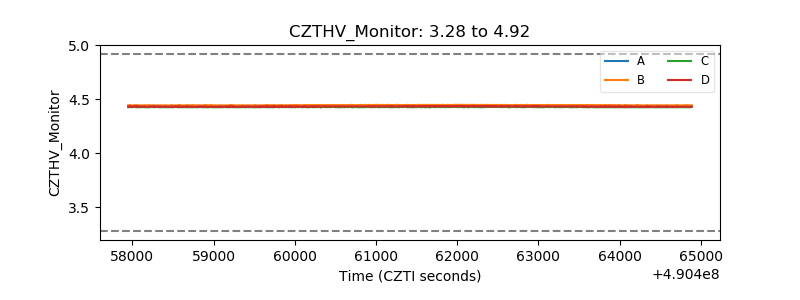 |
| D_VDD | 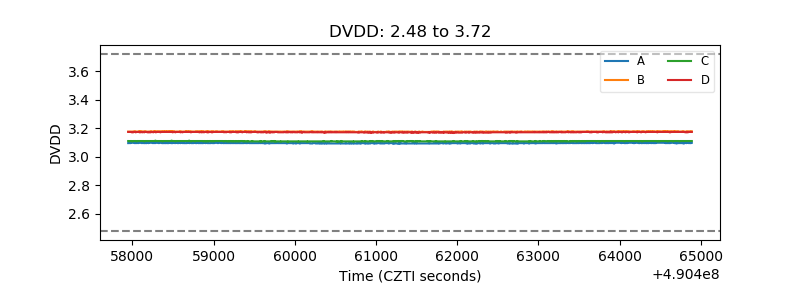 |
| Temperature 1 | 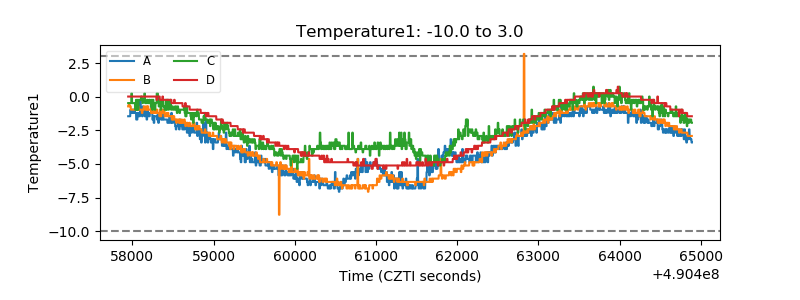 |
| Veto HV Monitor | 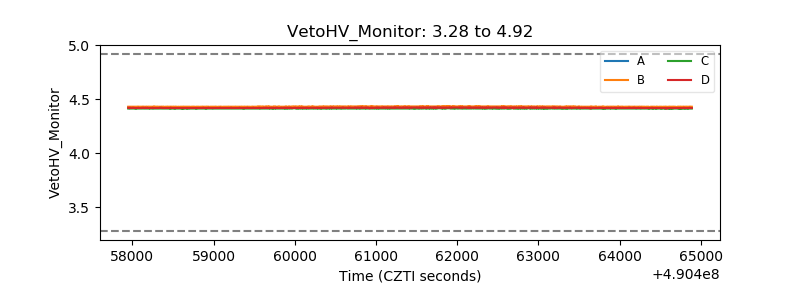 |
| Veto LLD | 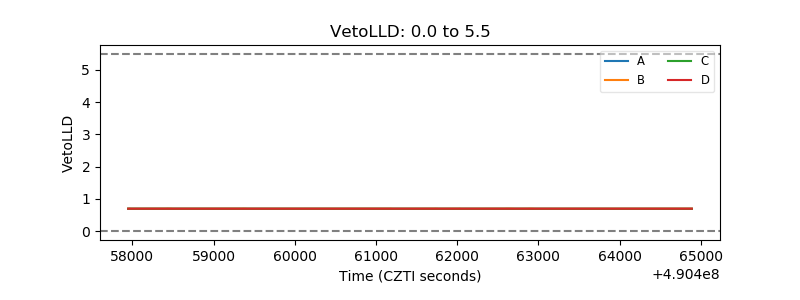 |
| Alpha Counter | 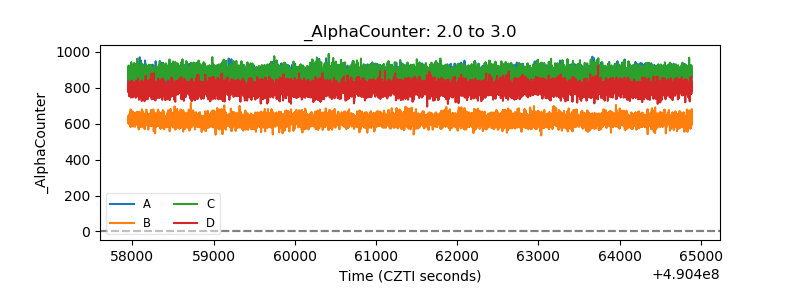 |
| _CPM_Rate |  |
| CZT Counter | 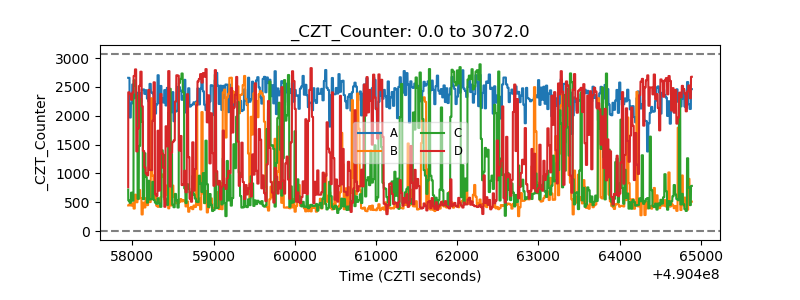 |
| +2.5 Volts monitor | 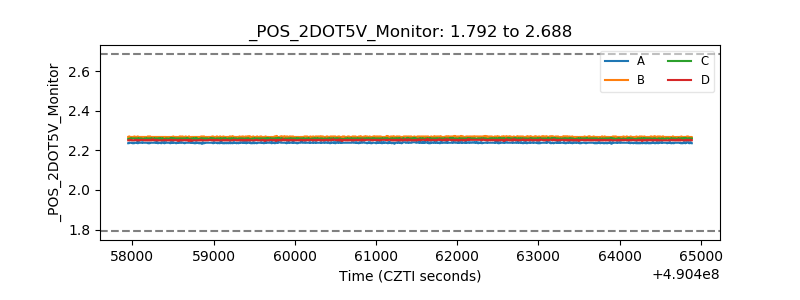 |
| +5 Volts monitor | 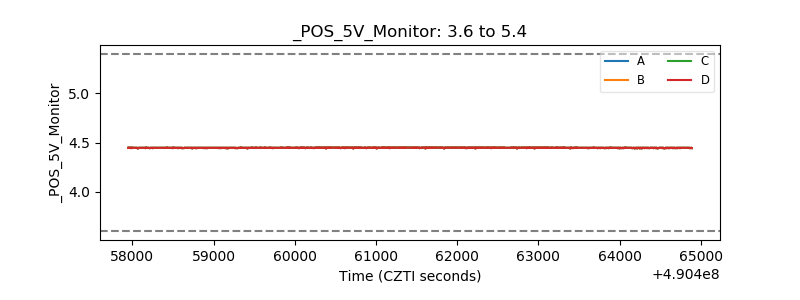 |
| _ROLL_ROT | 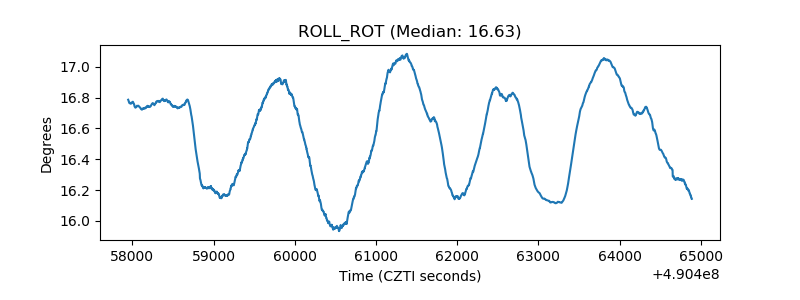 |
| _Roll_DEC | 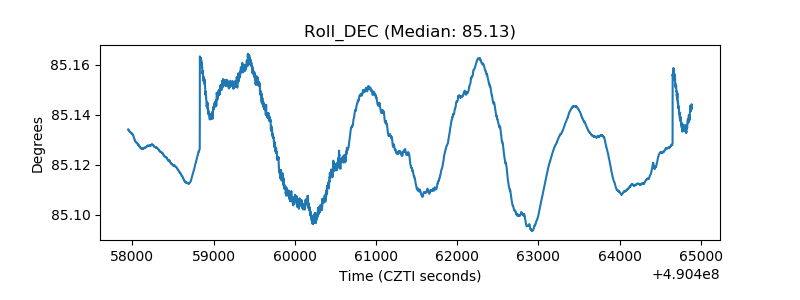 |
| _Roll_RA | 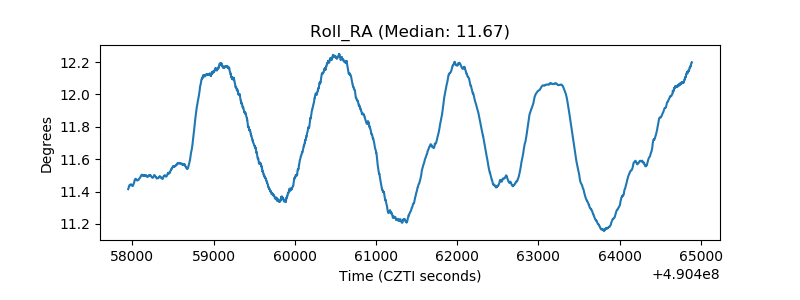 |
| Veto Counter | 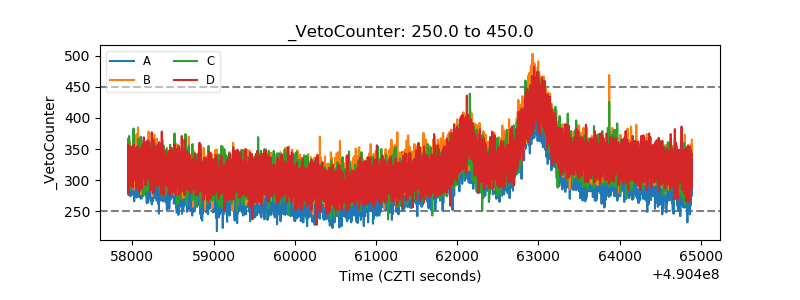 |