| Param | Original file | Final file |
|---|---|---|
| Filename | modeM0/AS1C09_011T07_9000006488_53029cztM0_level2.fits | modeM0/AS1C09_011T07_9000006488_53029cztM0_level2_quad_clean.evt |
| Size (bytes) | 2,609,017,920 | 149,086,080 |
| Size | 2.4 GB | 142.2 MB |
| Events in quadrant A | 39,823,089 | 14,259 |
| Events in quadrant B | 12,327,763 | 1,389,602 |
| Events in quadrant C | 20,116,835 | 1,053,502 |
| Events in quadrant D | 23,073,866 | 946,523 |
| Mode SS | |||
|---|---|---|---|
| Quadrant | BADHDUFLAG | Total packets | Discarded packets |
| A | 0 | 324 | 0 |
| B | 0 | 324 | 0 |
| C | 0 | 324 | 0 |
| D | 0 | 324 | 0 |
| Mode M9 | |||
|---|---|---|---|
| Quadrant | BADHDUFLAG | Total packets | Discarded packets |
| A | 0 | 3 | 0 |
| B | 0 | 3 | 0 |
| C | 0 | 3 | 0 |
| D | 0 | 3 | 0 |
| Mode M0 | |||
|---|---|---|---|
| Quadrant | BADHDUFLAG | Total packets | Discarded packets |
| A | 0 | 129241 | 9 |
| B | 0 | 47743 | 3 |
| C | 0 | 71040 | 3 |
| D | 0 | 79708 | 3 |
| Quadrant | Total seconds | Saturated seconds | Saturation percentage |
|---|---|---|---|
| A | 16069 | 15961 | 99.327898% |
| B | 16070 | 1702 | 10.591164% |
| C | 16070 | 4100 | 25.513379% |
| D | 16070 | 5244 | 32.632234% |
Noise dominated data is calculated using 1-second bins in cleaned event files. If a bin has >2000 counts, and if more than 50% of those come from <1% of pixels, then it is considered to be noise-dominated and hence unusable.
| Quadrant | # 1 sec bins | Bins with >0 counts | Bins with >2000 counts | High rate bins dominated by noise | Noise dominated (total time) | Noise dominated (detector-on time) | Marked lightcurve |
|---|---|---|---|---|---|---|---|
| A | 16483 | 16068 | 15431 | 15431 | 93.62% | 96.04% | 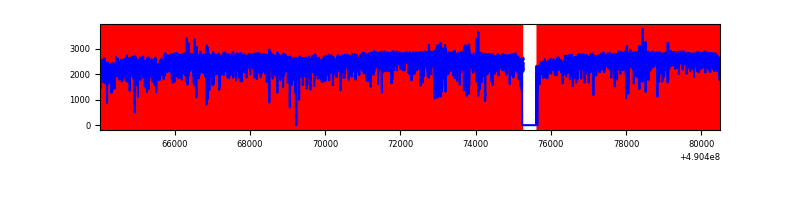 |
| B | 16485 | 16073 | 1393 | 1393 | 8.45% | 8.67% | 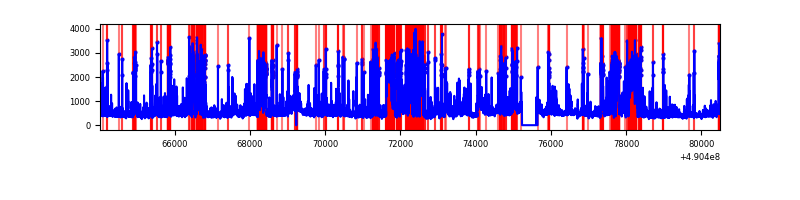 |
| C | 16484 | 16070 | 3891 | 3891 | 23.60% | 24.21% | 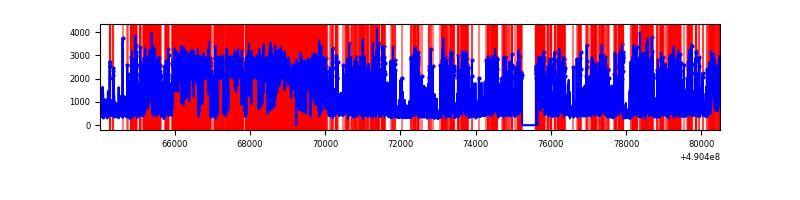 |
| D | 16484 | 16069 | 4993 | 4993 | 30.29% | 31.07% | 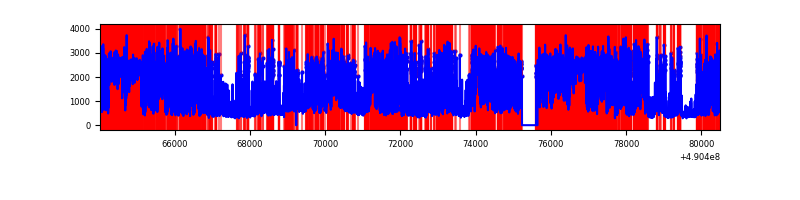 |
Top three noisy pixels from each quadrant. If the there are fewer than three noisy pixels in the level2.evt file, extra rows are filled as -1
| Pixel properties | Quadrant properties | ||||||
|---|---|---|---|---|---|---|---|
| Quadrant | DetID | PixID | Counts | Sigma | Mean | Median | Sigma |
| A | 9 | 191 | 37286488 | 416332.47 | 349 | 340 | 89.6 |
| A | 7 | 206 | 604161 | 6742.19 | 349 | 340 | 89.6 |
| A | 0 | 8 | 236809 | 2640.38 | 349 | 340 | 89.6 |
| B | 10 | 44 | 3015576 | 9177.65 | 1563 | 1509 | 328.4 |
| B | 4 | 216 | 508359 | 1543.33 | 1563 | 1509 | 328.4 |
| B | 2 | 249 | 492958 | 1496.43 | 1563 | 1509 | 328.4 |
| C | 1 | 241 | 5461864 | 14073.34 | 1425 | 1418 | 388.0 |
| C | 15 | 224 | 3999439 | 10304.2 | 1425 | 1418 | 388.0 |
| C | 7 | 80 | 2010604 | 5178.32 | 1425 | 1418 | 388.0 |
| D | 12 | 17 | 10255193 | 25529.66 | 1371 | 1305 | 401.6 |
| D | 8 | 176 | 2244326 | 5584.57 | 1371 | 1305 | 401.6 |
| D | 2 | 62 | 887551 | 2206.53 | 1371 | 1305 | 401.6 |
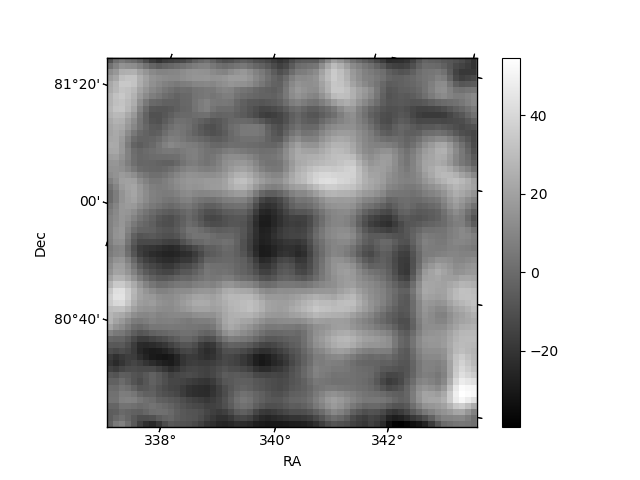
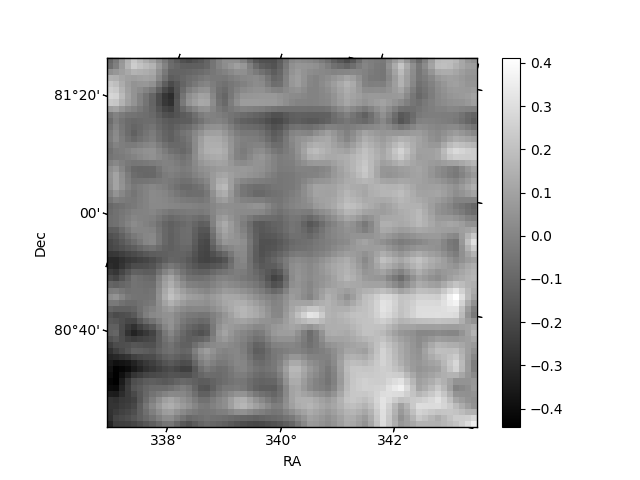
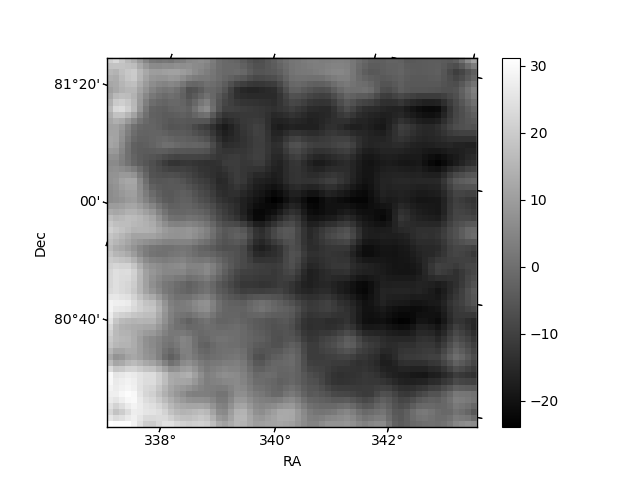
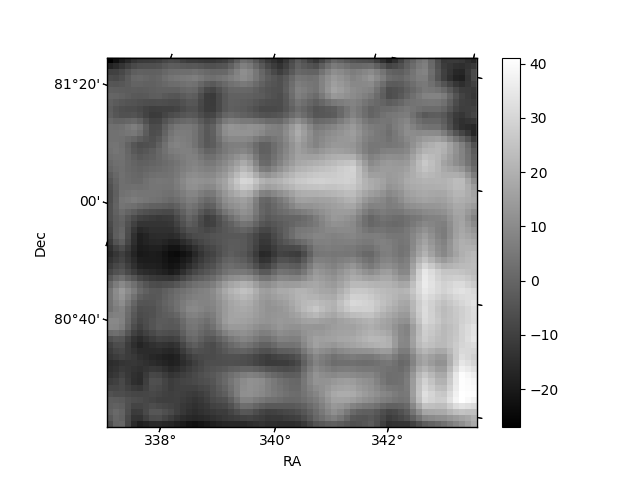
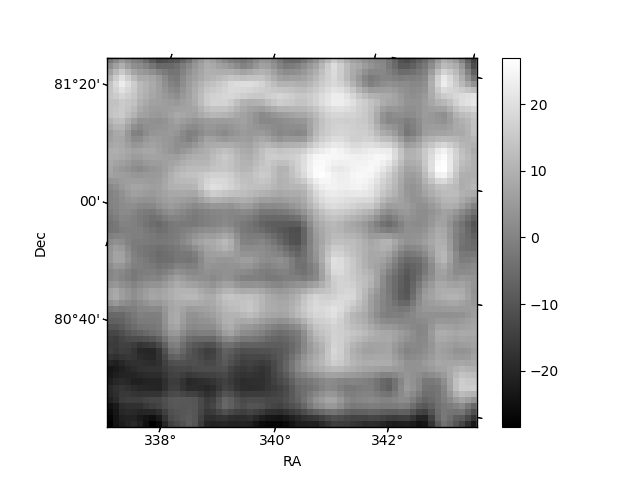
Histogram calculated using DETX and DETY for each event in the final _common_clean file
| Quadrant A | 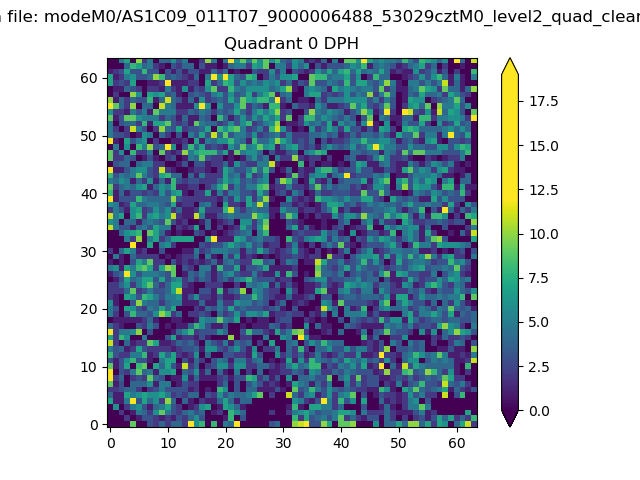 |
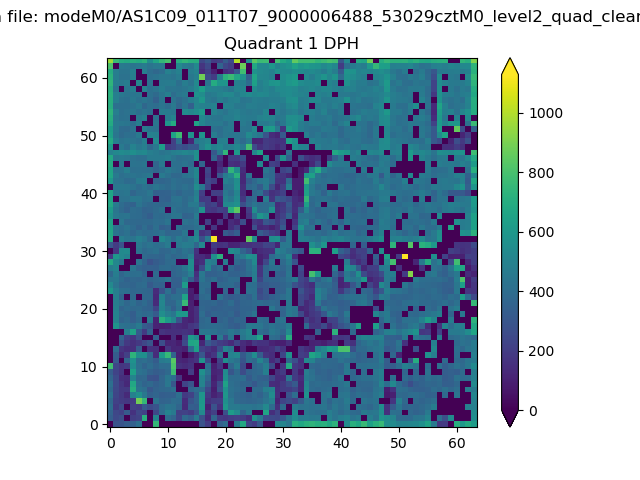 |
Quadrant B |
|---|---|---|---|
| Quadrant D | 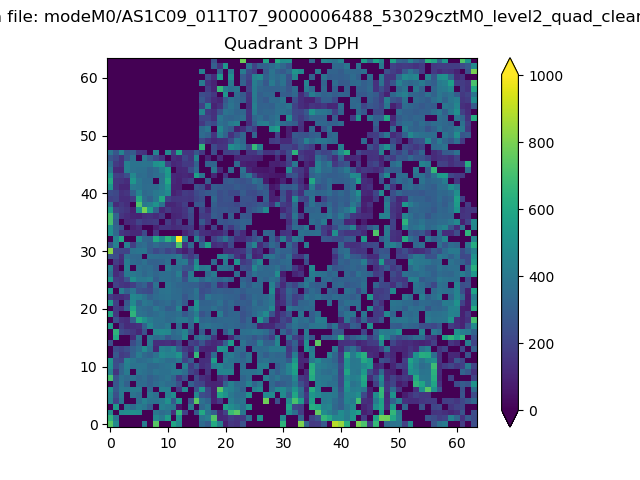 |
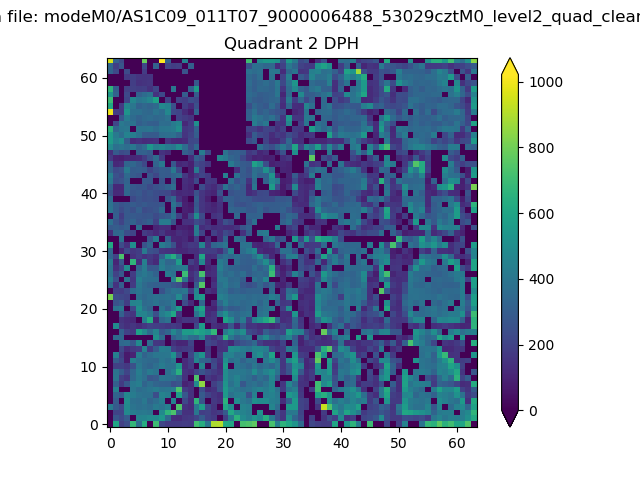 |
Quadrant C |
| Plot type | Count rate plots | Images |
|---|---|---|
| Comparison with Poisson distribution Blue bars denote a histogram of data divided into 1 sec bins. Red curve is a Poisson curve with rate = median count rate of data. |
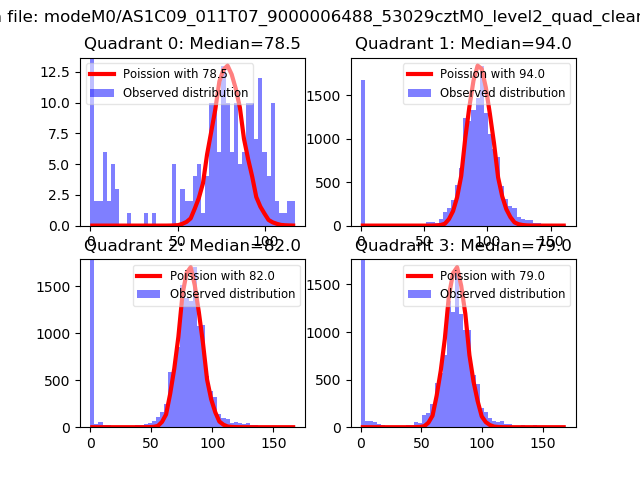 |
 |
| Quadrant-wise count rates Data is divided into 100 sec bins |
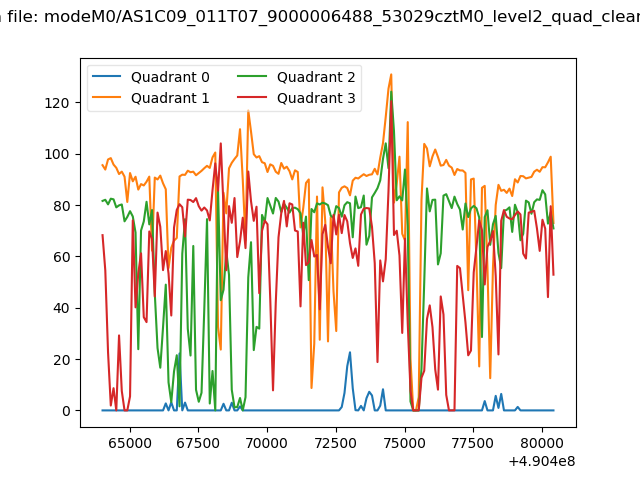 |
|
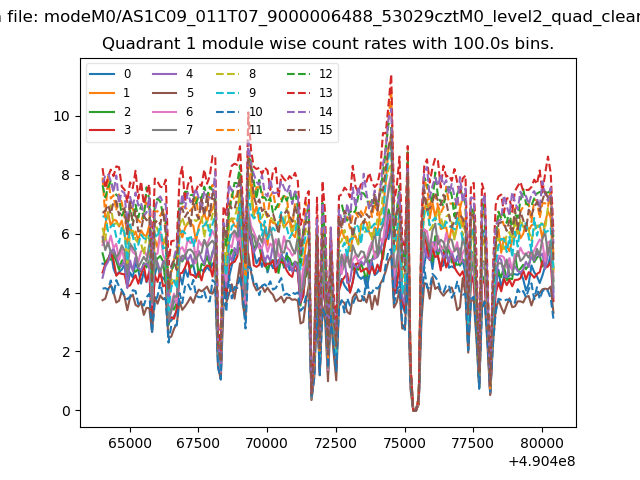
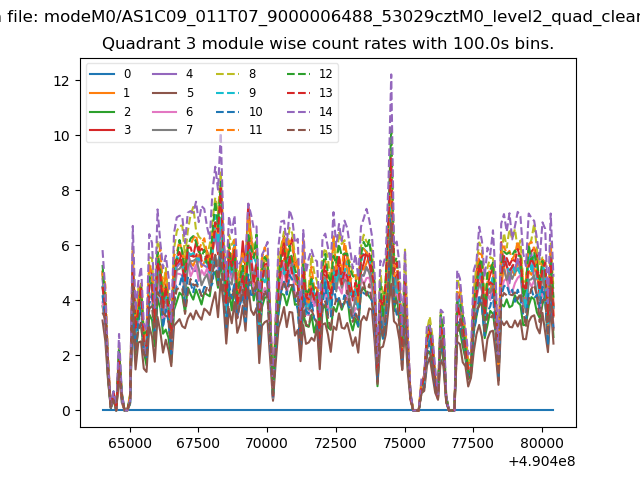
| Module-wise count rates for Quadrant A Data is divided into 100 sec bins |
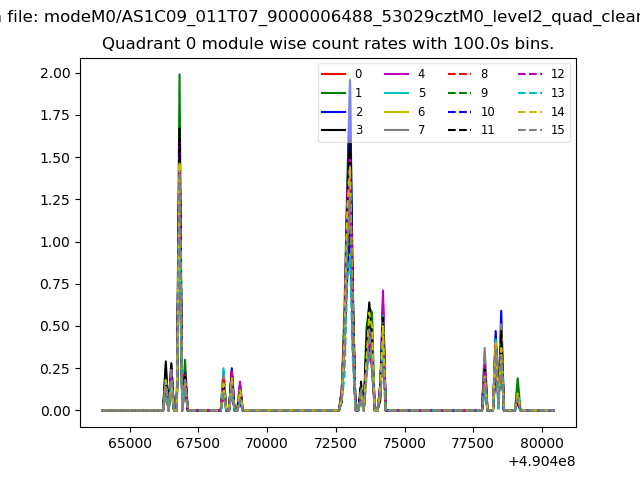 |
 |
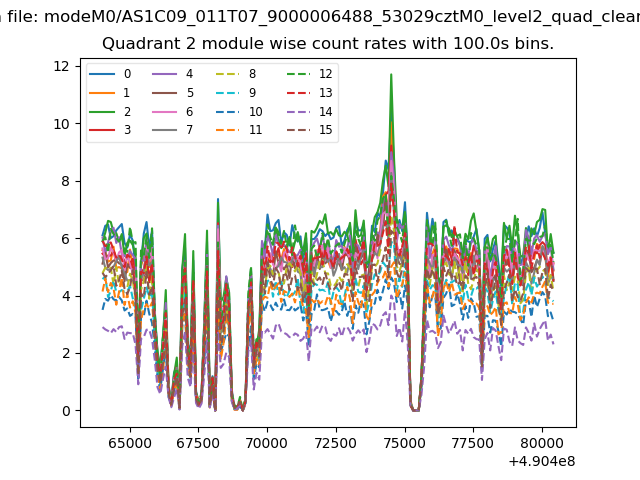
| Module-wise count rates for Quadrant B Data is divided into 100 sec bins |
 |
 |
| Module-wise count rates for Quadrant C Data is divided into 100 sec bins |
 |
 |
| Module-wise count rates for Quadrant D Data is divided into 100 sec bins |
 |
 |
| Parameter | Plot |
|---|---|
| CZT HV Monitor |  |
| D_VDD | 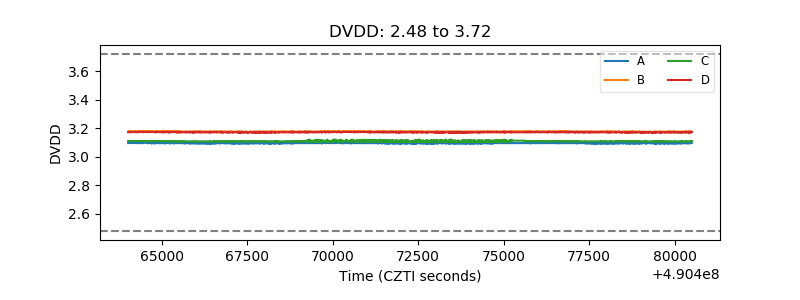 |
| Temperature 1 | 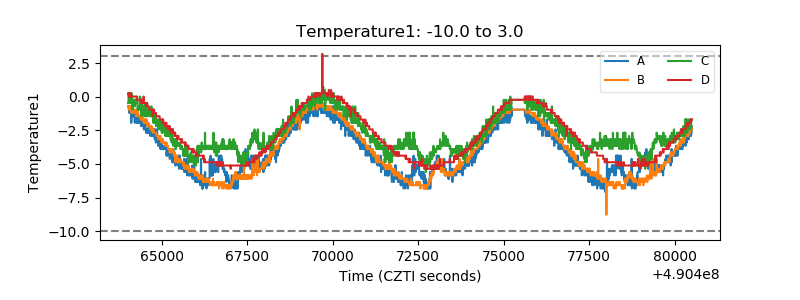 |
| Veto HV Monitor | 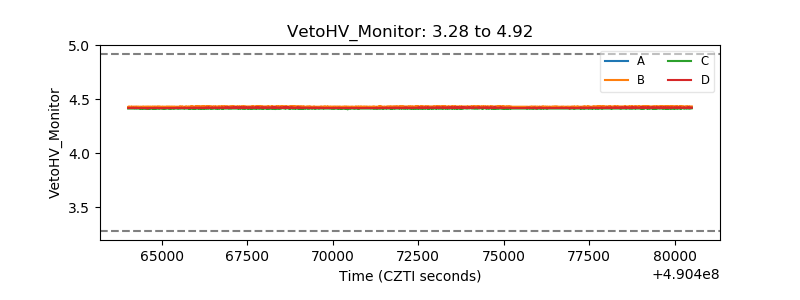 |
| Veto LLD | 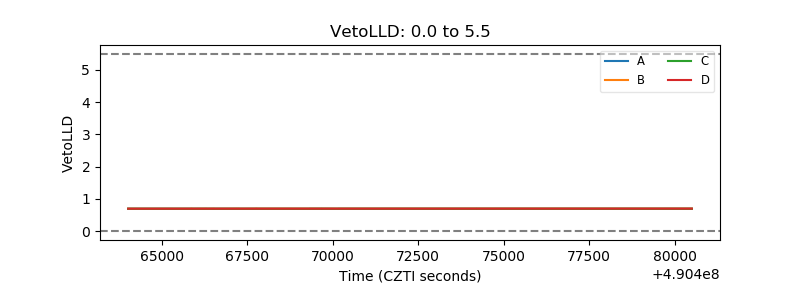 |
| Alpha Counter | 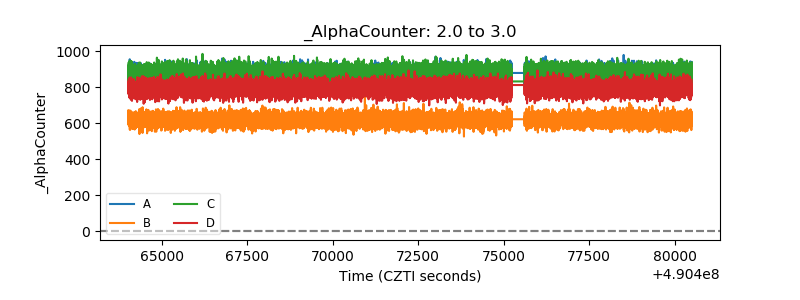 |
| _CPM_Rate | 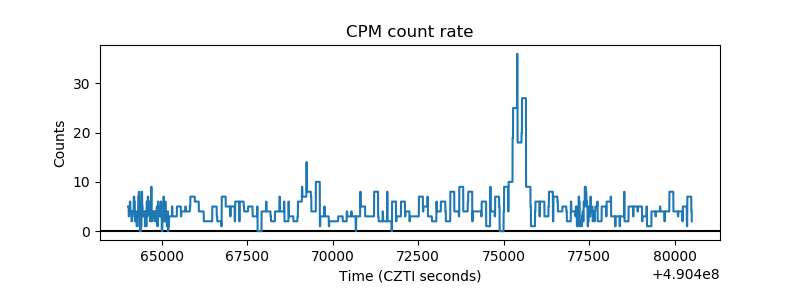 |
| CZT Counter | 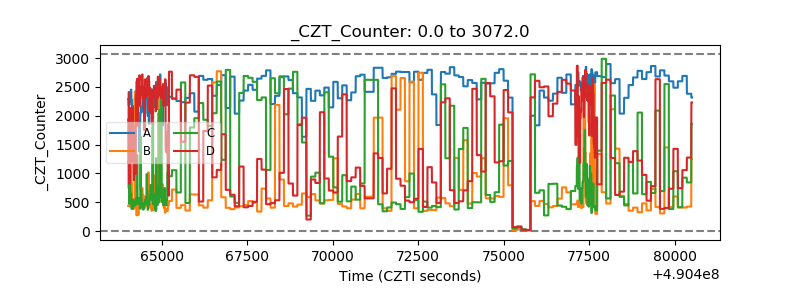 |
| +2.5 Volts monitor |  |
| +5 Volts monitor |  |
| _ROLL_ROT | 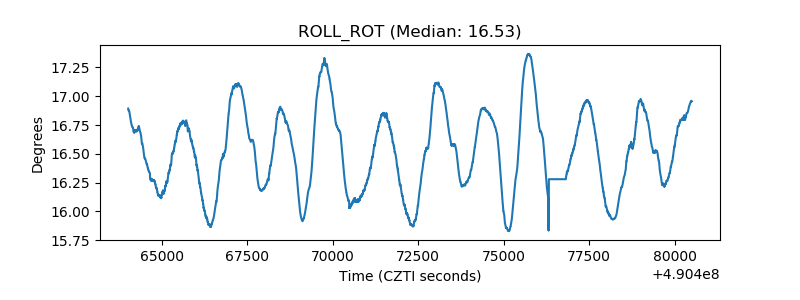 |
| _Roll_DEC | 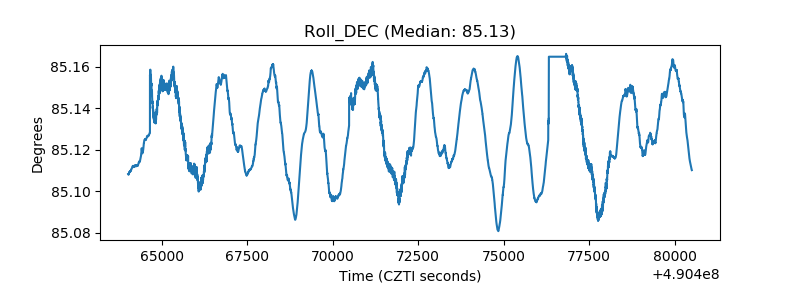 |
| _Roll_RA | 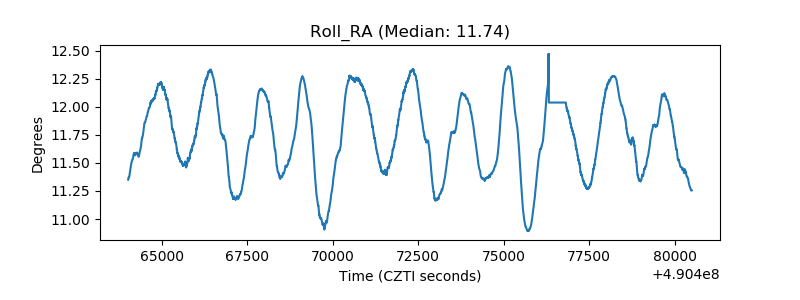 |
| Veto Counter | 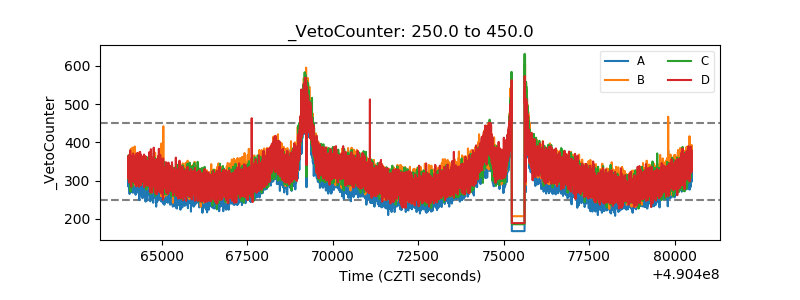 |