| Param | Original file | Final file |
|---|---|---|
| Filename | modeM0/AS1C09_011T07_9000006488_53030cztM0_level2.fits | modeM0/AS1C09_011T07_9000006488_53030cztM0_level2_quad_clean.evt |
| Size (bytes) | 2,517,894,720 | 124,263,360 |
| Size | 2.3 GB | 118.5 MB |
| Events in quadrant A | 35,086,762 | 8,801 |
| Events in quadrant B | 10,666,881 | 1,317,801 |
| Events in quadrant C | 22,265,541 | 824,302 |
| Events in quadrant D | 24,123,439 | 654,187 |
| Mode SS | |||
|---|---|---|---|
| Quadrant | BADHDUFLAG | Total packets | Discarded packets |
| A | 0 | 284 | 0 |
| B | 0 | 284 | 0 |
| C | 0 | 284 | 0 |
| D | 0 | 284 | 0 |
| Mode M9 | |||
|---|---|---|---|
| Quadrant | BADHDUFLAG | Total packets | Discarded packets |
| A | 0 | 23 | 0 |
| B | 0 | 23 | 0 |
| C | 0 | 23 | 0 |
| D | 0 | 23 | 0 |
| Mode M0 | |||
|---|---|---|---|
| Quadrant | BADHDUFLAG | Total packets | Discarded packets |
| A | 0 | 113700 | 3 |
| B | 0 | 41131 | 3 |
| C | 0 | 75815 | 3 |
| D | 0 | 81310 | 5 |
| Quadrant | Total seconds | Saturated seconds | Saturation percentage |
|---|---|---|---|
| A | 13839 | 13766 | 99.472505% |
| B | 13840 | 1047 | 7.565029% |
| C | 13840 | 5377 | 38.851156% |
| D | 13839 | 6715 | 48.522292% |
Noise dominated data is calculated using 1-second bins in cleaned event files. If a bin has >2000 counts, and if more than 50% of those come from <1% of pixels, then it is considered to be noise-dominated and hence unusable.
| Quadrant | # 1 sec bins | Bins with >0 counts | Bins with >2000 counts | High rate bins dominated by noise | Noise dominated (total time) | Noise dominated (detector-on time) | Marked lightcurve |
|---|---|---|---|---|---|---|---|
| A | 16178 | 13838 | 13526 | 13526 | 83.61% | 97.75% | 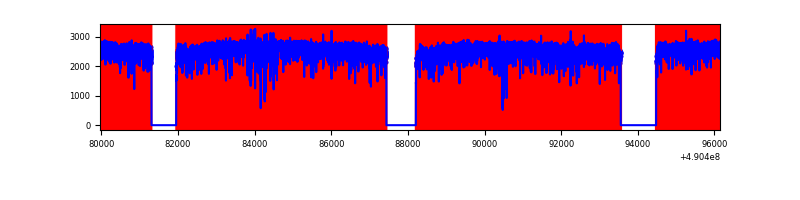 |
| B | 16180 | 13843 | 806 | 806 | 4.98% | 5.82% | 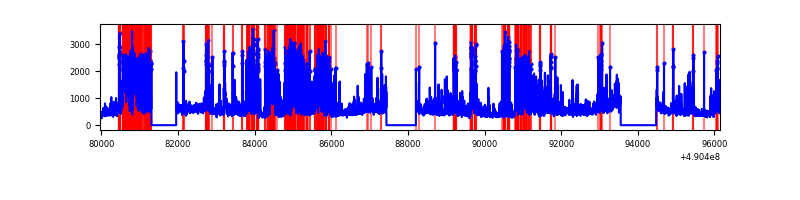 |
| C | 16180 | 13841 | 5368 | 5368 | 33.18% | 38.78% | 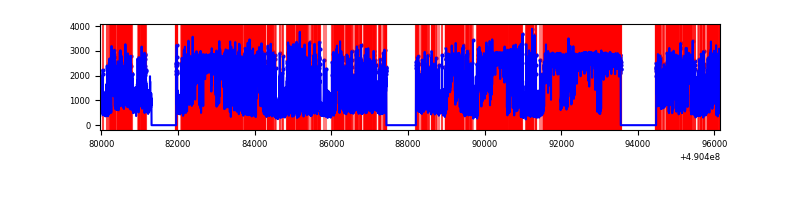 |
| D | 16179 | 13839 | 6466 | 6466 | 39.97% | 46.72% | 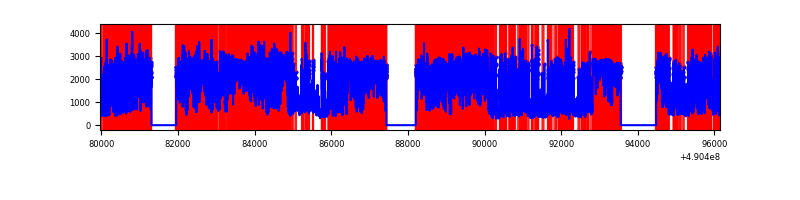 |
Top three noisy pixels from each quadrant. If the there are fewer than three noisy pixels in the level2.evt file, extra rows are filled as -1
| Pixel properties | Quadrant properties | ||||||
|---|---|---|---|---|---|---|---|
| Quadrant | DetID | PixID | Counts | Sigma | Mean | Median | Sigma |
| A | 9 | 191 | 33100003 | 362352.33 | 344 | 336 | 91.3 |
| A | 7 | 206 | 268349 | 2934.02 | 344 | 336 | 91.3 |
| A | 0 | 8 | 163381 | 1784.9 | 344 | 336 | 91.3 |
| B | 4 | 81 | 1591059 | 5335.85 | 1403 | 1358 | 297.9 |
| B | 10 | 44 | 1073614 | 3599.04 | 1403 | 1358 | 297.9 |
| B | 10 | 191 | 599222 | 2006.74 | 1403 | 1358 | 297.9 |
| C | 1 | 241 | 9401376 | 29957.85 | 1139 | 1126 | 313.8 |
| C | 15 | 224 | 2611888 | 8320.29 | 1139 | 1126 | 313.8 |
| C | 7 | 80 | 2441252 | 7776.49 | 1139 | 1126 | 313.8 |
| D | 2 | 153 | 6454462 | 20853.6 | 1058 | 1008 | 309.5 |
| D | 12 | 17 | 5300348 | 17124.21 | 1058 | 1008 | 309.5 |
| D | 8 | 176 | 4609430 | 14891.59 | 1058 | 1008 | 309.5 |
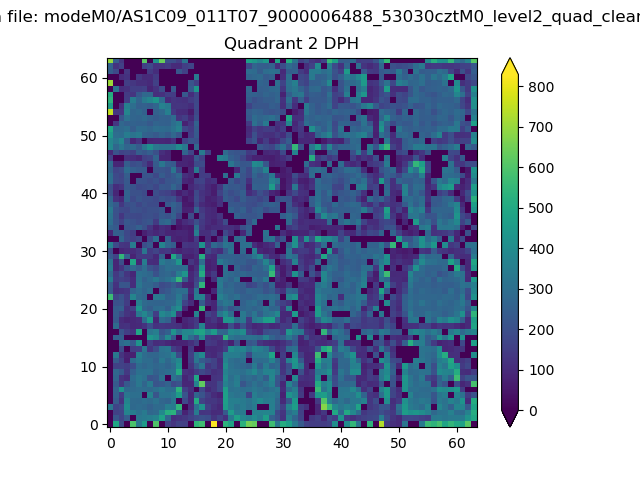
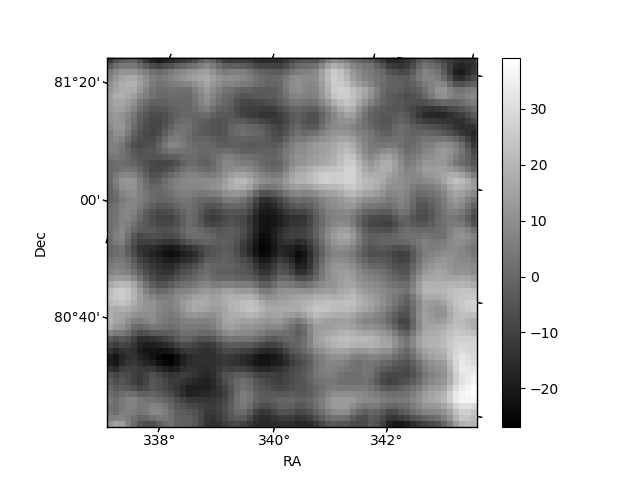
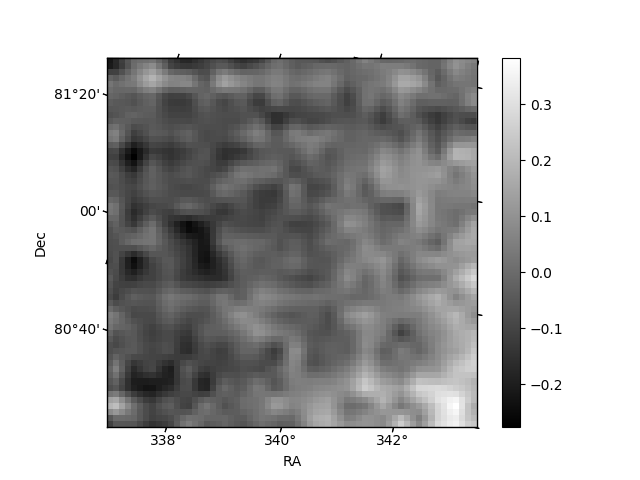
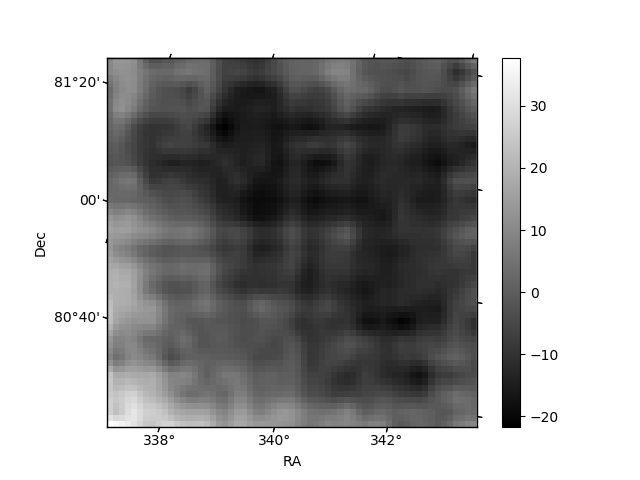
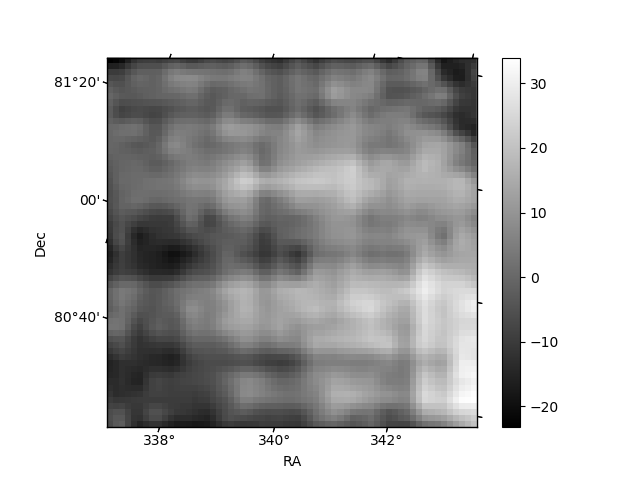
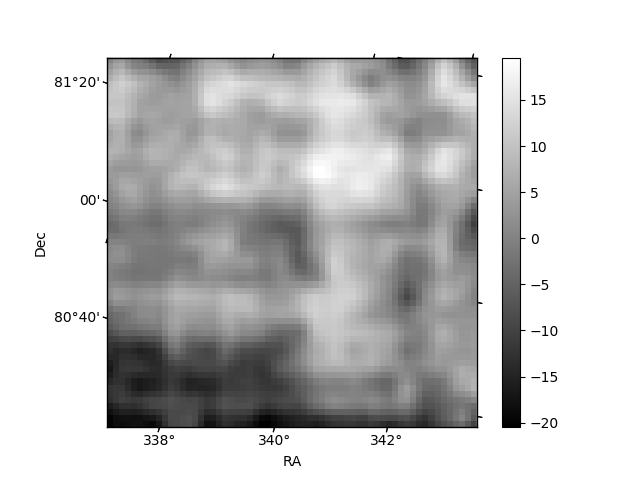
Histogram calculated using DETX and DETY for each event in the final _common_clean file
| Quadrant A | 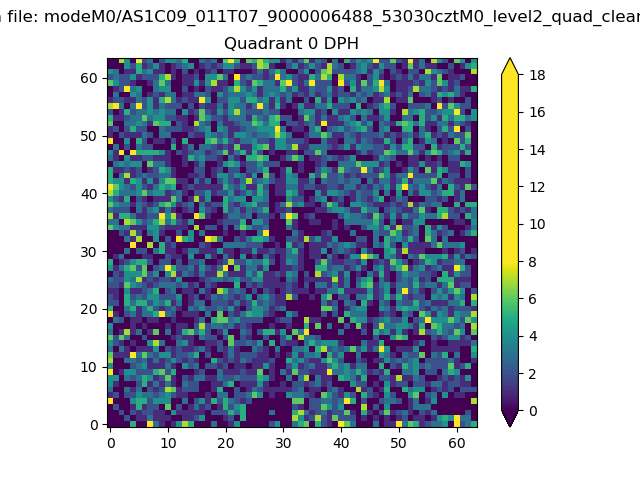 |
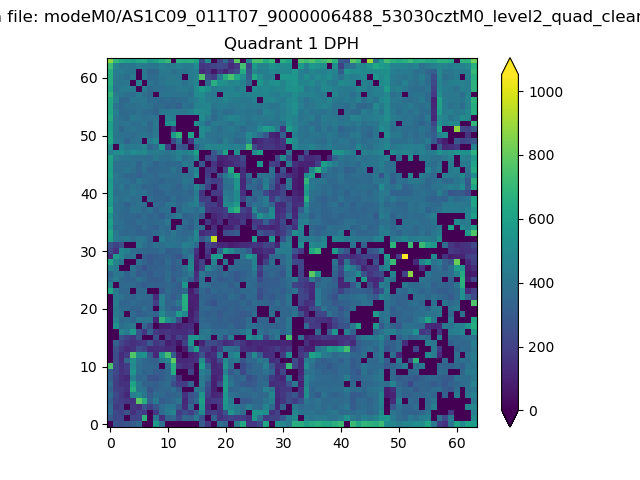 |
Quadrant B |
|---|---|---|---|
| Quadrant D | 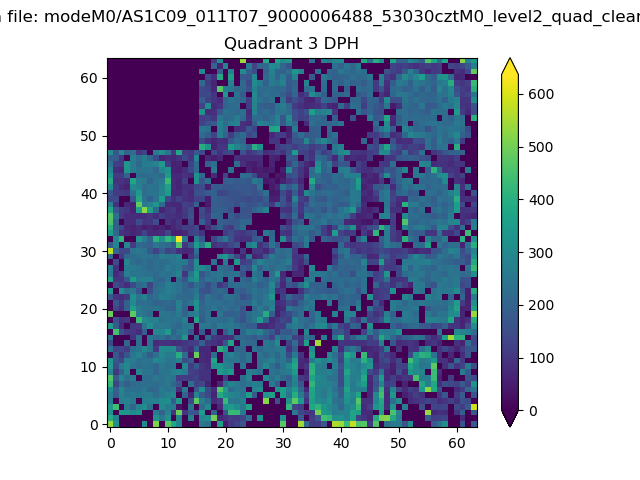 |
 |
Quadrant C |
| Plot type | Count rate plots | Images |
|---|---|---|
| Comparison with Poisson distribution Blue bars denote a histogram of data divided into 1 sec bins. Red curve is a Poisson curve with rate = median count rate of data. |
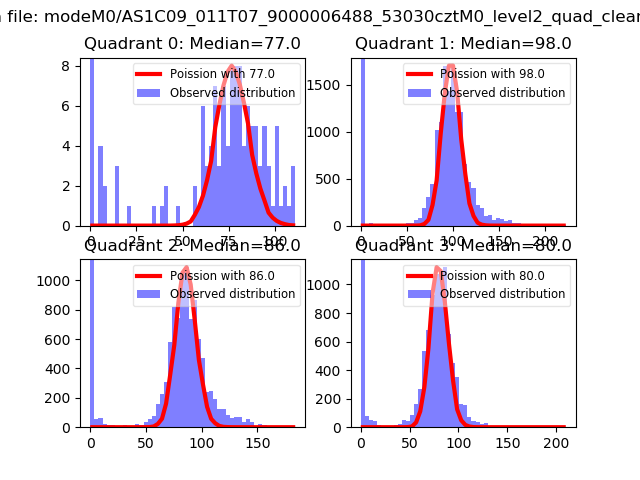 |
 |
| Quadrant-wise count rates Data is divided into 100 sec bins |
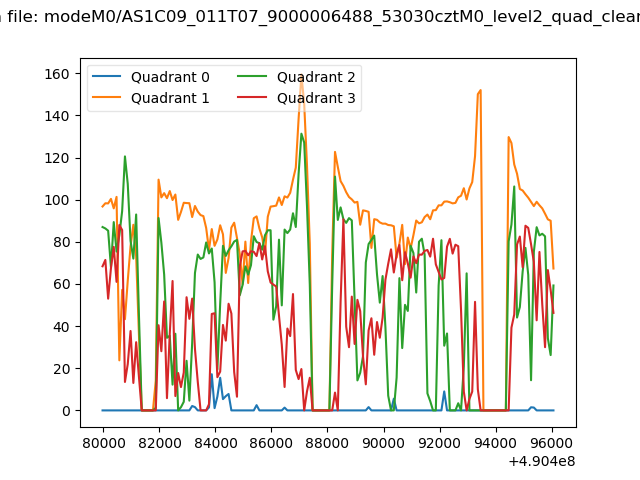 |
|
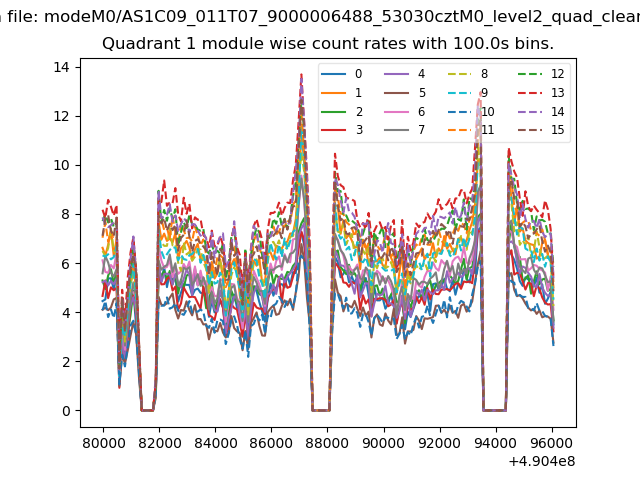
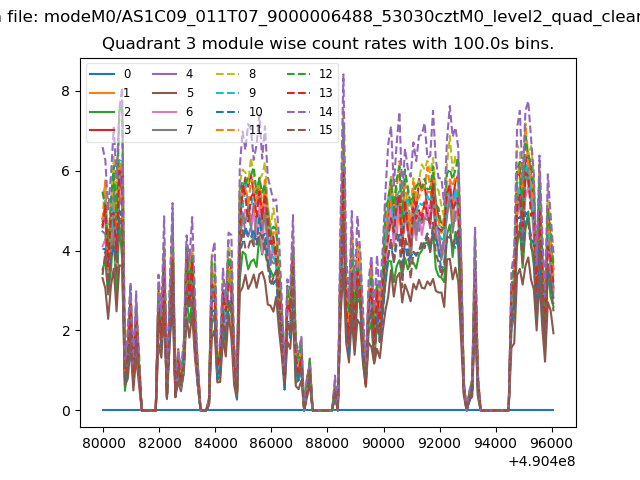
| Module-wise count rates for Quadrant A Data is divided into 100 sec bins |
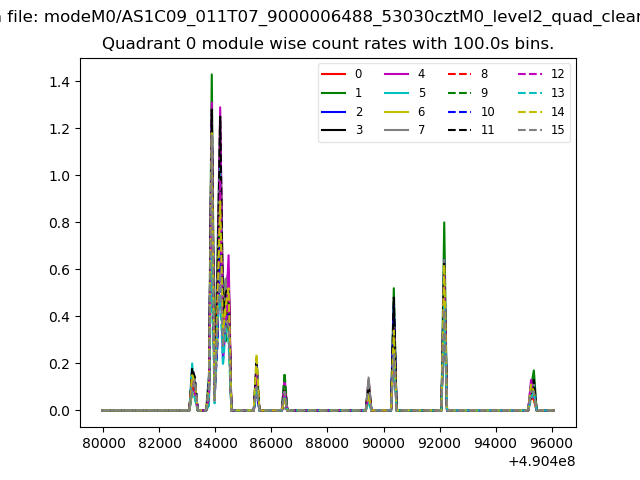 |
 |
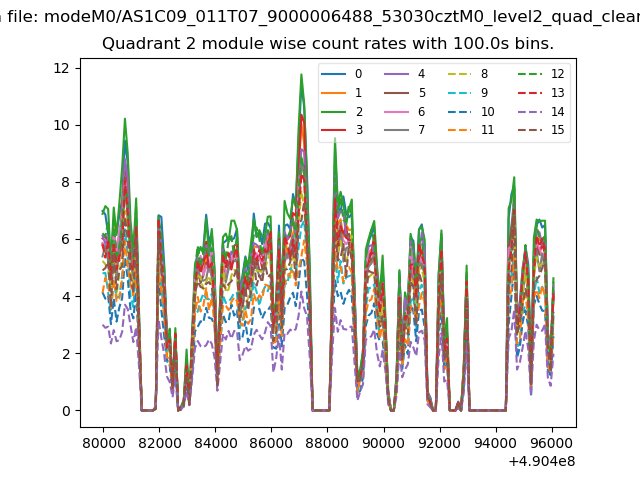
| Module-wise count rates for Quadrant B Data is divided into 100 sec bins |
 |
 |
| Module-wise count rates for Quadrant C Data is divided into 100 sec bins |
 |
 |
| Module-wise count rates for Quadrant D Data is divided into 100 sec bins |
 |
 |
| Parameter | Plot |
|---|---|
| CZT HV Monitor | 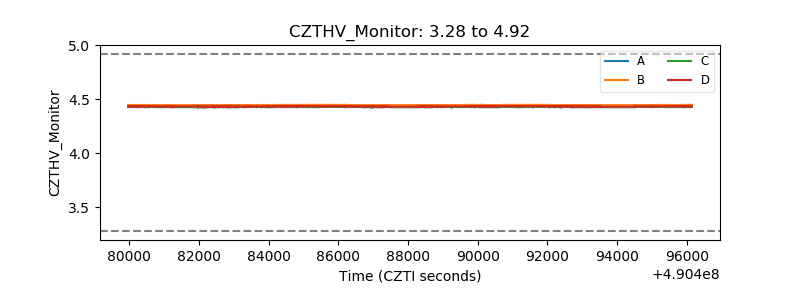 |
| D_VDD | 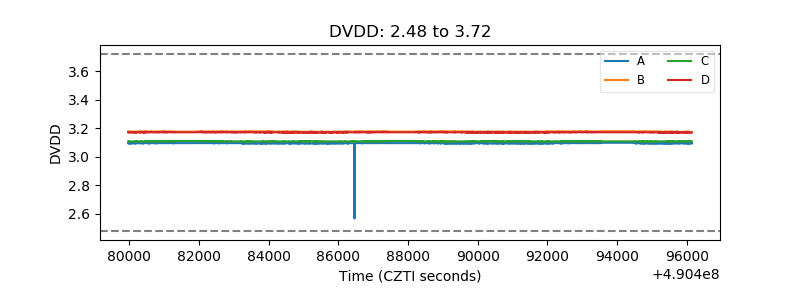 |
| Temperature 1 | 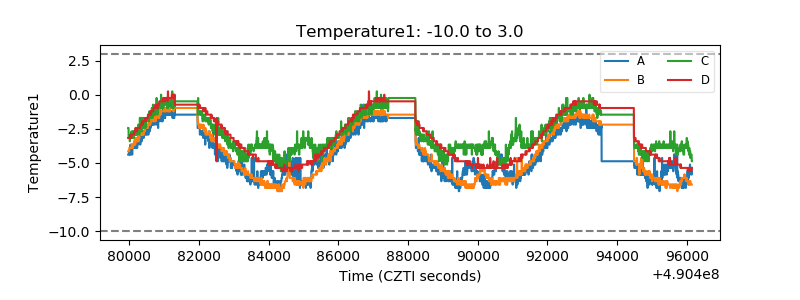 |
| Veto HV Monitor | 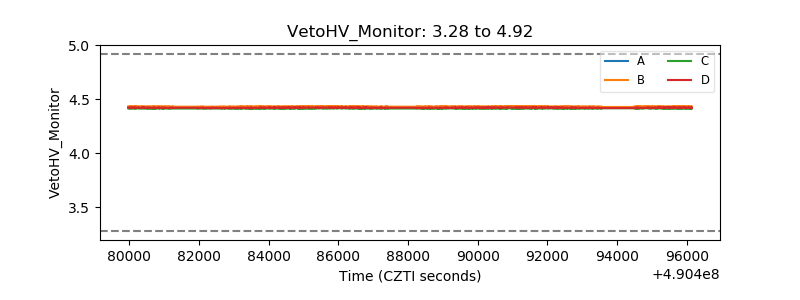 |
| Veto LLD | 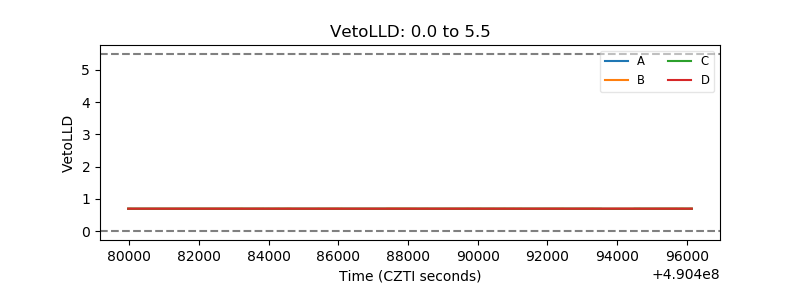 |
| Alpha Counter | 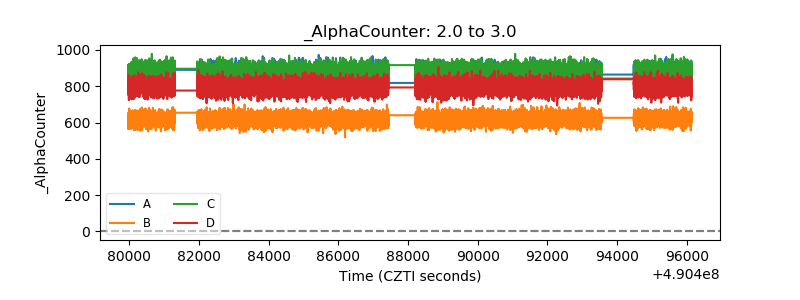 |
| _CPM_Rate | 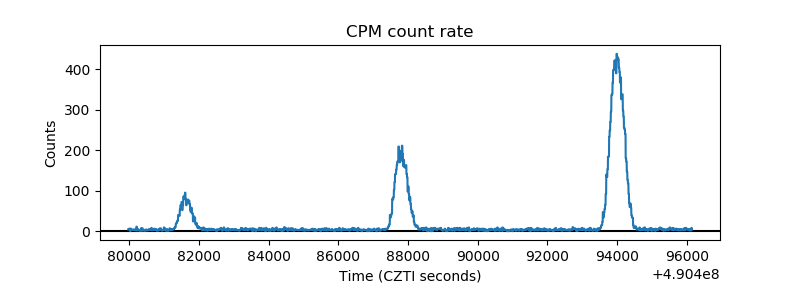 |
| CZT Counter | 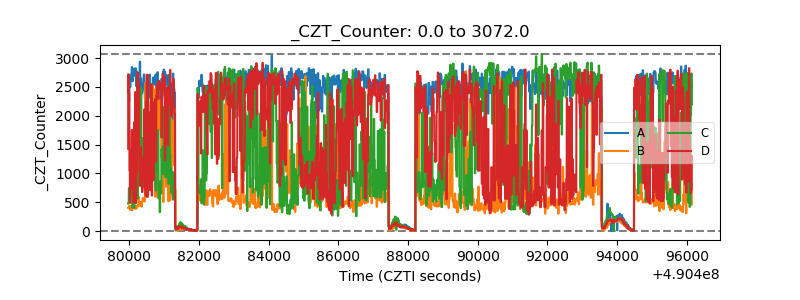 |
| +2.5 Volts monitor |  |
| +5 Volts monitor |  |
| _ROLL_ROT | 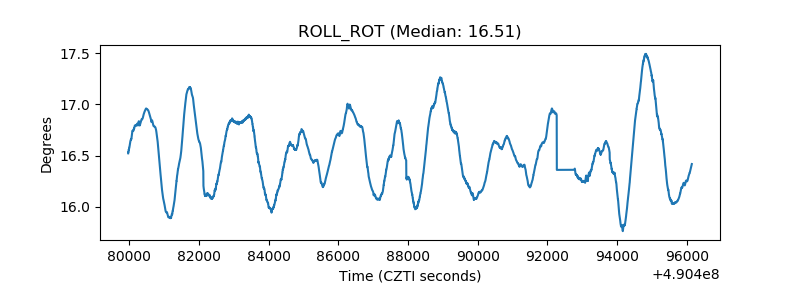 |
| _Roll_DEC | 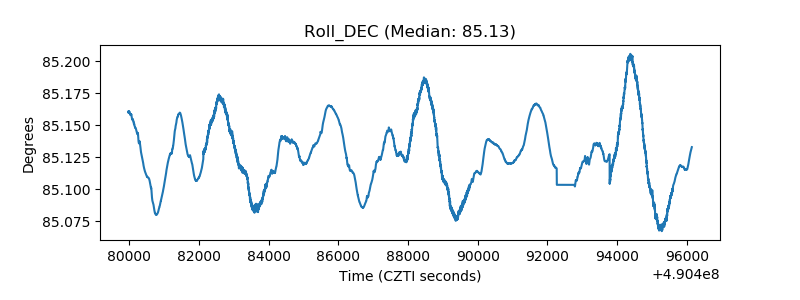 |
| _Roll_RA | 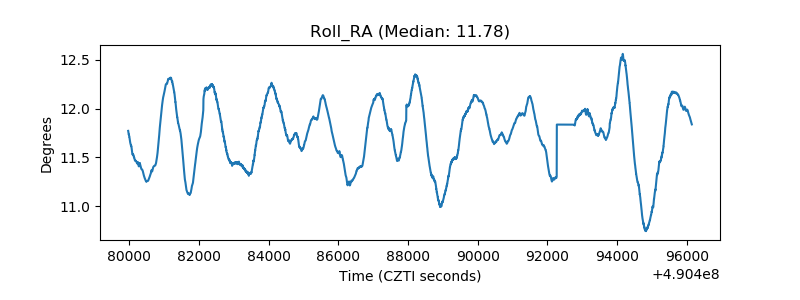 |
| Veto Counter | 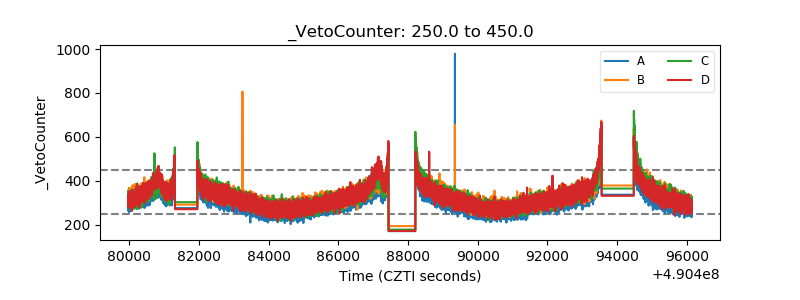 |